|
Parameters in the Model
Repressor Production Rate
Repressor production rate is determined by two factors:
- Promoter Strength (Transcription)
- Ribosome Binding Strength (Translation)
In the model, the total repressor production rate = alpha
The promoter strength cannot be easily changed because this would require mutations in the promoter or a different promoter/repressor combo. However, RBSs have been well characterized and the alpha parameter can be modulated by inserting different strength RBSs as determined by the model and testing.
Repressor Strength
The strength of the repressors is determined by:
- The repressor concentration, [Repressor].
- The cooperativity of repression, Beta.
In the Model, the repressor strength = [Repressor]^Beta
The Beta value is characteristic of each repressor and represents a constant that cannot be changed, but is very useful to know as it determines the robustness of the system.
Degradation
The degradation in the model is denoted by the term "-repressor," where the degradation constant is unity because the rates are relative, rather than absolute. The next iteration of the model will include degradation constants. Currently in the registry all of the repressors have strong degradation tags. Jason Kelly made a comment on one repressor and said he was suspicious of how strong of repression would be obtained from the repressors with degradation tags. We need strong repression for our system, so we may need to remove the tag for our system to function.
The Model
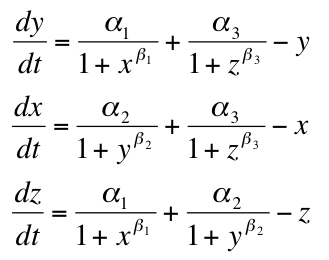
- Beta = Repression Strength
- Alpha = Repressor Production Rate
- X = Repressor1
- Y = Repressor2
- Z = Repressor3
The subscripts in the Model denote which construct the production rate or cooperativity of repression came from. So, alphaSub1 (tet, for example) is production rate under promoter1 (pTet) and betaSub1 (tet) is the cooperativity of Repressor1 (TetR).
These equations make sense because as alpha increases, so does the rate of production of repressor, dX/dt. As degradation increases, dX/dt goes down. As cooperativity increases, repression will increase for a given concentration of repressor and dX/dt will go down.
Stability
Blue points are stable combinations of repressor production rates, while the rest of the graph is comprised of unstable combinations of repressor production rates. This graph is for Beta = 2. The tristable region gets larger (i.e. more disparate alpha values will be able to constitute a tristable system) as beta gets larger. The tristable region disappears when Beta equals one or less.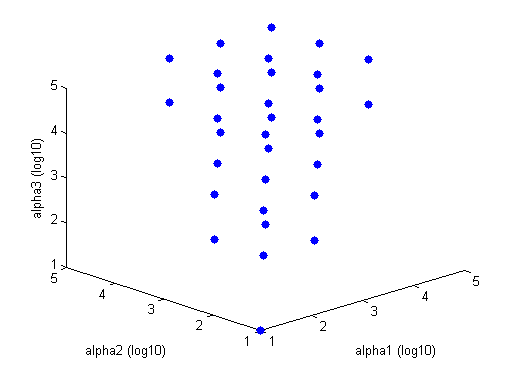
An easy visual aid to seeing how increased beta values (cooperativity of repression) leads to a more stable system consider the following graph of rate of production of repressor1 vs. the repressor that inhibits the production of repressor1. dx/dt vs. [y]
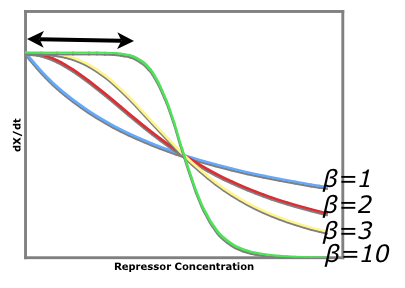
The black arrow shows that there is a larger region for larger beta values where stray repessors will not significantly affect the rate of repressor production rate whereas in a system of beta = 1, stray repressors will significantly change the system, making it less robust.
Modeling
The first draft of the code started last year:
Initial Table of Constants
Derivation of Model Equations
Media:tristable2006.txt This code proved to complicated to work with and a more simplified version was developed.
A simpler model based on the bistable paper was developed that takes the combined, relative transcription/translation rates into account Media:triStableCode.txt.
|


