Davidson Missouri W/Results
From 2007.igem.org
(→Dectection of Fluoresence by Spectroscopy) |
(→Dectection of Fluoresence by Spectroscopy) |
||
| Line 79: | Line 79: | ||
<br><br> | <br><br> | ||
Sample 1 = pLac GFP1-hix-GFP2, glows green on UV box<br> | Sample 1 = pLac GFP1-hix-GFP2, glows green on UV box<br> | ||
| - | Sample 2 = | + | Sample 2 = pT7-RFP1-hix-RFP2-GFP1-hix-GFP2-TT-hix-RFP2-TT-hix , glows yellow on UV box<br> |
| - | Sample 3 = | + | Sample 3 = pT7-RFP1-hix-RFP2-GFP1-hix-RFP2-TT-hix-GFP2-TT-hix , glows red on UV box<br> |
| - | Sample 4 = | + | Sample 4 = pT7-RFP1-hix-GFP2-TT-hix-RFP2-GFP1-hix-RFP2-TT-hix , does not glow on UV box<br> |
<br> | <br> | ||
Revision as of 16:17, 24 October 2007
Contents |
Results
Gene Splitting

We were able to split two genes: GFP and RFP. Split GFP has strong green fluorescence. Split RFP's red color is much reduced compared to wild-type RFP. It takes overnight incubation at room temperature for the red color to be visible in white light. Both colors are fluorescent under UV light, although the green color predominates. In the first image below, a negative-control (on the left) does not fluoresce, but split GFP (on the right) does.
We also wanted to test fluorescence phenotypes with both proteins in the same cells. Below on the left are cells containing both split GFP and split RFP, downstream of the T7 RNA polymerase promoter and co-transformed with T7 RNA polymerase plasmid. These cells look bright green, but the red color is hard to see under UV light. Under white light, the green color is not apparent, but the cells are a little pink. The cells only containing split RFP, on the right, are clearly pink under UV light. However, not all cells are equally colored - some are greener than others, which is a curious result as the cells do not contain GFP of any form.

In addition to the regular split GFP and split RFP constructs, we also wanted to test some "hybrid" constructs to ensure that they would not fluoresce. GFP and RFP have similar structures and functions. Previous studies have shown that it is possible to modify GFP to display a wide range of color phenotypes. We created the following parts: Plac-RBS-RFP1-hixC-GFP2 and Plac-RBS-GFP1-hixC-RFP2. A plasmid may, at some point during its flipping process, contain such sequences. We tested to make sure that the similarity of these two proteins did not make them compatible enough to fluoresce. It was found that neither of these parts show any fluorescence or color change.
Constructs
Once we managed to split two genes we proceeded to implement two different graphs in plasmids.


We built the following constructs:
- Positive Control to both A and B
- Solved Orientation - Graph A

- Easy Orientation - Graph A

- Difficult Orientation - Graph A

- Difficult Orientation - Graph B


Part Flipping and Computation
Co-transformation of the unsolved HPP plasmids with the Hin vector begins flipping and computation. Subsequent co-transformation with the T7 RNA polymerase vector then initiates transcription.
We have found that all colonies with the HPP plasmids showed unexpected green color. The green is distinguishable by eye or fluorometer from GFP's color. As a control, we showed that the T7 RNA polymerase vector does not create the green color, so we are confident that the HPP vectors are responsible.
One possibility we had tested was that hybrid parts, such as RFP1-hixC-GFP2 and GFP1-hixC-RFP2 produced functional fluorescent proteins. However, we created these parts and tested them, and found that there was no fluorescence when the pLac promoter was upstream (parts BBa_I715035 and BBa_I715036).
Another possibility is that these hybrid proteins cannot fluoresce independently, but will emit color when in tetramers. Wild-type GFP and RFP are tetrameric, but the registry versions of the parts, BBa_E0040 and BBa_E1010 are monomeric mutants. It would be possible to test this hypothesis by running purified protein on a non-denaturing gel.


Flipping Detection by Phenotype
Missouri Western built 3 constructs each representing one of the problems. They were labeled as ABC, ACB, and BAC with ABC a positive control as an already solved problem, ACB as a medium difficulty problem, and BAC as a difficult problem.

Each of the three constructs ABC, ACB, and BAC were used to transform E. coli cells that express T7 RNAP. As expected, the ABC transformance glowed yellow (red + green), the ACB transformance glowed red, and the BAC transformance did not glow. A fragment containing the Hin expression cassette (pLac-RBS-Hin-LVA, BBa_S03536) was ligated into each of the ABC, ACB, and BAC constructs and transformed into T7 RNAP cells. A colony from each was picked and grown overnight for plasmid mini-prep. Each of the three constructs was restriction digested and the insert sizes were varified to be correct. The three constructs were then retransformed into T7 RNAP cells and the resulting transformation mixture was streaked for colony isolation.The Hin ABC plate produced mostly yellow colonies but also red and green. The Hin ACB plate started off to be red and produced green and yellow colonies. The Hin BAC plate produced mostly nonfluorescent colonies with a few green and red colonies.


Flipping Dectected by PCR

Dectection of Fluoresence by Spectroscopy
We used a fluorescent spectrometer to measure the fluorescence of wild type GFP, wild type GFP, the versions of these two split by hix sites, and new combinations of the GFP and RFP gene halves. We were able to detect fluorescence in bacterial cells by simply mixing the cells with 200 ul of water and measuring in a microtiter plate.
We first had to determine the excitation and emission wavelengths that would allow us to detect the green and red fluorescence. Scans were conducted in order to find these wavelengths. For example, the graphs below shows scans of excitation wavelengths that produce fluorescence at an emission wavelength of 515 nm, the wavelength we found to be best for green, and 608 nm, the best wavelength for red.
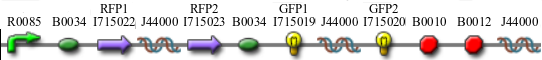
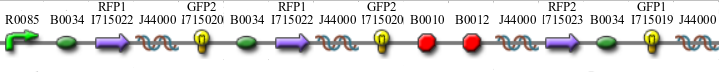
Sample 1 = pLac GFP1-hix-GFP2, glows green on UV box
Sample 2 = pT7-RFP1-hix-RFP2-GFP1-hix-GFP2-TT-hix-RFP2-TT-hix , glows yellow on UV box
Sample 3 = pT7-RFP1-hix-RFP2-GFP1-hix-RFP2-TT-hix-GFP2-TT-hix , glows red on UV box
Sample 4 = pT7-RFP1-hix-GFP2-TT-hix-RFP2-GFP1-hix-RFP2-TT-hix , does not glow on UV box


On the basis of these scans, we used excitation/emission wavelengths of 450 nm / 515 nm for green and 560 nm / 608 nm for red.
Sample Green Red
pLac-GFP1-hix-GFP2 green 193 18
pT7-RFP1-hix-RFP2-GFP1-hix-GFP2-TT-hix-RFP2-TT-hix yellow 397 273
pT7-RFP1-hix-RFP2-GFP1-hix-RFP2-TT-hix-GFP2-TT-hix red 58 161
pT7-RFP1-hix-GFP2-TT-hix-RFP2-GFP1-hix-RFP2-TT-hix none 68 21
pLac-RFP1-hix-RFP2 none 57 165
pLac-GFP none 66 20
pLac-RFP red 64 281
pLac-GFP1-hix-RFP2 none 68 20
pLac-RFP1-hix-GFP2 none 70 20
pLac-RFP-GFP red 201 388
pT7-RFP1-hix-RFP2-GFP1-hix-GFP2 green 129 36
pT7-RFP1-hix-GFP2-RFP1-hix-GFP2-TT-hix-RFP2-GFP1-hix yellow 71 21

