Modelling
From 2007.igem.org
(Difference between revisions)
(→Mathematical Modelling) |
|||
| Line 8: | Line 8: | ||
[[Image:UW_Graphs.png|thumb|center|800px|Mathematical modelling of the bacterial half-adder]] | [[Image:UW_Graphs.png|thumb|center|800px|Mathematical modelling of the bacterial half-adder]] | ||
| + | |||
<center> | <center> | ||
| - | [[Waterloo | Home ]] | + | [[Waterloo | Home ]] | [[Project | Project]] | [[Modelling | Mathematical Modelling]] | [[Construction_&_Testing | Construction & Testing]] | [[Extensions | Future Work]] |
</center> | </center> | ||
Revision as of 19:11, 26 October 2007
Mathematical Modelling
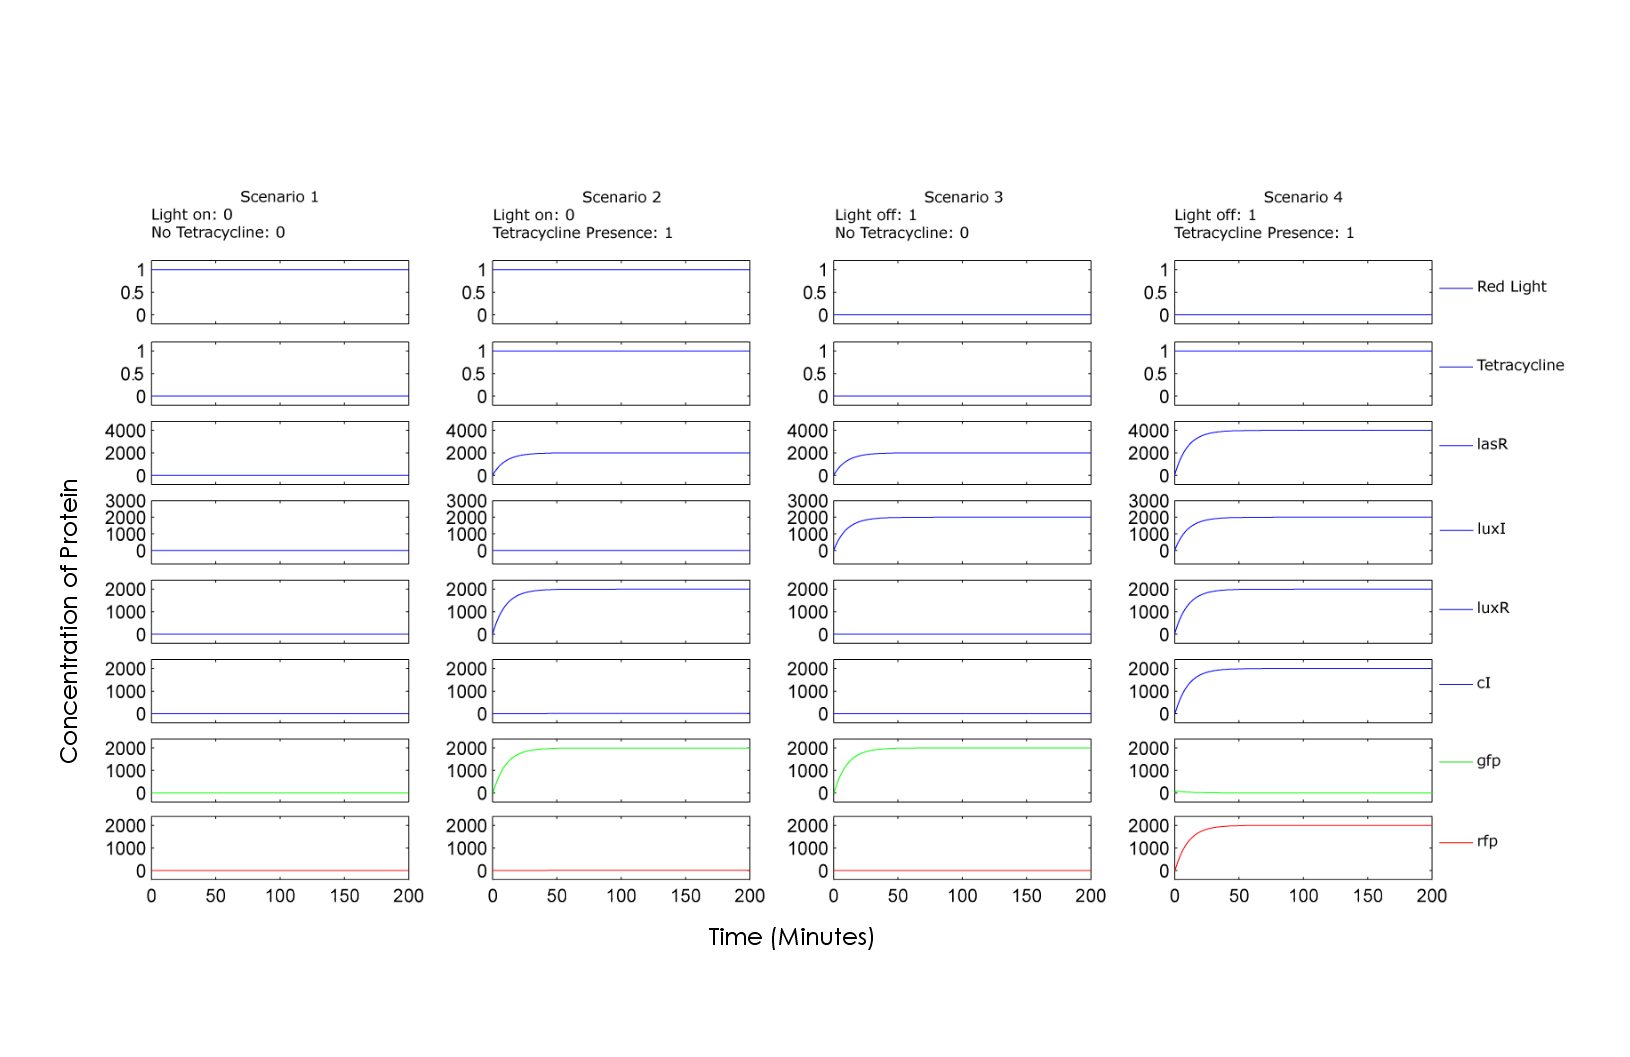
To create a predictive model, we used a set of differential equations to graph the approximate concentrations of each chemical with respect to time. These graphs are intended to illustrate the relative concentrations of the chemicals involved for each possible combination of input A and input B, red light and tetracycline respectively.
Scenario 1 of the graph illustrates the concentration of chemicals when adding 0+0, showing no production of either GFP or RFP. Scenario 2 illustrates the 0+1 case, showing production of GFP; similarly, scenario 3 illustrates the 1+0 case, also resulting in GFP. Finally scenario 4 illustrates 1+1 case where both inputs being on results in production of RFP.
Home | Project | Mathematical Modelling | Construction & Testing | Future Work

