Princeton/Template:temp
From 2007.igem.org
| Line 1: | Line 1: | ||
__NOEDITSECTION__ | __NOEDITSECTION__ | ||
| + | |||
| + | =Overview= | ||
| + | |||
| + | Breast cancer, according to the [http://www.who.int World Health Organization (WHO)] [http://www.who.int/mediacentre/factsheets/fs297/en/ (ref)], is the leading cause of cancer deaths in women worldwide. As a significant cause of cancer deaths, breast cancer serves as an appropriate cancer to target in a proof of concept implementation of our general design using the established MCF-7 cell line. | ||
| + | |||
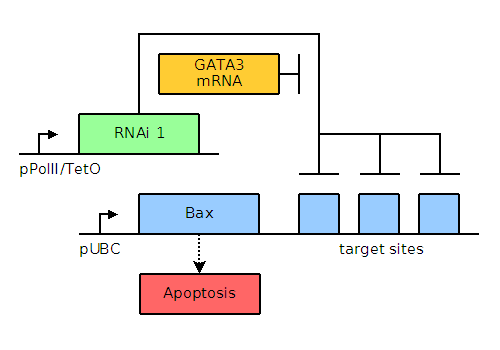
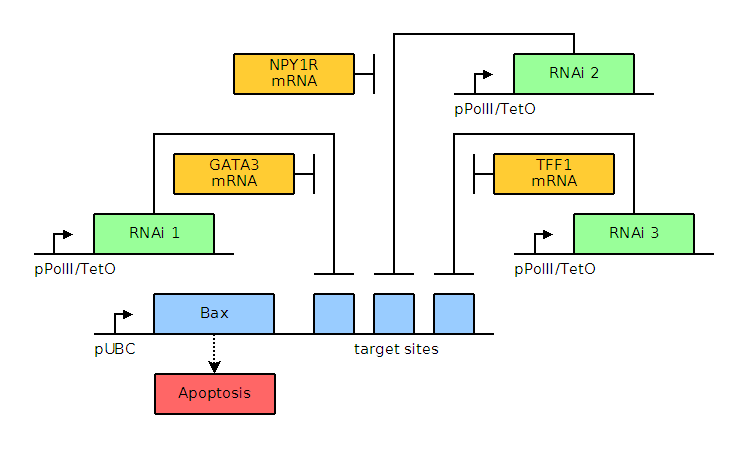
| + | The genetic circuits for systems of varying complexity are given below, including a basic system, an AND gate, an AND OR gate. | ||
| + | |||
| + | [[Image:Princeton_circuit_basic.png|center|frame|Figure 1. image: Basic circuit based on GATA3 mRNA levels only.]] | ||
| + | |||
| + | [[Image:Princeton_circuit_AND.png|center|frame|Figure 2. image: AND circuit based on multiple biomarkers.]] | ||
| + | |||
| + | [[Image:Princeton_circuit_ANDOR.png|center|frame|Figure 3. image: AND OR circuit based on multiple biomarkers.]] | ||
| + | |||
=Simulation= | =Simulation= | ||
Revision as of 04:59, 25 October 2007
Overview
Breast cancer, according to the World Health Organization (WHO) (ref), is the leading cause of cancer deaths in women worldwide. As a significant cause of cancer deaths, breast cancer serves as an appropriate cancer to target in a proof of concept implementation of our general design using the established MCF-7 cell line.
The genetic circuits for systems of varying complexity are given below, including a basic system, an AND gate, an AND OR gate.
Simulation
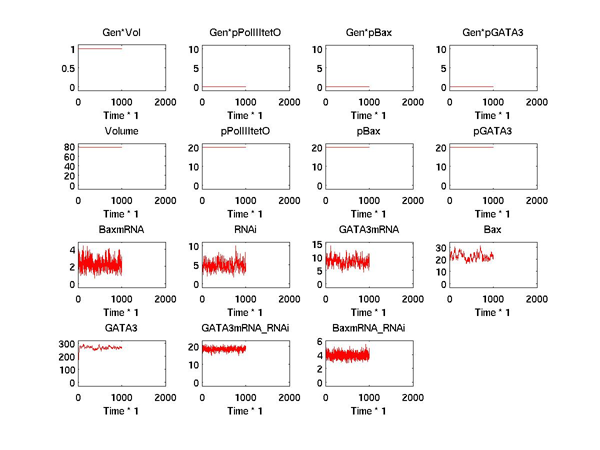
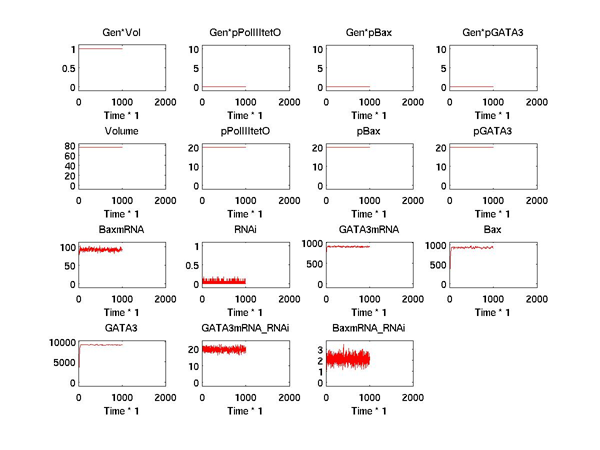
A version of the Stochastirator, a stochastic simulation program, modified by Weiss lab, driven by Mathworks Matlab is used to model the state of our systems.
The corresponding source, brief tutorial for our internal systems, and recent code snapshot is provided as an archive, for reference.
The figures corresponding to a basic version of our system are given below.


