Tokyo/Formulation/1.toggle model
From 2007.igem.org
| Line 16: | Line 16: | ||
<br>[[Image:Siki2.jpg|200px|]] | <br>[[Image:Siki2.jpg|200px|]] | ||
| - | <br> | + | <br>which indicate the nullclines of the system shown in Fig●. |
| - | + | ||
<br>About parameters,we use three sets of parameters. | <br>About parameters,we use three sets of parameters. | ||
<br> 1)the maximum expression rate of repressor A and repressor B is balanced,and hill coefficient of both A and B is three. | <br> 1)the maximum expression rate of repressor A and repressor B is balanced,and hill coefficient of both A and B is three. | ||
| Line 31: | Line 30: | ||
<br>[[Image:toggle3.jpg|200px|]] [[Image:toggle4.JPG|200px|]] [[Image:toggle5.JPG|200px|]][[Image:toggle1-1.jpg|200px|]] | <br>[[Image:toggle3.jpg|200px|]] [[Image:toggle4.JPG|200px|]] [[Image:toggle5.JPG|200px|]][[Image:toggle1-1.jpg|200px|]] | ||
| - | <br>安定点B付近から始めるとB状態で安定し,安定点A付近から始めるとA状態で安定しているのが分かる. | + | <br> |
| + | |||
| + | 安定点B付近から始めるとB状態で安定し,安定点A付近から始めるとA状態で安定しているのが分かる. | ||
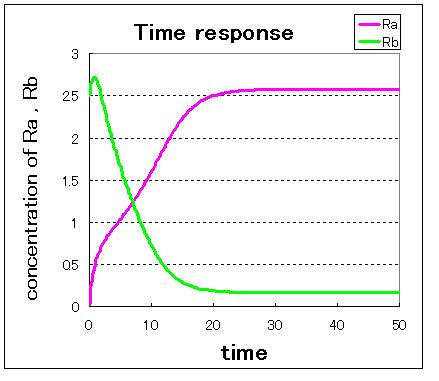
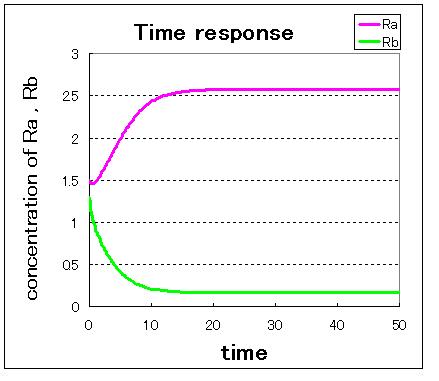
不安定点付近から始めるとどちらかで安定化する. | 不安定点付近から始めるとどちらかで安定化する. | ||
Revision as of 00:57, 24 October 2007
1.toggle model
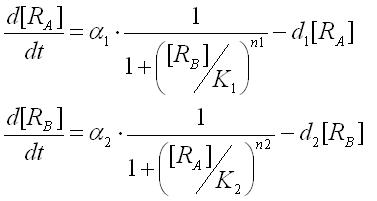
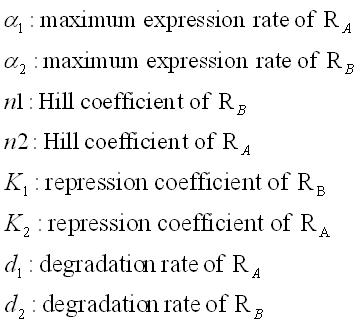
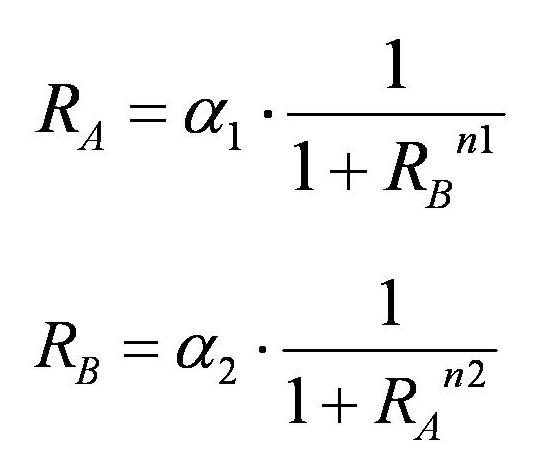
First,the ordinary differential equations(ODEs) of the toggle switch were derived as
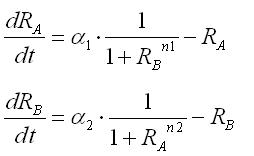
These equations were normalized as follows:
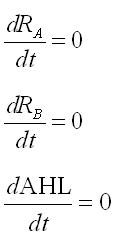
In the steady state,time derivatives are zero:
As a result,the nullclines of this system were derived as
which indicate the nullclines of the system shown in Fig●.
About parameters,we use three sets of parameters.
1)the maximum expression rate of repressor A and repressor B is balanced,and hill coefficient of both A and B is three.
2)the maximum expression rate of repressor A and repressor B is equal,and hill coefficient of A is one.
3)the maximum expression rate of repressor A and repressor B is not balanced,and hill coefficient of both A and B is three.


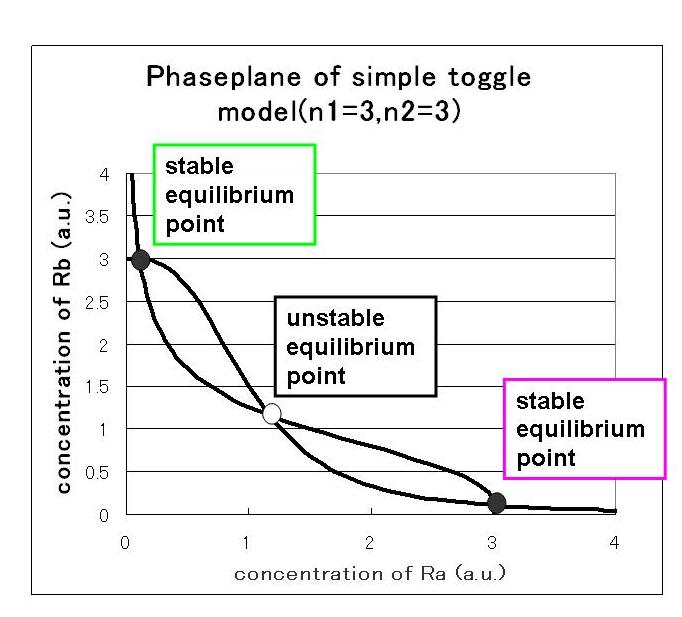
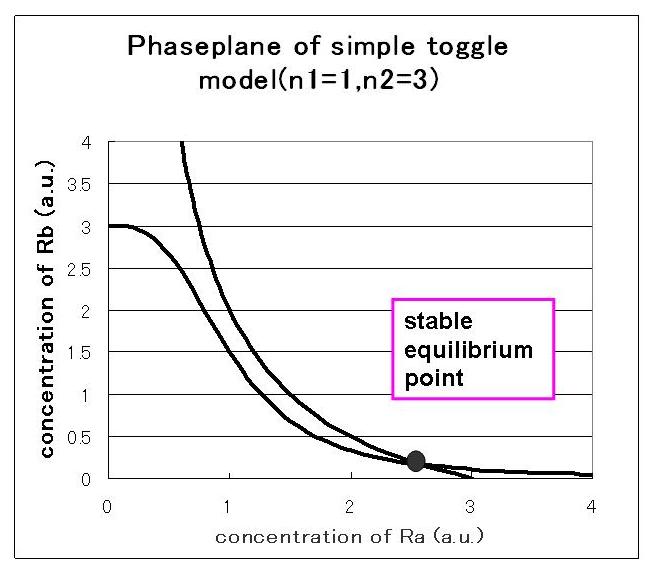
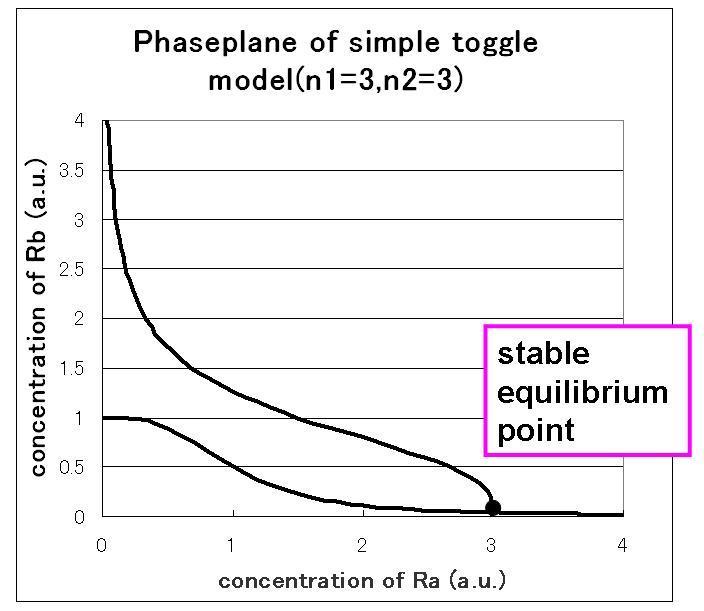
we correlate phaseplane analysis and simulation results.
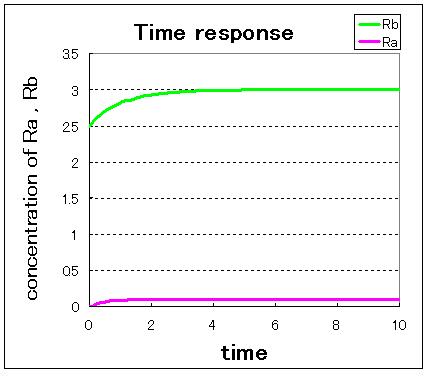
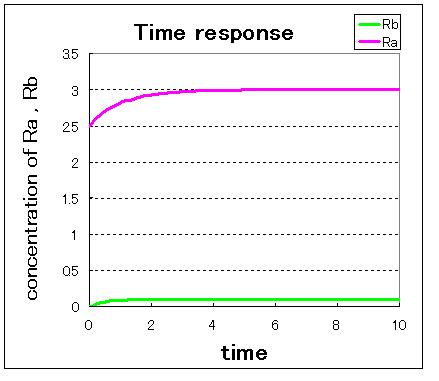
First,we simulate about the phaseplane of two stable equilibrium points(the upper left figure) and use three kinds of initial values.
1. (Ra:low , Rb:high) 2. (Ra:high , Rb:low) 3. (Ra:middle , Rb:middle)
安定点B付近から始めるとB状態で安定し,安定点A付近から始めるとA状態で安定しているのが分かる. 不安定点付近から始めるとどちらかで安定化する.
Next,
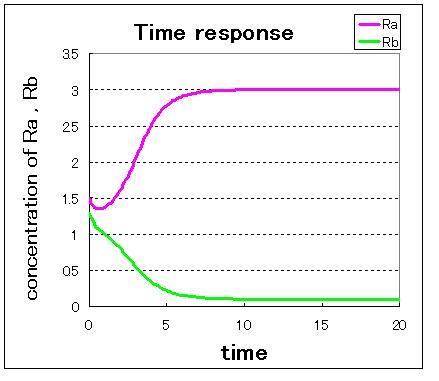
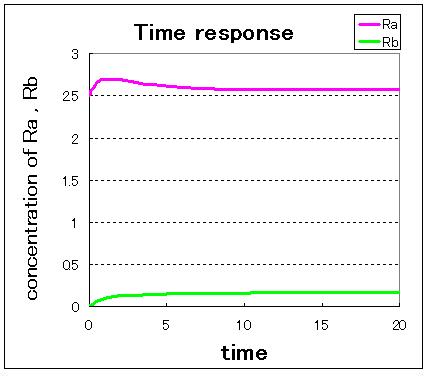
次に,安定点が一つしかない場合のシミュレーション結果は下のようになる.
安定点が一つしかない場合は,安定点B付近から始めてもA状態で安定化してしまうのが分かる.
As a result,taking two stable status need the phaseplane of two stable equilibrium points and we have to set proper parameters.
