|
Tri-stable Toggle Switch
The purpose of the Tri-stable Toggle Switch is to produce three distinct and stable outputs in response to three distinct inputs. These three inputs are three separate chemicals which will each induce one state of the switch. 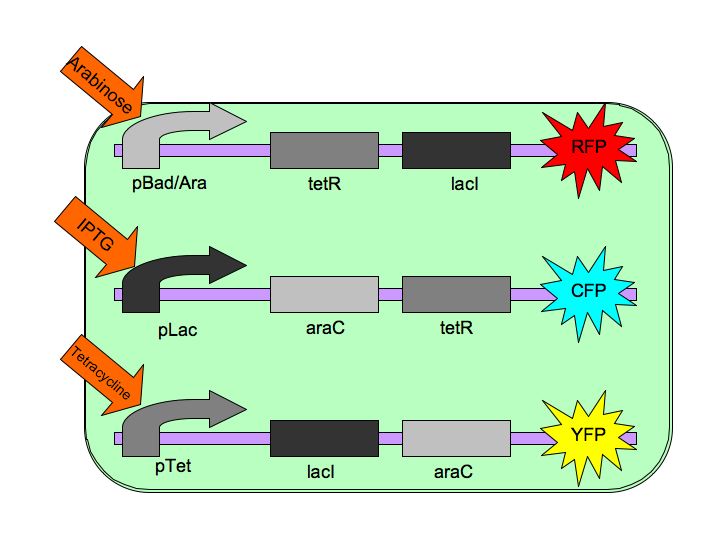 The Tri-stable Toggle Switch Architecture pBAD->LacI->TetR,
pLacI->AraC->TetR and
pTet->AraC->LacI,
where AraC represses pAraC/BAD, LacI represses pLac and TetR represses pTet.
Each of the three repressors are inactivated by one of three chemicals, the three inducer chemicals mentioned earlier. These three(arabinose, IPTG (Isopropyl β-D-1-thiogalactopyranoside) and Tetracycline, respectively), cause conformational changes in their respective repressor proteins which keeps them from binding to DNA in an inhibitory manner which leads to gene expression. For example, in the presence of arabinose, AraC cannot repress pAraC/BAD so LacI and TetR are produced which in turn repress pTet and pLac and the pAraC/BAD construct is turned on.
AraC/BAD
The gene AraC, one of several genes (AraA, AraB, AraD, etc) originally for the metabolism of arabinose.[2]
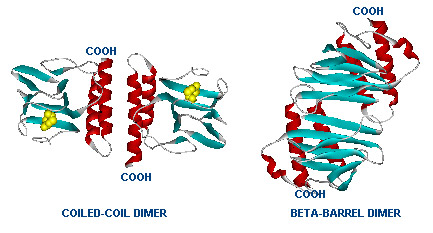 Dimer structure with arabinose on the left (yellow)  The left image shows the araC dimer repressing transcription, while the right conformation enables transcription
LacI
In nature, LacI represses pLac which promotes the LacYZA genes that metabolize lactose. Thus LacI represses pLac except in the presence of lactose (or lactose mimics, eg IPTG).  Image [1]. LacI forms a tetramer and represses pLac. However, an inducer, such as IPTG, causes a conformation change that removes LacI from the operator site.
TetR
TetR represses the constitutive promoter pTet. In the presence of tetracycline, an antibiotic, a conformational change in TetR inhibits the protein from binding to the operator region. In nature, pTet promotes TetR and TetA. The latter of which acts to pump tetracycline out of the cell, thus the pump is only activated in the presence of Tetracycline.[4]
The TetR, as it turns out is a very tight repressor and a range of 0 to 1 ug/ml has been shown to cause a 5 order of magnitude change in luciferase production.[5]
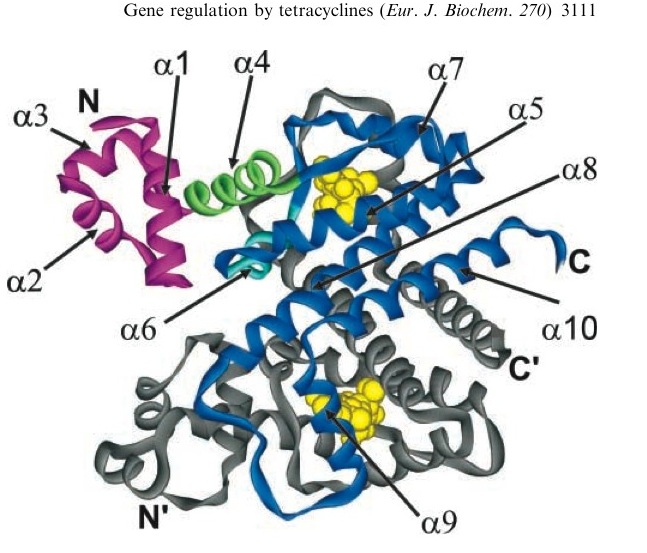 A tetracycline molecule binds to each of the two TetR monomers to form a dimer
Modeling
The first draft of the code started last year:
Initial Table of Constants
Derivation of Model Equations
Media:tristable2006.txt This code proved to complicated to work with and a more simplified version was developed.
A simpler model based on the bistable paper was developed that takes the combined, relative transcription/translation rates into account Media:tristable2007.txt.
Parameters in the Model
Repressor Production Rate
Repressor production rate is determined by two factors:
- Promoter Strength (Transcription)
- Ribosome Binding Strength (Translation)
In the model, the total repressor production rate = alpha
The promoter strength cannot be easily changed because this would require mutations in the promoter or a different promoter/repressor combo. However, RBSs have been well characterized and the alpha parameter can be modulated by inserting different strength RBSs as determined by the model and testing.
Repressor Strength
The strength of the repressors is determined by:
- The repressor concentration, [Repressor].
- The cooperativity of repression, Beta.
In the Model, the repressor strength = [Repressor]^Beta
The Beta value is characteristic of each repressor and represents a constant that cannot be changed.
Degradation
The degradation in the model is denoted by the term "-repressor," where the degradation constant is unity because the rates are relative, rather than absolute. The next iteration of the model will include degradation constants. Currently in the registry all of the repressors have strong degradation tags. Jason Kelly made a comment on one repressor and said he was suspicious of how strong of a repression would be able to be obtained from the repessors. We need strong repression for our system, so we may need to remove the tag our system to function.
The Model
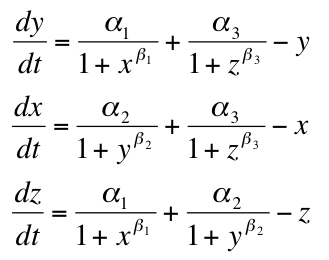
- Beta = Repression Strength
- Alpha = Repressor Production Rate
- X = Repressor1
- Y = Repressor2
- Z = Repressor3
Stability
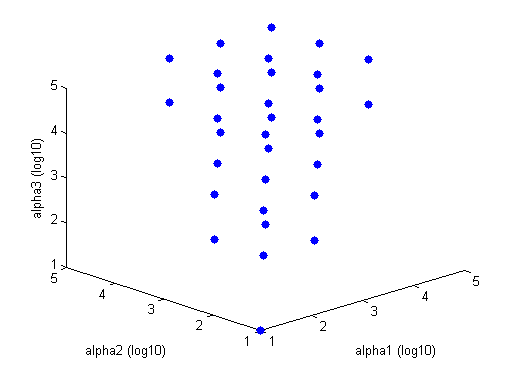 Tri-Stable region solved in Matlab Blue points are stable combinations of repressor production rates, while red circles are unstable combinations of repressor production rates. This graph is for Beta = 2. The tristable region gets larger (i.e. more disparate alpha values will be able to constitute a tristable system) as beta gets larger. The tristable region disappears when Beta equals one or less.
An easy visual aid to seeing how increased beta values (cooperativity of repression) leads to a more stable system consider the following graph of rate of production of repressor1 vs. the repressor that inhibits the production of repressor1. dx/dt vs. [y]
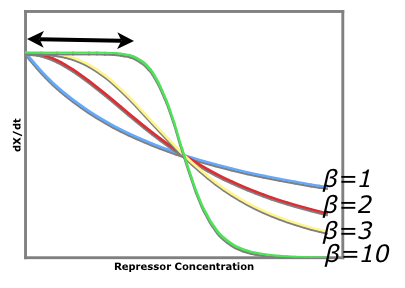
The black arrow shows that there is a larger region for larger beta values where stray repessors will not significantly affect the rate of repressor production rate whereas in a system of beta = 1, stray repressors will significantly change the system, making it less robust.
Testing Constructs
There are two methods we could follow in designing the Switch. We could randomly try different RBSs, hope it works and if not try again without having much of an understanding of why our cnostructs didn't work. Or we can test our repressors, promoters and inducers and have a systematic approach to anaylizing our system so that when something works or doesn't work we will know why. Thus we have designed a few tests which should give us relative and absolute values of our system that we can then plug into the model.
We decided to to test for three values. The combined transcription/translation rate of each repressor, the cooperativity of each repressor and the concentration of ligand needed to deactivate each repressor. We managed to design three tests all using the same constructs so as to minimize ligations. These tests should determine our variables independantly, i.e. changing synthesis rate should not change cooperativity of repression.
Synthesis Rate
The combined transcription/translation rate of the repressor is the combined strength of the promoter and the RBS. In 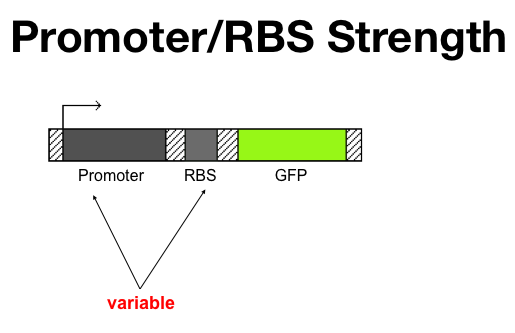 The Alpha test Architecture
Cooperativity of Repression
The cooperativity describes an inherent characteristic of a repressor's repression. In our system we want to know how 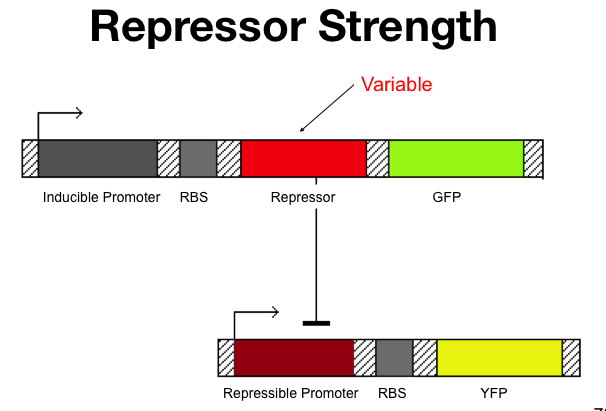 The Beta test Architecture
Ligand Concentration
Naturally, we don't want to add more ligand than we need. In what ever application the project might find, if we wanted to change the state again by adding a different 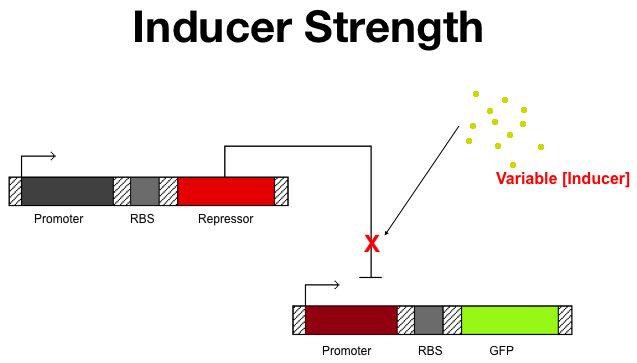 The Ligand test Architecture
Appendix
Schedule of Construction
We have a schedule of ligations and transformations that we keep on googledocs to easily access information about the dna and cells in our freezer and fridge. This also organizes what ligations we plan to do in the future. In all there are about 40 ligations we want to do to construct the test constructs and first tristable system and based on the results of the tests, we will need to do as many as 20 more ligations.
 Brown iGEM transformation database on googledocs  Brown iGEM ligation database on googledocs
Other Predicted Obstacles
- Other iGEM teams (info via Patrick King) have found that the araC gene contains a promoter region. Grown in TOP10 cells the construct araC>RBS>GFP>Terminator was observed to give a strong florescent output. In our system, this would give a florescent output for one FP even if that construct was not on.
- AraC exhibits all or none gene expression in the presents of arabinose because the natural transporter, when induced, causes that cell to transport arabinose, depleting the culture. This may be overcome by adding a saturating level of arabinose. In the arabinose construct already made, we were not able to observe FP output even though there was a high level of arabinose. We used XL1Blue cells.
- The degradation tags on the repressors may not give a long enough protein life time to yield strong repression. Thus, the tags may need to be removed to have a working device.
Email Correspondances about Tri-Stable Switch
Media:emailwithJasonLohmueller.txt
Media:emailwithNicolaNeretti.txt
Media:emailwithPatrickKing.txt
|


