|
The first level of our model simulates the growth of the bacterial population. We needed to model this growth before adding infection to our model.
Collecting Experimental Data
 Bacterial Growth measured by Plate Reader Generating the Calibration Curve
We grew two different strains of bacteria, C600 and LE392, in both LB and TNT media and generated OD600 vs Time, OD600 vs CFU/mL, and CFU/mL vs Time curves. In order to create a callibration curve to determine the number of cells per well, we used a plate reader to measure colony forming units per mL (CFU/mL), and then be graphed that against OD600.
Measuring Bacterial Growth
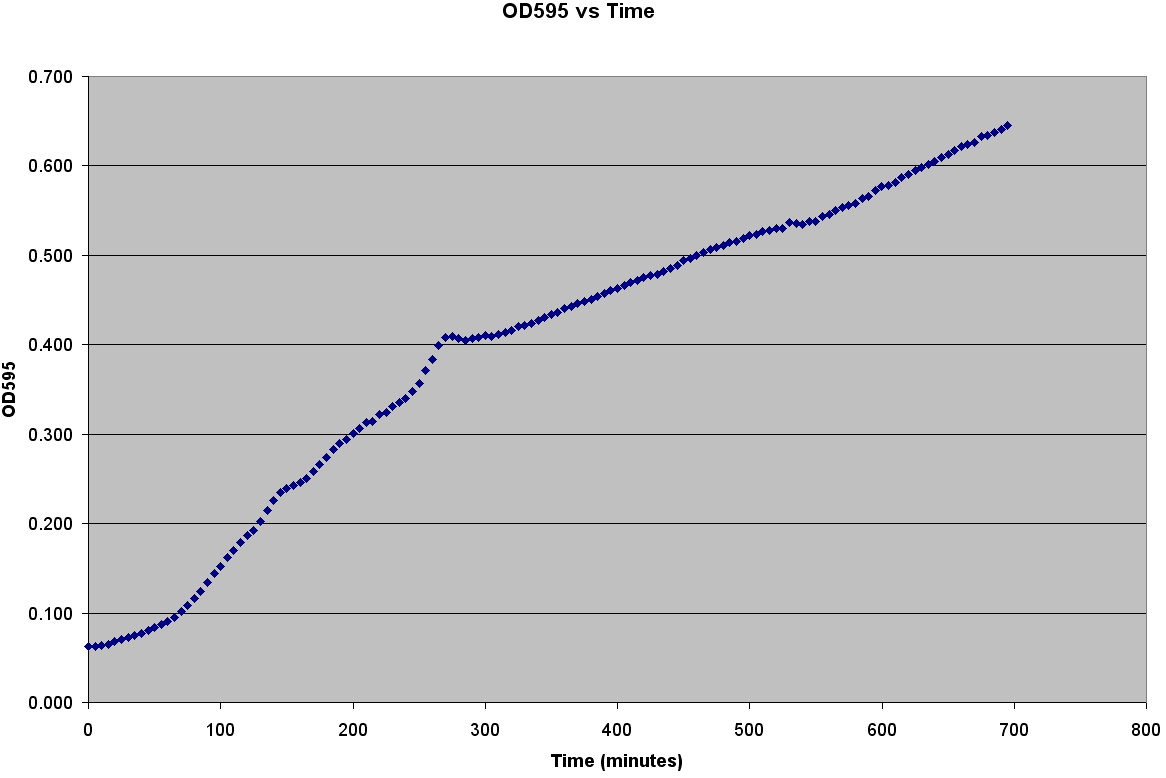
After producing the calibration curve, we decided to use a plate reader to measure growth of LE392 in a single well. The plate reader allows for temperature control, shaking, and can take many readings very quickly. Thus, we could follow the growth of LE392 in 96 wells without a considerable amount of work. The only problem was the small volume in each well made it easy for evaporation to occur. We compensated for this by adding sterilized MilliQ water part of the way through the experiment.
Simulating Bacterial Growth
Population growth curves tend to have a sigmoid growth trajectory. In order to create a sigmoid growth curve, we started with Michaelis Menten's model that describes enzyme kinetics with a limiting substrate. The Michaelis Menten reaction equation is:
Reading the equation from left to right, the enzyme E uses one substrate S and produces the intermediate ES. ES then creates a product P and releases the enzyme E. There are initial concentrations for E and S. The E continuously gets replenished by ES; however, the limiting substrate S gets used up. Once the concentration of S runs out, the product P stops being produced. Michaelis Menten’s equation can be modified to represent the doubling of bacteria with a limiting substrate to create a sigmoid growth curve:
Reading the equation from left to right, the bacterium consumes a limiting substrate such as food and produces the intermediate X. X produces two bacterial cells. The growth trajectory begins exponentially but flattens out once the food substrate is depleted. When this model is simulated, the sum of the intermediate X and the bacteria give a sigmoid curve. In order to use this growth curve to match experimental data, three rate constants, k1, k-1, and k2 must be picked. It is difficult to do this since the rate constants do not directly control the characteristics of the curve such as slope and peak. All three values are interdependent and the correct ratios must be picked between these constants to produce a usable sigmoid curve. In order to control the characteristics of the curve, it must be converted to differential equations using Monad’s model for bacterial growth. Monad identified the similarities between bacterial growth and Michaelis Menten’s enzyme kinetics. Monad’s equation states
In terms of B(bacteria), X(intermediate), and S(substrate), the Monad equation can be written as
The rate k2 controls exponential growth and the rate km controls the peak of the curve. Once the km rate and k2 rate are chosen, k1 and k-1 can be evaluated using this relationship:
The trajectories become roughly linear after about 220 minutes into the growth. This linear growth might be a result of evaporation in the liquid media. Since the bacteria requires a temperature of 37 degrees Celsius to grow, evaporation might be distorting the optical density measurements. Ideally, the growth should be sigmoid in shape.
Derivations
Monad’s equation can be directly derived from the reaction equation:
The derivation for Monad’s equation is:
At steady state:
This equation models the growth of bacteria; however, a second differential equation is needed to show the decline of the food substrate as the bacteria consumes it. The substrate S stays constant so there is unlimited food. dS/dt (the change of the food substrate) must be derived to create a sigmoid curve:
The dS/dt equation in addition to the dB/dt equation shows the interaction between the substrate and the bacteria with differential equations. By changing the values of k2, which controls the exponential growth, and km, which controls the peak of the curve, the experimental data can be simulated with differential equations and reaction equations.
| 


