File:ETHZSensitivity.png
From 2007.igem.org
Size of this preview: 799 × 599 pixels
Full resolution (1,201 × 901 pixels, file size: 39 KB, MIME type: image/png)
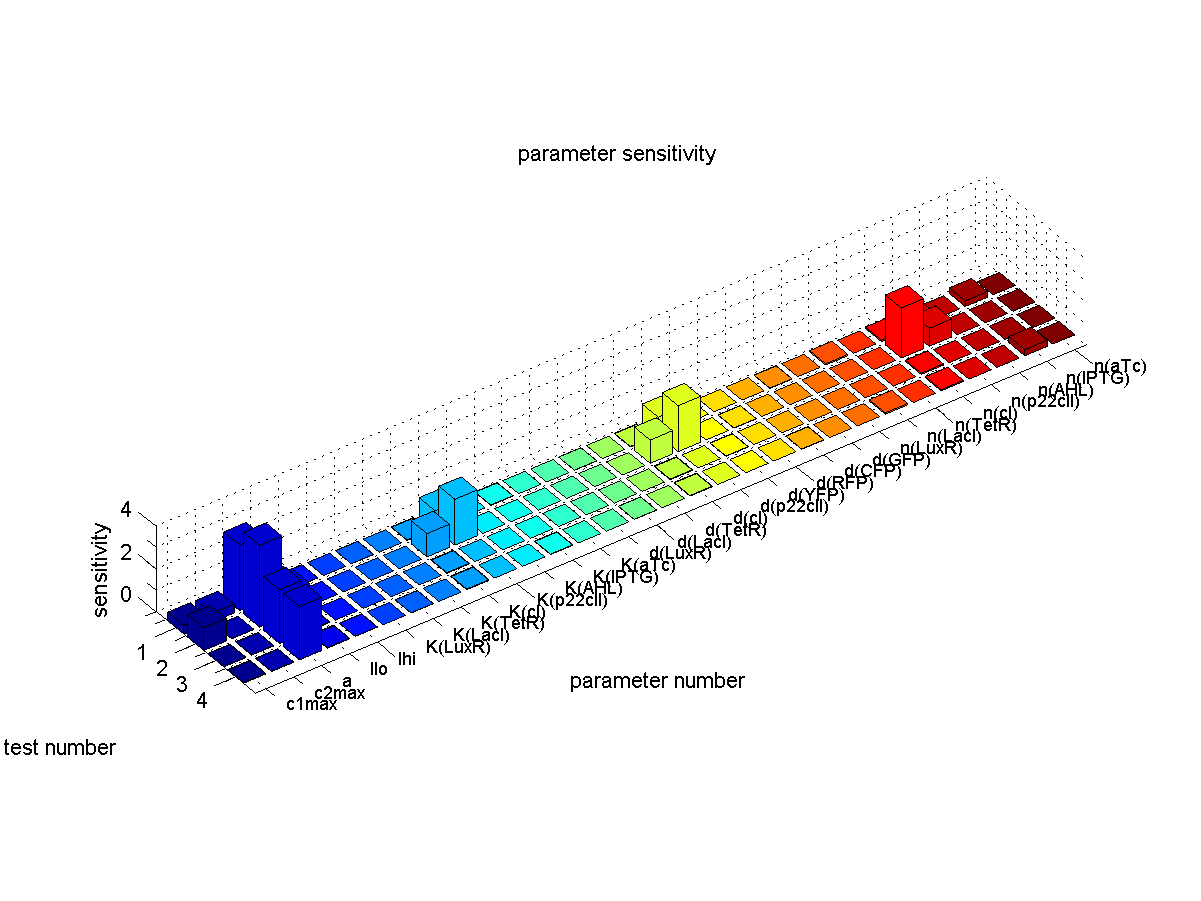
Fig. 6: Sensitivity analysis. We plot the sensitivity for each parameter and each test case that corresponds to the different path ways in Fig. 1.
File history
Click on a date/time to view the file as it appeared at that time.
| Date/Time | Thumbnail | Dimensions | User | Comment | |
|---|---|---|---|---|---|
| current | 15:44, 12 October 2007 | | 1,201×901 (39 KB) | Rico (Talk | contribs) | (Sensitivity analysis for parameter values.) |
File links
The following page links to this file: