Growth curve
From 2007.igem.org
Guido Costa (Talk | contribs) |
Guido Costa (Talk | contribs) |
||
| Line 3: | Line 3: | ||
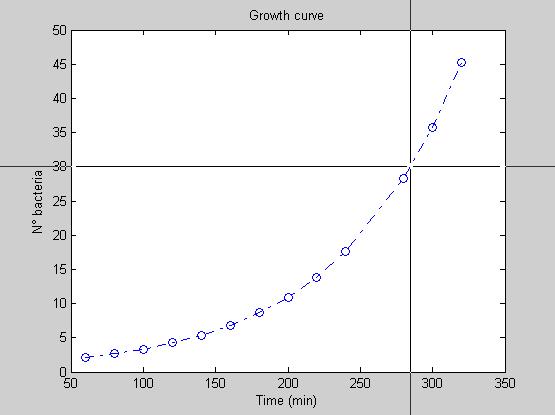
These values are useful to plot the growth curve (as seen in the figure below), under the hypothesis that it is an exponential one. By clicking on a population level and on its double, the program returns the splitting time of our bacteria, which turns out to be between 55 and 60 minutes. | These values are useful to plot the growth curve (as seen in the figure below), under the hypothesis that it is an exponential one. By clicking on a population level and on its double, the program returns the splitting time of our bacteria, which turns out to be between 55 and 60 minutes. | ||
| - | [[Image: | + | [[Image:curva2.jpg]] |
Revision as of 14:02, 4 September 2007
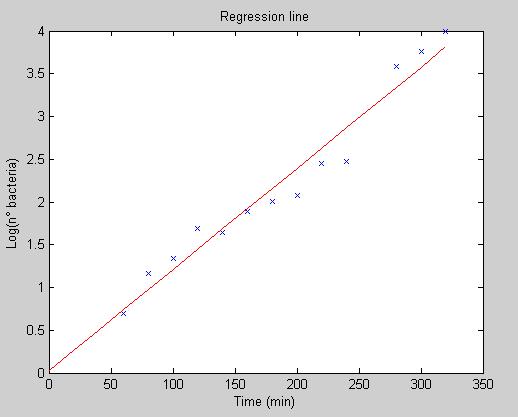
At t=0 we inoculate a colony of bacteria in 5 ml of culture ground and every 20 minutes, with the microscope, we take a picture of five different fields of view inside a 3 ul drop. With our segmentation algorithm, we are able to count the number of bacteria in every picture; every blue star in the graph below represents the average of the five values we found from the five different fields of view at a fixed instant. Then, we calculate the regression line (in red), from which we extract slope and offset.

These values are useful to plot the growth curve (as seen in the figure below), under the hypothesis that it is an exponential one. By clicking on a population level and on its double, the program returns the splitting time of our bacteria, which turns out to be between 55 and 60 minutes.
