ETHZ/Simulation
From 2007.igem.org
(→Sensitivity Analysis) |
(→Sensitivity Analysis) |
||
| Line 38: | Line 38: | ||
== Sensitivity Analysis == | == Sensitivity Analysis == | ||
| - | We were not only interested in finding a set of parameters for which | + | We were not only interested in finding a set of parameters for which our system is working. To provide a stable performance also in the presence of noise and parameter missmatch we were interested in analysing the sensitivity of the system to find the most sensitive parameters. |
| + | There for we simulated the timing behavior with both once increasing and decreasing each parameter by 5%. | ||
| + | <math>I/I</math> | ||
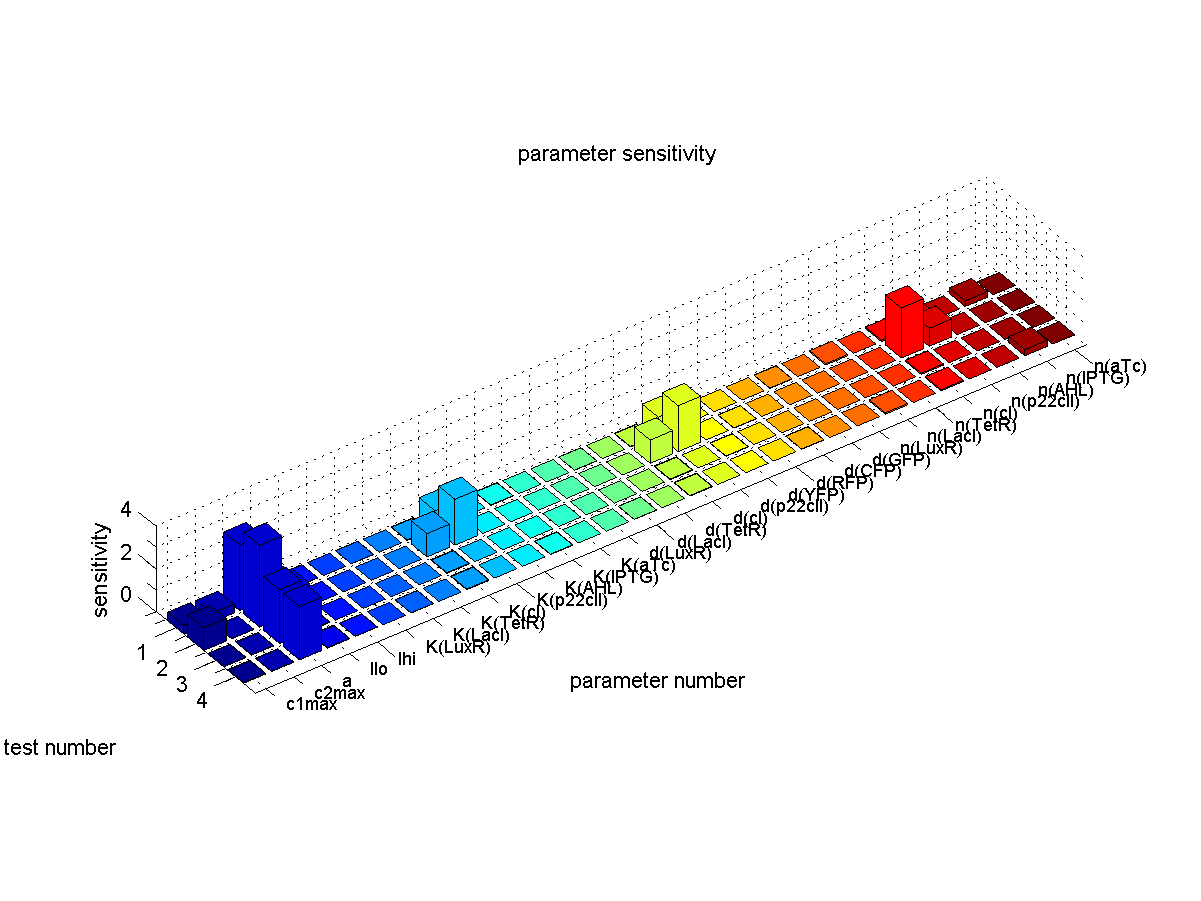
The results are plotted in Figure 5. | The results are plotted in Figure 5. | ||
[[Image:ETHZSensitivity.png|center|thumb|Fig. 5: Sensitivity analysis |720px]] | [[Image:ETHZSensitivity.png|center|thumb|Fig. 5: Sensitivity analysis |720px]] | ||
| + | |||
| + | We found the following results | ||
| + | * Our system is most sensitve to the parameter a which descibes the base production. This is not a suprising result since we depend on having a good switch and our signal to noise or with other words output to baseline production level highly depends on the fact that we can reliably switch off the production of the memory proteins cI and p22cII. For a more detailed analysis of the switching behavior please see ADD LINK TO ANALYSIS!!! | ||
| + | * Other sensitive parameters are those that are directly related to the production and decay of the memory proteins cI and p22cII. We can especially see that those parameters seem to be more sensitive for the test cases 1 and 2 where | ||
Revision as of 12:02, 15 October 2007
Contents |
Protocol
Simulation of Test Cases
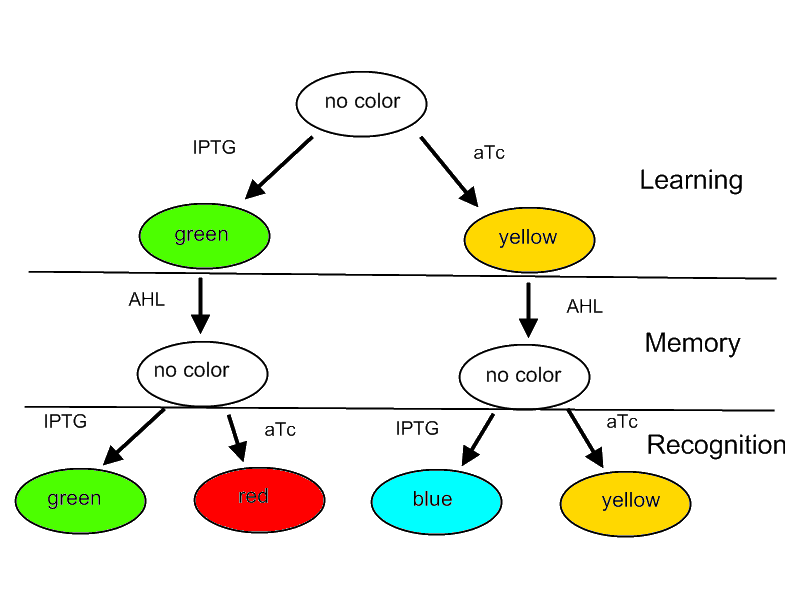
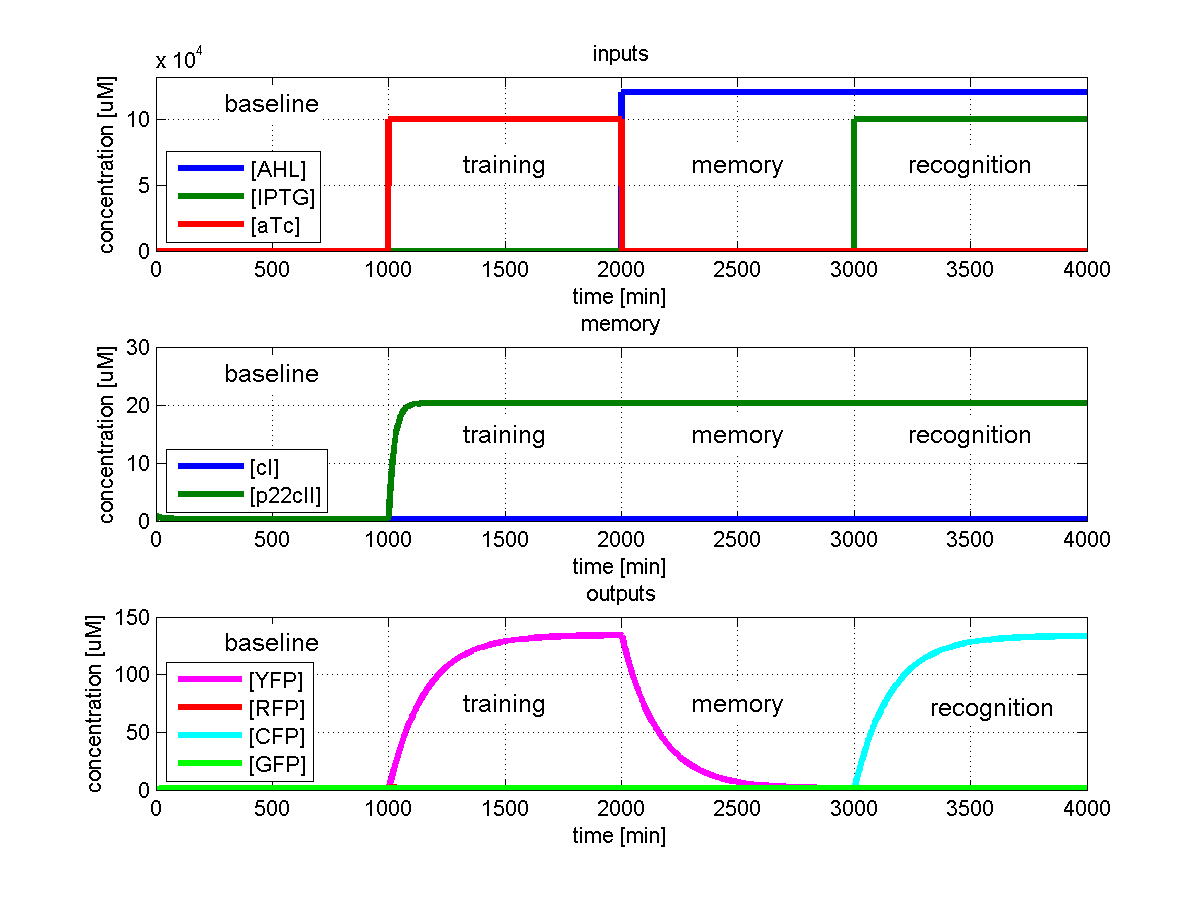
To test for all conditions we run timing simulations for all 4 different branches in the flow diagram of our protocol and plotted the concentrations of the inducers, memory proteins and reporter proteins.
- During the first 1000 minutes of the simulation we did not add any inducers to the system to check for the baseline production of proteins.
- Between 1000 and 2000 minutes we added the inducer that should be learned and let the system reach steady state.
- After the 2000th minute we added the inducer AHL for memory formation and run the simulation for additional 1000 minutes to reach again steady state.
- Between 3000 and 4000 minutes we finally tested if the system reacts in the desired way by showing the right color.
For the simulation parameters that have been used please see ADD LINK TO PARAMETER TABLE
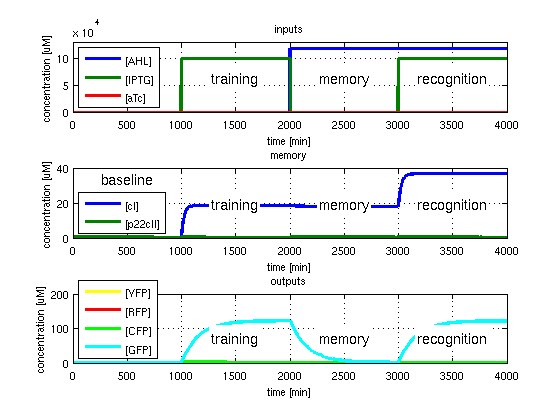
Test 1: Learn and recognize IPTG
Figure 1 shows the simulated behavior of the system when IPTG is presented both during the learing phase and the recognition phase. In both the learning and recognition phase the system reports by producing green florescence proteins which matches the desired behavior.
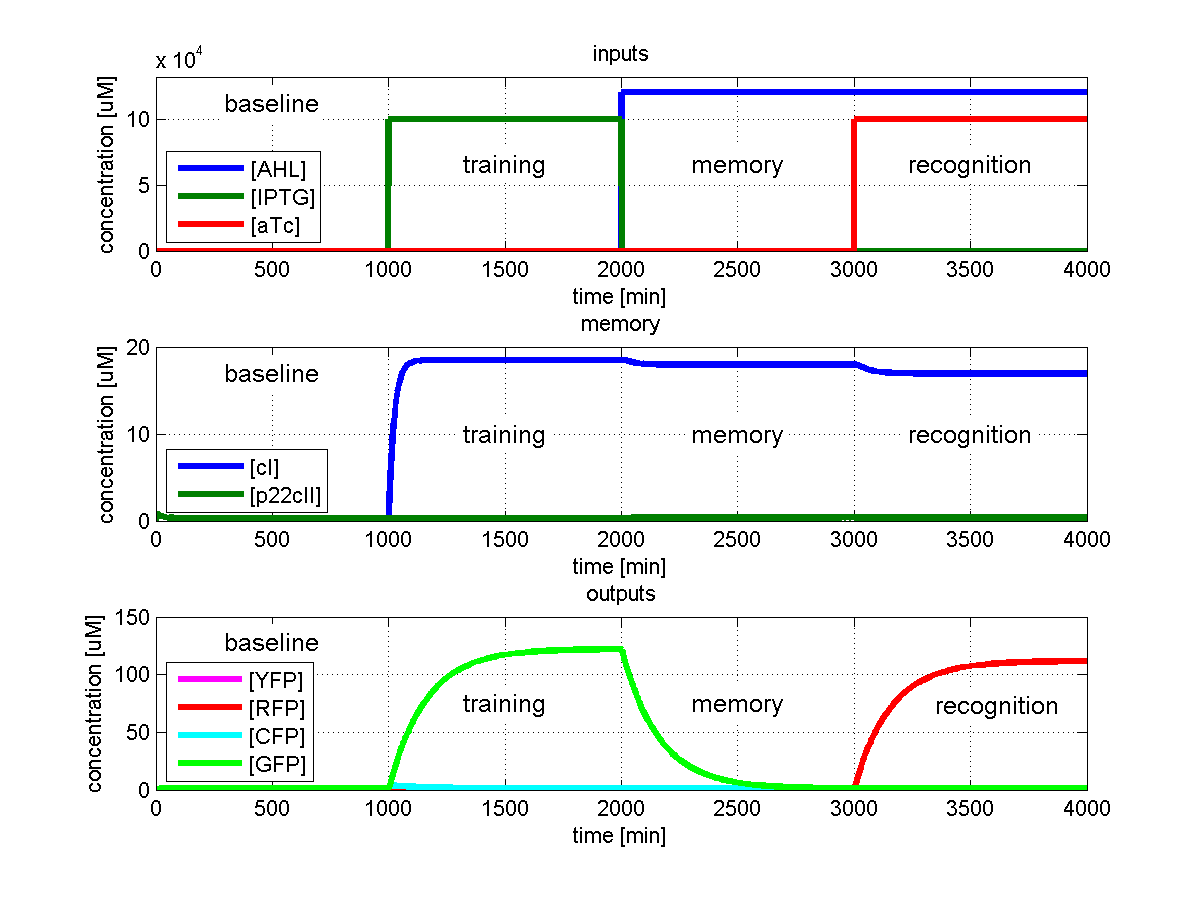
Test 2: Learn IPTG and get tested for aTc
Figure 2 shows the simulated behavior of the system when IPTG is presented only during the learing phase but aTc during the recognition phase. In contrast to Figure 1 the system reports by producing red florescence proteins during the recognition phase which matches the desired behavior.
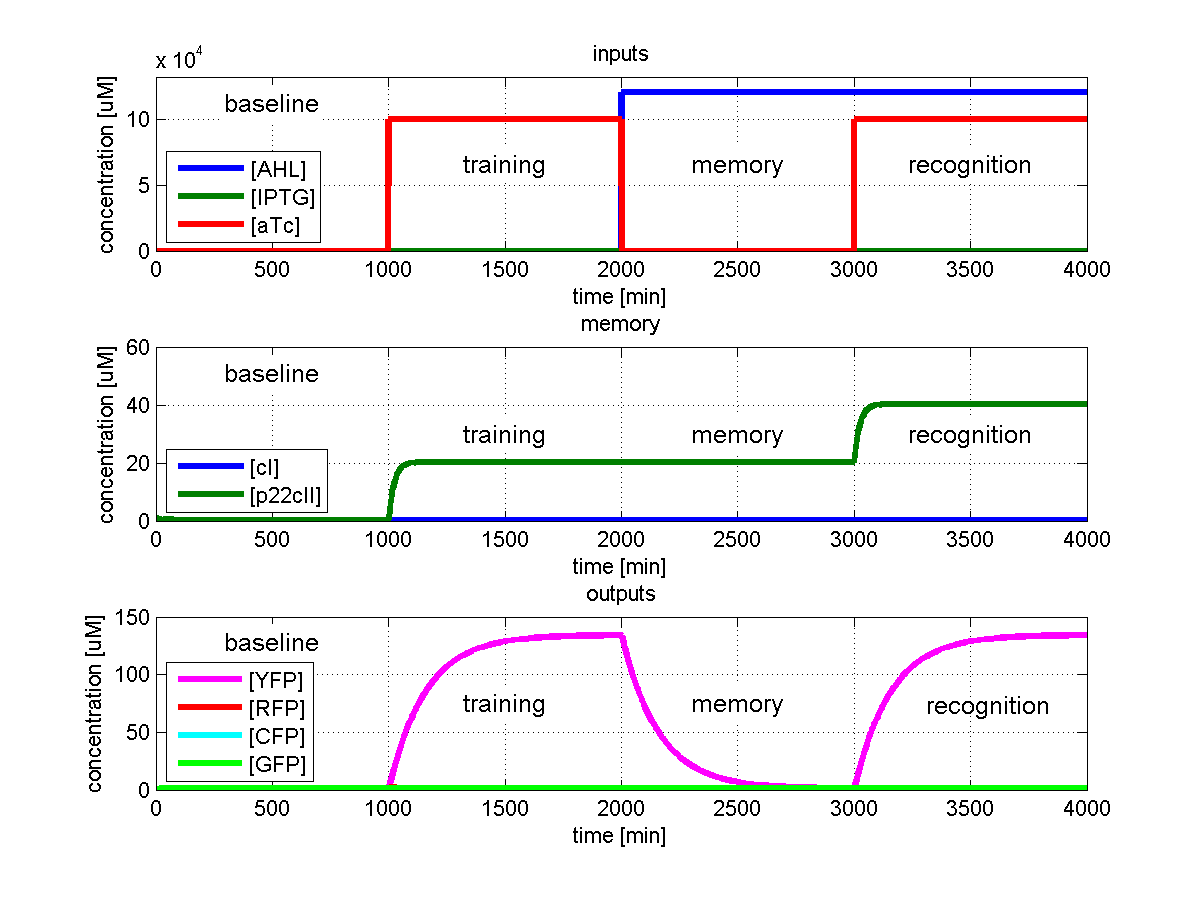
Test 3: Learn and recognize aTc
Figure 3 shows the simulated behavior of the system when aTc is presented both during the learing phase and the recognition phase. In both the learning and recognition phase the system reports by producing yellow florescence proteins which matches the desired behavior.
Test 4: Learn aTc and get tested for IPTG
Figure 4 shows the simulated behavior of the system when aTc is presented only during the learing phase but IPTG during the recognition phase. In contrast to Figure 3 the system reports by producing cyan florescence proteins during the recognition phase which matches the desired behavior.
Sensitivity Analysis
We were not only interested in finding a set of parameters for which our system is working. To provide a stable performance also in the presence of noise and parameter missmatch we were interested in analysing the sensitivity of the system to find the most sensitive parameters.
There for we simulated the timing behavior with both once increasing and decreasing each parameter by 5%. <math>I/I</math> The results are plotted in Figure 5.
We found the following results
- Our system is most sensitve to the parameter a which descibes the base production. This is not a suprising result since we depend on having a good switch and our signal to noise or with other words output to baseline production level highly depends on the fact that we can reliably switch off the production of the memory proteins cI and p22cII. For a more detailed analysis of the switching behavior please see ADD LINK TO ANALYSIS!!!
- Other sensitive parameters are those that are directly related to the production and decay of the memory proteins cI and p22cII. We can especially see that those parameters seem to be more sensitive for the test cases 1 and 2 where
