Davidson Missouri W/WesternMeetingNotes
From 2007.igem.org
(→Western Notes) |
|||
| Line 21: | Line 21: | ||
'''6/13 One Time Flipable Investigation''' | '''6/13 One Time Flipable Investigation''' | ||
| + | |||
| + | When dealing with the concept of one-time flipable hix sites, Poet and Michelle have looked sequences with 4 hix sites (3 pancakes) and have considered 3 assumptions. The assumptions are: | ||
| + | 1. Only 1 flip occurs. | ||
| + | 2. Up to 2 flips occur. | ||
| + | 3. Exactly 2 flips occur. | ||
| + | |||
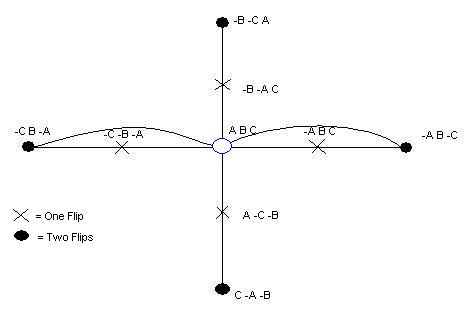
| + | The following image represents each of these assumptions. The inner crosses represent the possibility that only 1 flip occurs. The outer black circles represent the possibility that exactly 2 flips occur. The full graph represents the final assumption that up to 2 flips occur. | ||
[[Image:onetimeflipable.JPG|thumb|600px|center| ]] | [[Image:onetimeflipable.JPG|thumb|600px|center| ]] | ||
<br> | <br> | ||
Revision as of 16:57, 13 June 2007
Western Notes
6/04 Original Adelman Graph
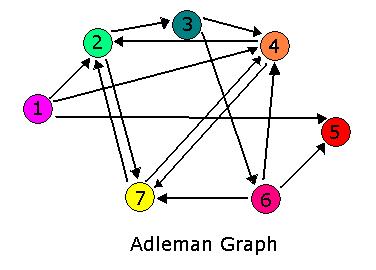
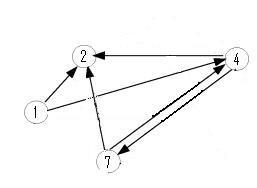
The Adelman Graph with its seven vertices and fourteen arcs is too large to attack with our approach without first testing our procedures. To this end, Michelle and Jeff have been investigating induced subgraphs of the Adelman Graph. Ideally, we would like to partition the Adelman Graph into smaller graphs that could be constructed and tested individually, then linked together to form one large construct representing the Adelman Graph. It seems the most critical property of a good test graph is a unique Hamiltonian path. The smallest graph with a unique Hamiltonian path would be two vertices connected with a single edge. This is the one pancake problem worked on (and successfully achieved!) by the Davidson-Missouri Western team in 2006. The first non-trival (from a mathematical standpoint) graph would be a transitive directed graph on three vertices. The concept of transitivity is pervasive in many areas of mathematics. In the real numbers, the relation > is transitive. That is, if a>b and b>c, then we know that a>c. One example of a transitive induced graph of the Adelman graph is the subgraph on the vertices 1, 4, and 2. Notice that the edges of the Adelman Graph between these three vertices are precisely 14, 42, and 12. This construct, and others like it, have a unique Hamiltonian path AND have the property that there are no false positive results. This may provide a setting in which to test some of our proposed procedures.
6/11 Adelman Subgraph
Moving up a level, the graph below is nearly an induced subgraph of the Adelman Graph. (To be induced, it would require the arc 27 also be included, but to include this edge would destroy the property of having a unique Hamiltonian path.) This graph on four vertices with six edges provides a small example in which we can test our ability to biologically distinguish between true positives and false positives. There are 48 true positives for this graph (14, 47, 72 followed by the other three arcs in any order and any orientation). There are 42 false positives (14, 47, 74 followed by the other three arcs in any order but with at least one in forward orientation).
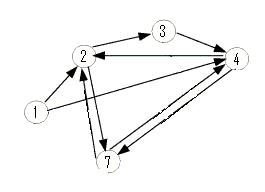
The graph below is an induced subgraph of the Adelman Graph on five vertices with nine arcs. This graph has a unique Hamiltonian path AND contains the graph above. This might serve as a good intermediate on our way to the complete construction. Note also that this graph contains three transitive subgraphs (7,4,2), (4,7,2) and (1,4,2). Before jumping into constructions, we should carefully consider which coding sequence will correspond to each vertex of the Adelman Graph. If we are clever, it may be possible to piece together several smaller test constructs to efficiently create the full graph. Note: The counting of true positives and false positives for the graph below is non-trivial and in progress.
6/13 One Time Flipable Investigation
When dealing with the concept of one-time flipable hix sites, Poet and Michelle have looked sequences with 4 hix sites (3 pancakes) and have considered 3 assumptions. The assumptions are: 1. Only 1 flip occurs. 2. Up to 2 flips occur. 3. Exactly 2 flips occur.
The following image represents each of these assumptions. The inner crosses represent the possibility that only 1 flip occurs. The outer black circles represent the possibility that exactly 2 flips occur. The full graph represents the final assumption that up to 2 flips occur.


