Tianjin/DIODE/Model3
From 2007.igem.org
Lovecarrot (Talk | contribs) |
Lovecarrot (Talk | contribs) |
||
| Line 6: | Line 6: | ||
[[Image:TJUI.jpg|300px]] [[Image:TJUIJ.jpg|300px]][[Image:TJUIJP.jpg|300px]] | [[Image:TJUI.jpg|300px]] [[Image:TJUIJ.jpg|300px]][[Image:TJUIJP.jpg|300px]] | ||
| + | |||
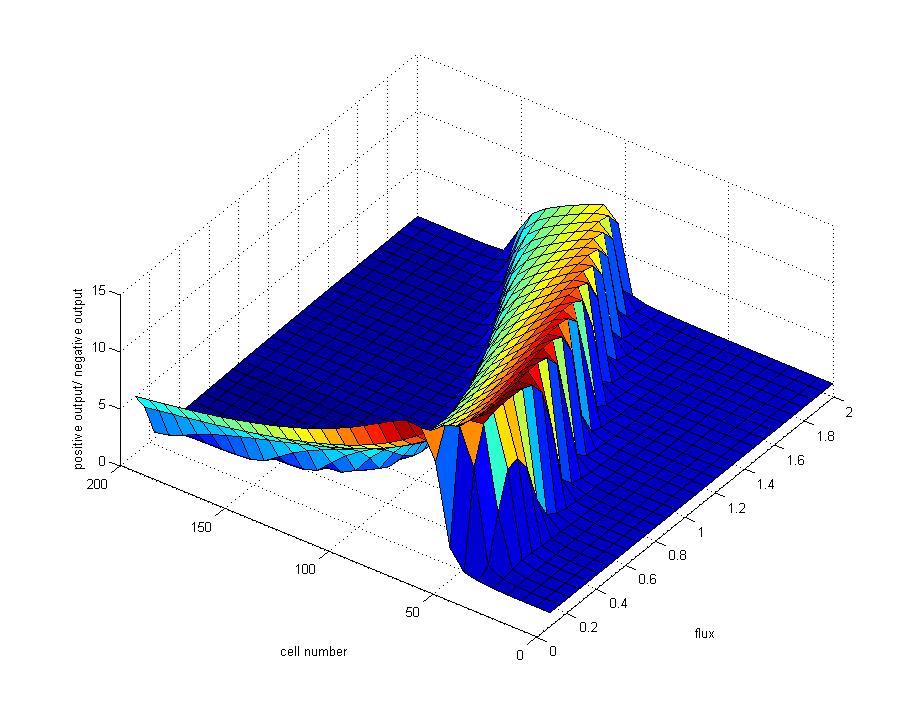
| + | Figure 3: In order to keep the biodiode work stably and avoid the appearance of break-down, both the flux rate and density of generater cells should be considered seriously. The ratio of positive output to negative input is employed to represent the quality of a biodiode. Since a ideal diodiode should have a maximum positive output and a minimum negative input, the ridge of the graph figure out the optimum condition for the work of biodiode.<br> | ||
| + | [[Image:TJUzf.jpg|300px]] | ||
Revision as of 16:48, 24 October 2007
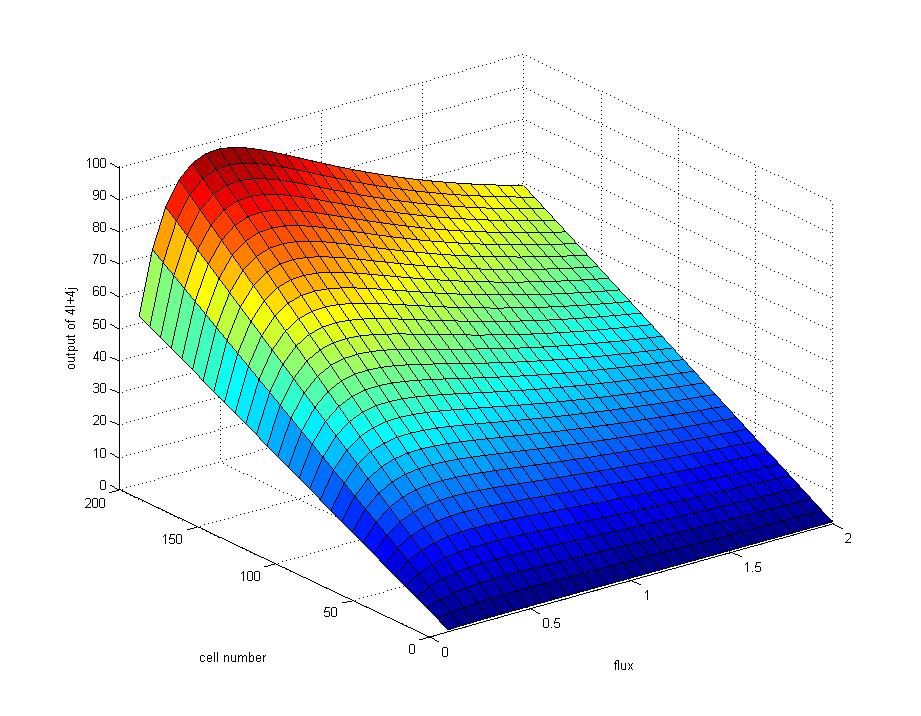
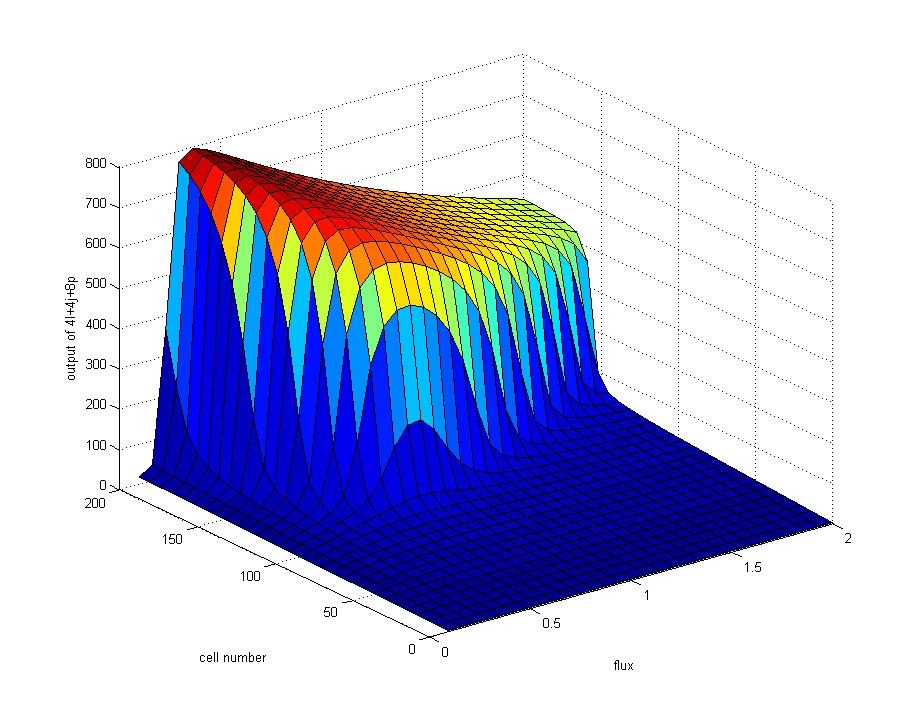
Figure 1: The positive-biased condition of biodiode. Cell number in all three picture refer to the cell density of generator cells (4L). The middle graph indicates the concentration of AHL rises quickly to a high level after the amplifier cells are activated by the enviromental AHL signal (input signal). The biodiode could reach to the condition of positive-biased under a high cell density of 4L or a slow flux rate.(right graph)
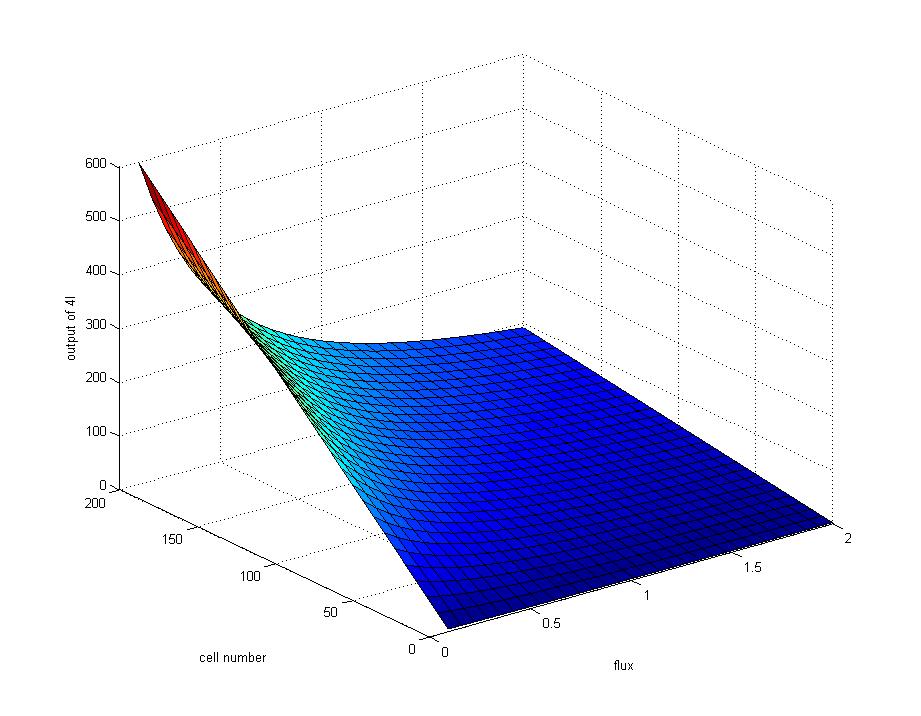
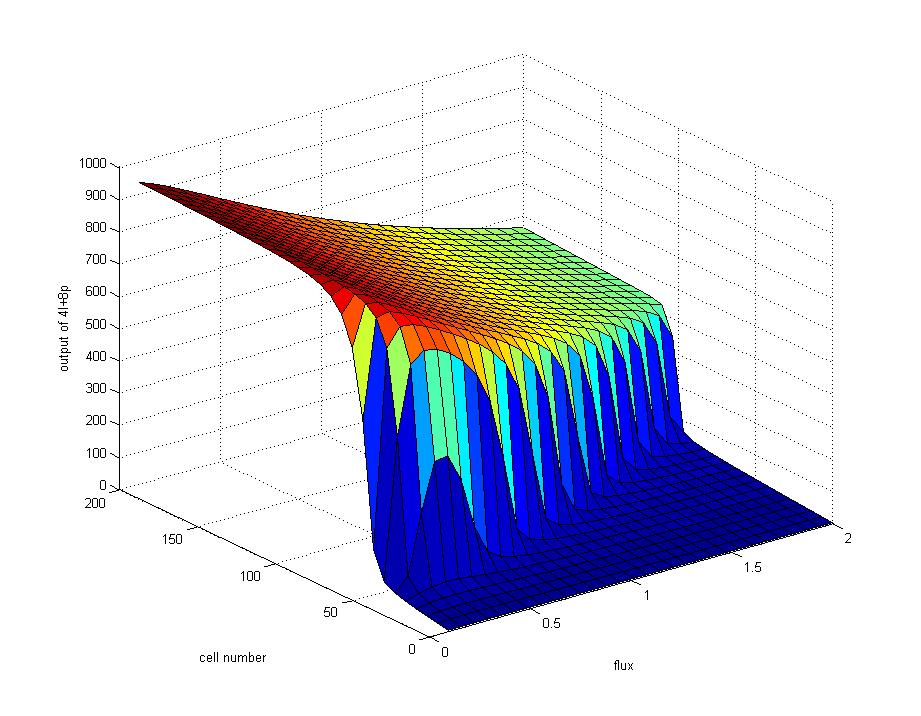
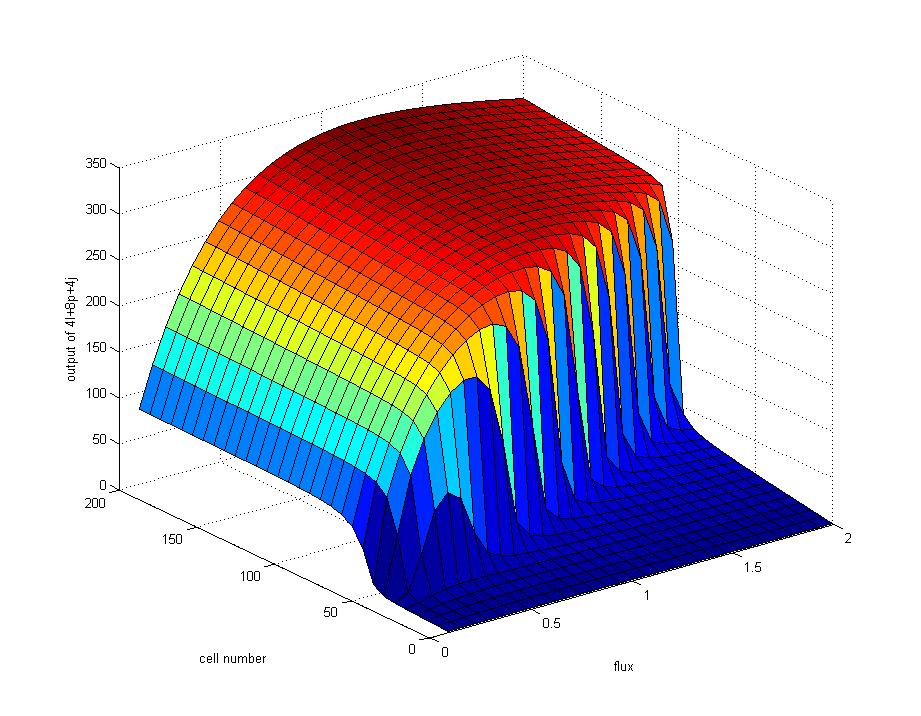
Figure 2: The negative-biased condition of biodiode.
Figure 3: In order to keep the biodiode work stably and avoid the appearance of break-down, both the flux rate and density of generater cells should be considered seriously. The ratio of positive output to negative input is employed to represent the quality of a biodiode. Since a ideal diodiode should have a maximum positive output and a minimum negative input, the ridge of the graph figure out the optimum condition for the work of biodiode.
