Tianjin/DIODE/Model1
From 2007.igem.org
Lovecarrot (Talk | contribs) |
Lovecarrot (Talk | contribs) |
||
| (One intermediate revision not shown) | |||
| Line 1: | Line 1: | ||
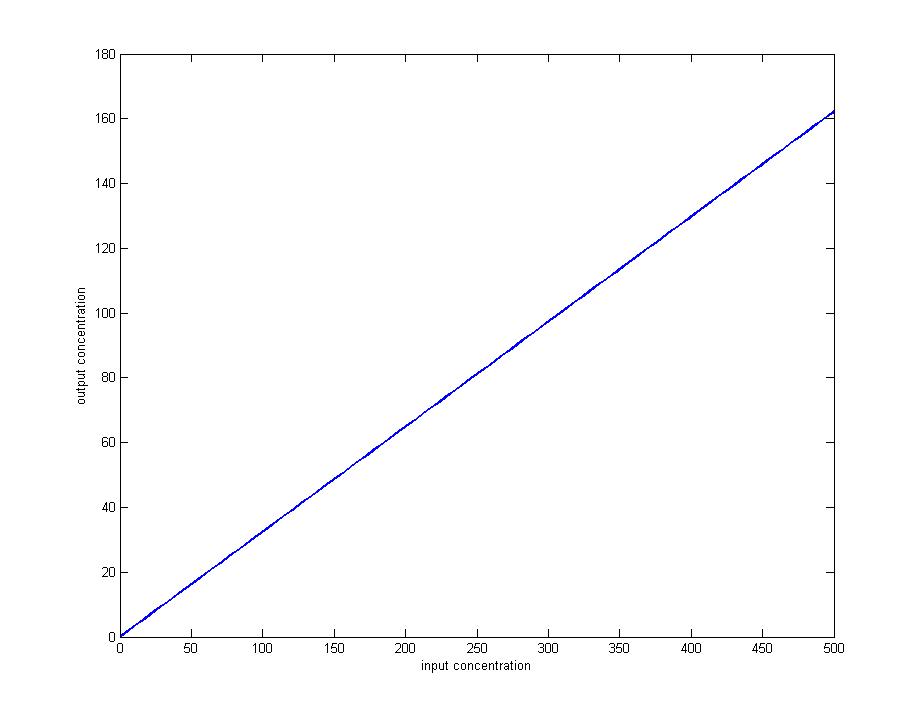
| - | Figure 1: the | + | Figure 1: The output concentration of AHL increases linearly to the input concentration of AHL. The digesting capacity of certain amounts of block cells is considered as constant. So in order to discard the influence of input concentration of AHL on the function of block cells, we use the ratio of output concentration to input concentration to measure the degrading capacity of block cells as the figure 2 shows.<br> |
| - | [[Image: | + | [[Image:TJU4j.jpg|500px]]<br> |
| + | |||
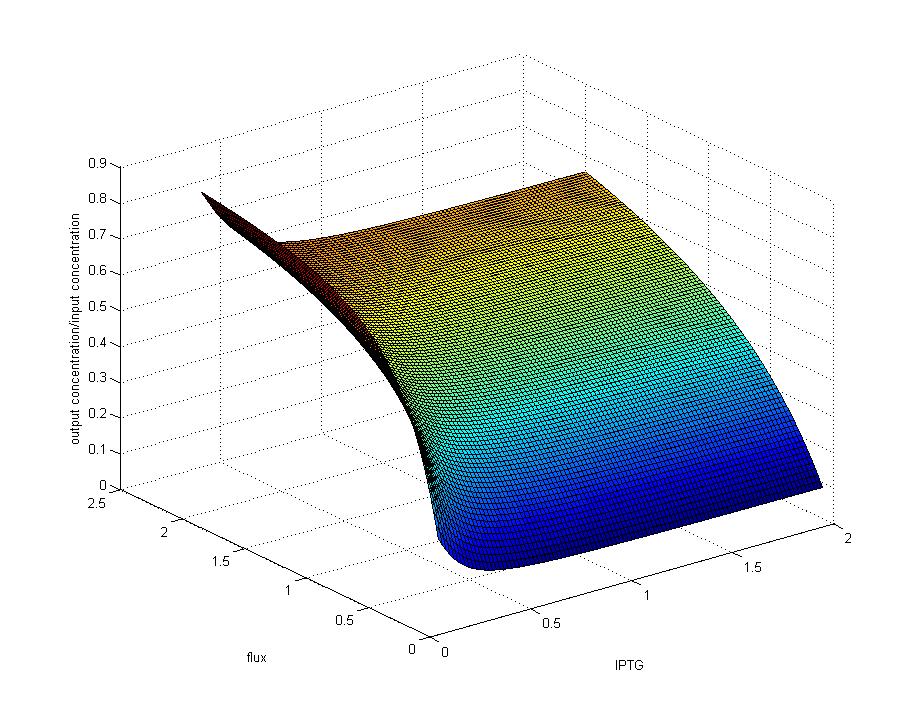
| + | Figure 2: With the addition of IPTG, expression of aiiA gene dramatically raised resulting in the decrease of AHL concentration. As the flux speed climb up, the output concentration appears to increase since the capacity of block cells per unit time is fixed.<br> | ||
| + | [[Image:TJU4j2.jpg|500px]]<br> | ||
Latest revision as of 15:02, 26 October 2007
Figure 1: The output concentration of AHL increases linearly to the input concentration of AHL. The digesting capacity of certain amounts of block cells is considered as constant. So in order to discard the influence of input concentration of AHL on the function of block cells, we use the ratio of output concentration to input concentration to measure the degrading capacity of block cells as the figure 2 shows.

Figure 2: With the addition of IPTG, expression of aiiA gene dramatically raised resulting in the decrease of AHL concentration. As the flux speed climb up, the output concentration appears to increase since the capacity of block cells per unit time is fixed.
