June 20
From 2007.igem.org
(Difference between revisions)
(→Analysis) |
(→Analysis) |
||
| Line 24: | Line 24: | ||
Linear and log space | Linear and log space | ||
| - | gallery | + | '''Mean and Standard Error Plots at all induction levels''' |
| + | <gallery> | ||
| + | Image:CFPlin.jpg|A linear plot of mean CFP Fluorescence values at | ||
| + | Image:YFPlin.jpg | ||
| + | Image:RFPlin.jpg | ||
| + | |||
| + | Image:CFPlog.jpg | ||
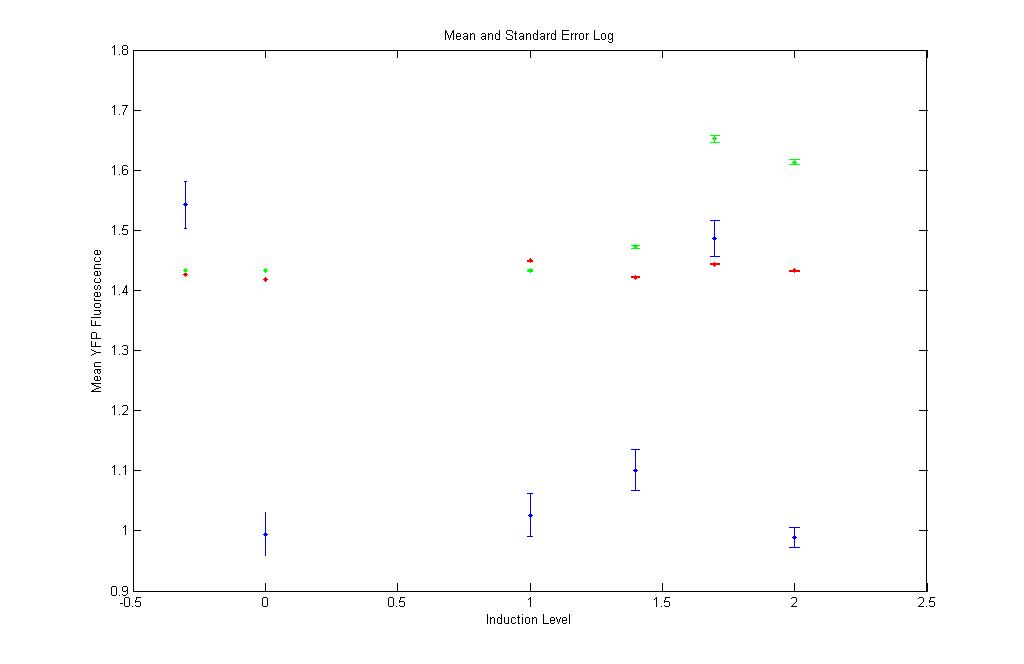
| + | Image:YFPlog.jpg | ||
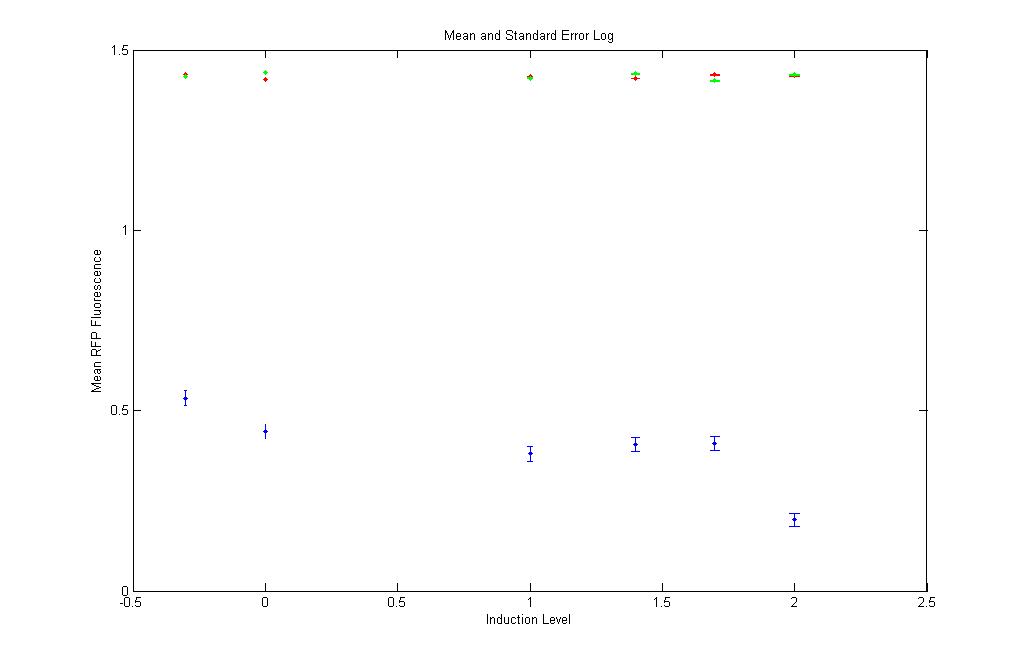
| + | Image:RFPlog.jpg | ||
| + | </gallery> | ||
Revision as of 05:07, 25 June 2007
Experiments
Microscopy:
- pT luxI Cfp imaging done at various induction levels but OD was too high
- K12Z1 imaging done at various induction levels
- 1st Open loop trial Experiment DONE (Auto fluorescence, pT.luxI.C (at AI OD 2 and 0.2))
FACS:
- Auto fluorescence at inductions [0,1,10,25,50,100] done in triplets
- pT.luxI.C fluorescence at inductions [0,1,10,25,50,100] done in triplets
- Fluorescence due to M9 solution (Control)
Analysis
Microscopy:
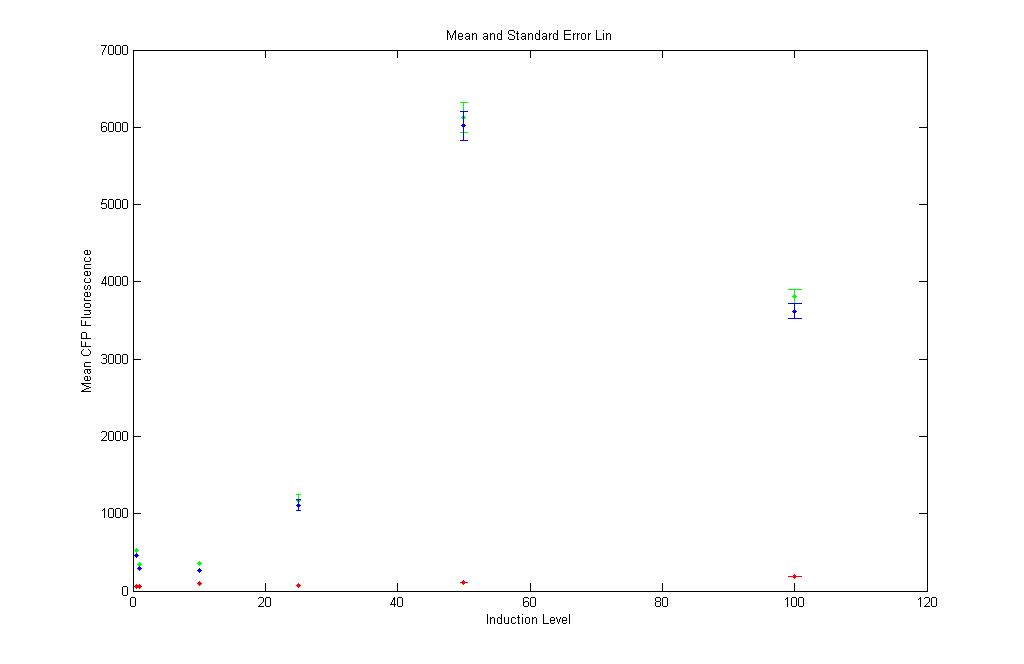
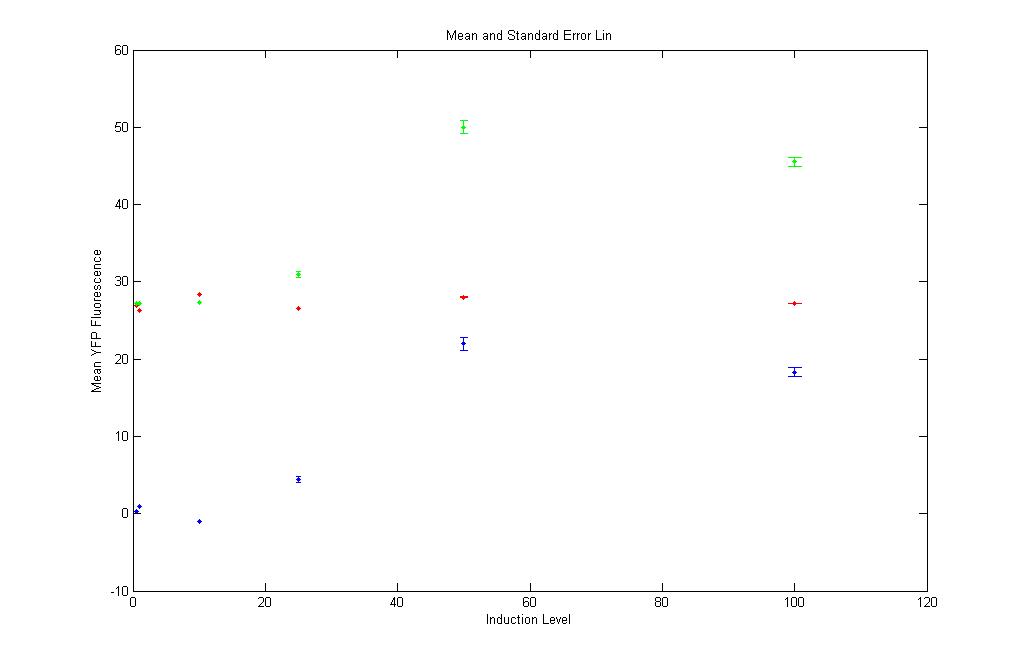
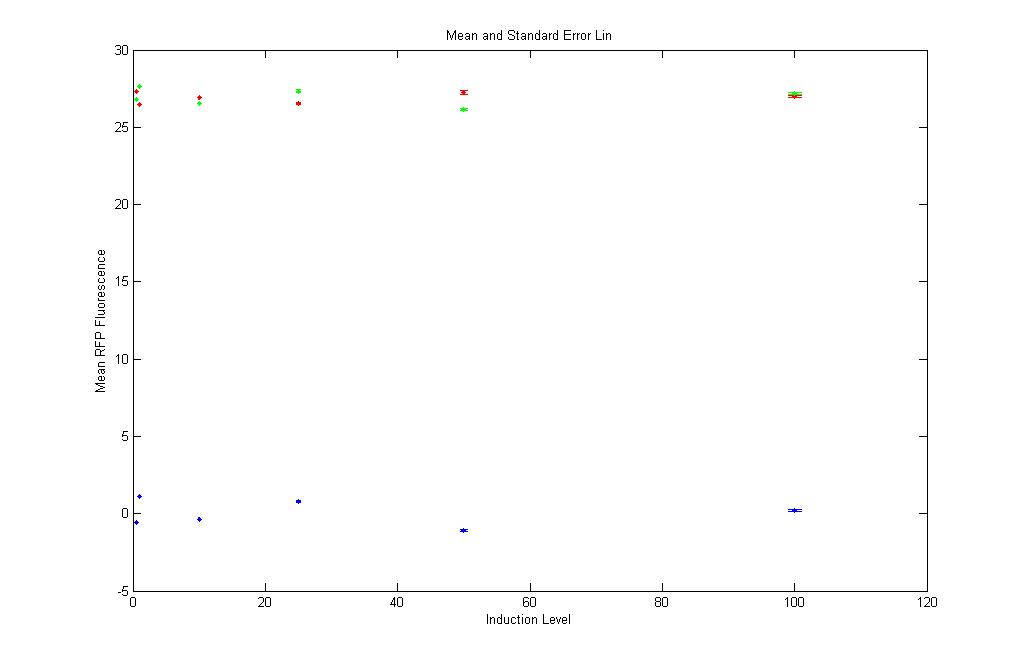
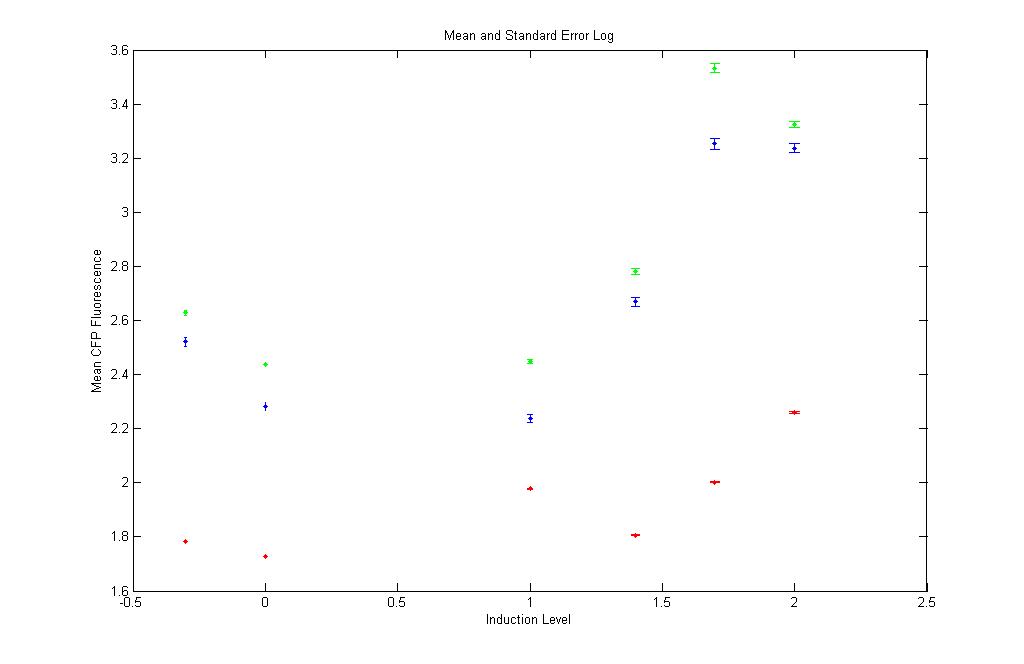
pT LuxI.C: Subtract K12Z1 and plot CFP,YFP,RFP vs aTC concn
Red : K12Z1 Fluorescence values at different aTc induction levels
Green : pT.luxI.C Fluorescence values at different aTc induction levels
Blue : pT.luxI.C - K12Z1 Fluorescence values at different aTc induction levels
Linear and log space
Mean and Standard Error Plots at all induction levels
