Tianjin/DIODE/Model
From 2007.igem.org
Lovecarrot (Talk | contribs) |
|||
| (3 intermediate revisions not shown) | |||
| Line 1: | Line 1: | ||
| + | Figure 1: The concentration of AHL could be accelerated both by the addition of IPTG and proliferation of living cells. | ||
| + | [[Image:TJU4L1.jpg|500px]]<br> | ||
| + | Figure 2: The concentration of AHL decreases nearly proportionally to the flow of liquid culture since the rate of AHL production maintains stable. | ||
| + | |||
| + | [[Image:TJU4L2.jpg|500px]]<br> | ||
| + | Figure 3: Concentration of AHL increases exponentially during the first 40 minutes after the input of liquid culture, but keeps constant from then on. | ||
| + | |||
| + | [[Image:TJU4L.jpg|500px]]<br> | ||
| + | Figure 4: Rough description of relationship between the input of AHL signal and the output of AHL signal when the flux passes through the amplifier cells. Low concentration input failed to initiate the amplication process. | ||
| + | |||
| + | [[Image:TJU8P1.jpg|500px]]<br> | ||
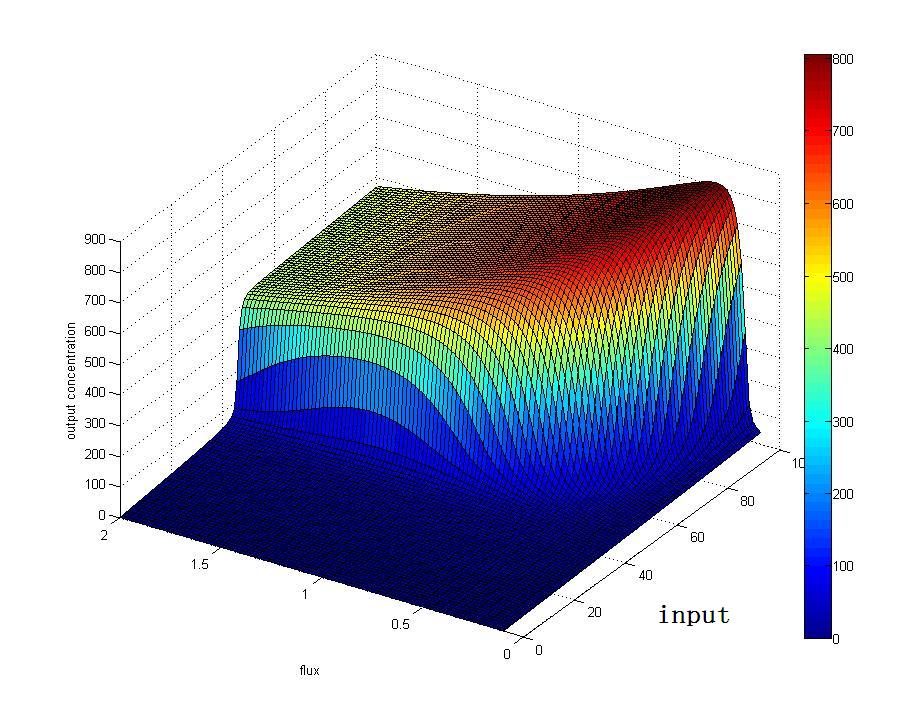
| + | Figure 5: With the rising of flux rate and input signal, the output signal tends to rocketrise at a particular value,which indicates the value of threshold. | ||
| + | [[Image:TJU8P2.jpg|500px]]<br> | ||
Latest revision as of 03:38, 27 October 2007
Figure 1: The concentration of AHL could be accelerated both by the addition of IPTG and proliferation of living cells.
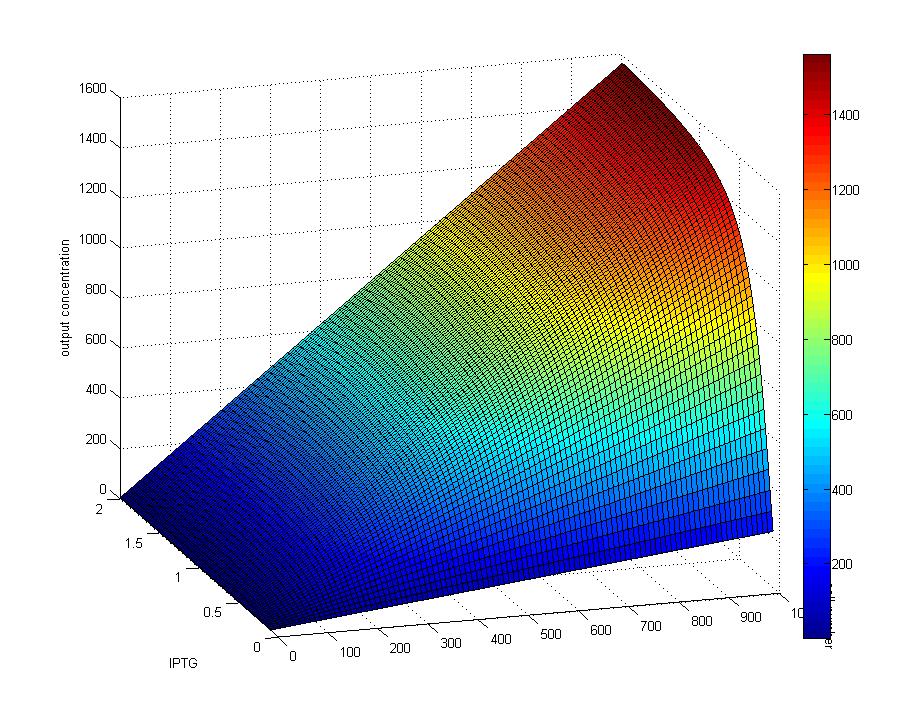
Figure 2: The concentration of AHL decreases nearly proportionally to the flow of liquid culture since the rate of AHL production maintains stable.
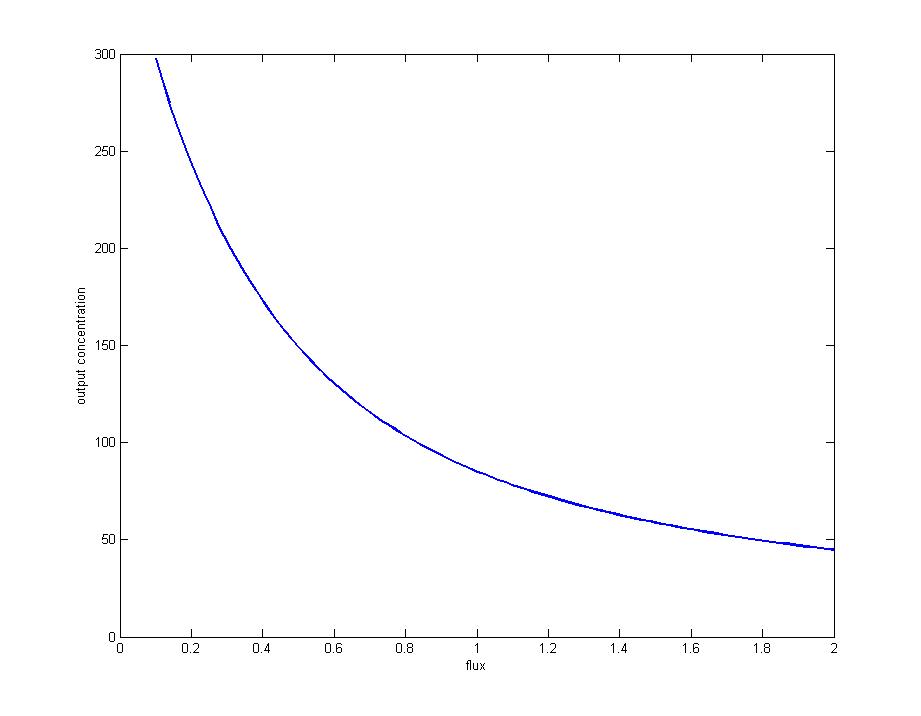
Figure 3: Concentration of AHL increases exponentially during the first 40 minutes after the input of liquid culture, but keeps constant from then on.
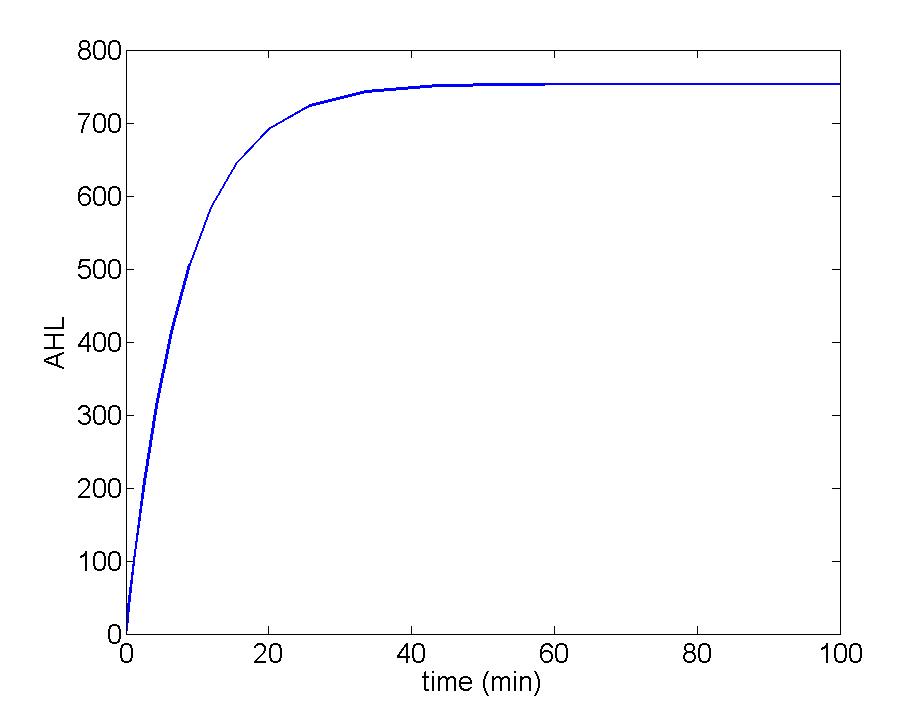
Figure 4: Rough description of relationship between the input of AHL signal and the output of AHL signal when the flux passes through the amplifier cells. Low concentration input failed to initiate the amplication process.
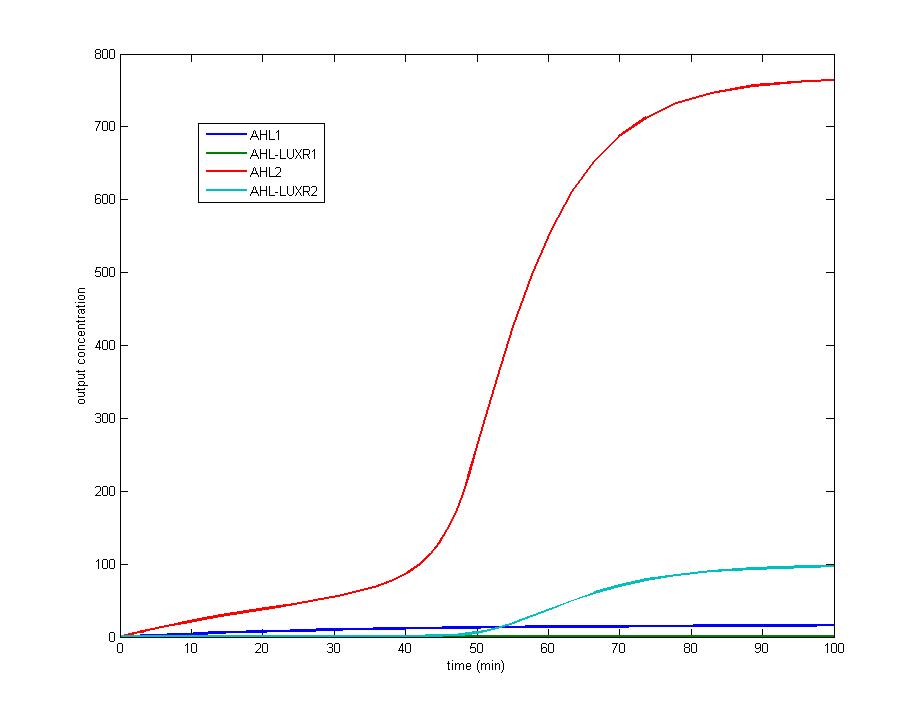
Figure 5: With the rising of flux rate and input signal, the output signal tends to rocketrise at a particular value,which indicates the value of threshold.
