Tianjin/DIODE/Experiment
From 2007.igem.org
Sunlovedie (Talk | contribs) |
(→Results) |
||
| (11 intermediate revisions not shown) | |||
| Line 1: | Line 1: | ||
| + | ==Introduction== | ||
| + | In our project the flow of signal molecular AHL is considered as the current, so we have to design a method to measure it. We choose the Detector Cell (BBa_T9002) which could accept AHL to produce Green Fluorescence Protein and fluorescence spectrophotometer which could quantificationally measure the fluorescence intensity. And then, we test our way of detecting the AHL to find that our method is valid within a certain concentration range of AHL. The Detector Cell do not work well when the concentration of AHL is high .The fluorescence spectrophotometer result is trustable only when the cell density is low. But it is still a good way to determine the concentration of AHL. | ||
| + | <br> | ||
| + | |||
| + | ==Results== | ||
Figure 1: Regardless of the cell concentration, production of GFP (Represented by the intensity of fluorescence) has a linear relationship with the concentration of AHL within the range of 0.01-1 uM. | Figure 1: Regardless of the cell concentration, production of GFP (Represented by the intensity of fluorescence) has a linear relationship with the concentration of AHL within the range of 0.01-1 uM. | ||
<br> | <br> | ||
| - | + | ||
| + | After mixing the detector cells culture and the AHL solution for 1.5 hours, the fluorescence value is measured by Virian Cary Eclipse fluorescence spectrophotometer using the 3ml cup at the following conditions : Excitation wavelength-501nm(5nm),Emission wavelength-511nm(5nm),Average time 0.5s. Five individual parallel experiments for each sample have been executed to get a more accurate result.<br> | ||
[[Image:TJU19B1.jpg|500px]] | [[Image:TJU19B1.jpg|500px]] | ||
<br><br><br><br> | <br><br><br><br> | ||
| - | Figure 2: The production of GFP is | + | Figure 2: The production of GFP is initiated when the concentration of AHL reaches 0.01uM, then keeps increasing linearly within the range of 0.01-1uM, finally varies inconspicuously at values over 1uM. |
<br> | <br> | ||
| - | + | ||
| + | After mixing the detector cells culture and the AHL solution for 1.5 hours, the fluorescence value is measured by Virian Cary Eclipse fluorescence spectrophotometer using the 200ul cup at the following condition : Excitation wavelength-495nm(10nm),Emission wavelength-515nm(10nm),Average time 5s. Five individual parallel experiments for each sample have been executed to get a more accurate result.<br> | ||
[[Image:TJU19B2.jpg|500px]] | [[Image:TJU19B2.jpg|500px]] | ||
<br><br><br><br> | <br><br><br><br> | ||
| - | Figure 3: The dependability of this measuring method is tested by calculating the standard deviation of | + | Figure 3: The dependability of this measuring method is tested by calculating the standard deviation of data from three parallel experiments. As shown on the graph, the length of vertical lines displays the value of standard deviation at a particular concentration of AHL, so the denser AHL is, the more inaccuracy the data could be. |
<br> | <br> | ||
| - | + | ||
| + | After mixing the detector cells culture and the AHL solution for 1.5 hours, the fluorescence value is measured by Virian Cary Eclipse fluorescence spectrophotometer using the 3ml cup at the following condition : Excitation wavelength-501nm(5nm),Emission wavelength-511nm(5nm),Average time 0.5s. Three individual parallel experiment for each sample have been executed to get a more accurate result.<br> | ||
| + | |||
[[Image:TJU19BB.jpg|500px]] | [[Image:TJU19BB.jpg|500px]] | ||
<br><br><br><br> | <br><br><br><br> | ||
| - | Figure 4: Relationship between the cell | + | Figure 4: Relationship between the cell density and the expression of GFP. <br> |
| + | Obviously, GFP increased with the density of E.coli cells.The abscissa means the relative OD (which is measured after diluted).When the cells reach a high density,the fluorescence value will not rise up at the same rate as before. Another result, attained using the 3ml cup, which is not presented here shows the same result that when the cell OD is higher than 0.8 the fluorescence value is not directly proportional to the cell density.(We guess that it is because of the larger cup volume) | ||
<br> | <br> | ||
| - | + | ||
| + | After mixing the detector cells culture and the AHL solution for 2 hours, the fluorescence value is measured by Virian Cary Eclipse fluorescence spectrophotometer using the 200ul cup at the following condition : Excitation wavelength-495nm(10nm),Emission wavelength-515nm(10nm),Average time 5s. Five individual parallel experiment for each sample have been executed to get a more accurate result.<br> | ||
| + | |||
[[Image:TJUGFP-AU.jpg|500px]]<br> | [[Image:TJUGFP-AU.jpg|500px]]<br> | ||
Latest revision as of 03:58, 27 October 2007
Introduction
In our project the flow of signal molecular AHL is considered as the current, so we have to design a method to measure it. We choose the Detector Cell (BBa_T9002) which could accept AHL to produce Green Fluorescence Protein and fluorescence spectrophotometer which could quantificationally measure the fluorescence intensity. And then, we test our way of detecting the AHL to find that our method is valid within a certain concentration range of AHL. The Detector Cell do not work well when the concentration of AHL is high .The fluorescence spectrophotometer result is trustable only when the cell density is low. But it is still a good way to determine the concentration of AHL.
Results
Figure 1: Regardless of the cell concentration, production of GFP (Represented by the intensity of fluorescence) has a linear relationship with the concentration of AHL within the range of 0.01-1 uM.
After mixing the detector cells culture and the AHL solution for 1.5 hours, the fluorescence value is measured by Virian Cary Eclipse fluorescence spectrophotometer using the 3ml cup at the following conditions : Excitation wavelength-501nm(5nm),Emission wavelength-511nm(5nm),Average time 0.5s. Five individual parallel experiments for each sample have been executed to get a more accurate result.

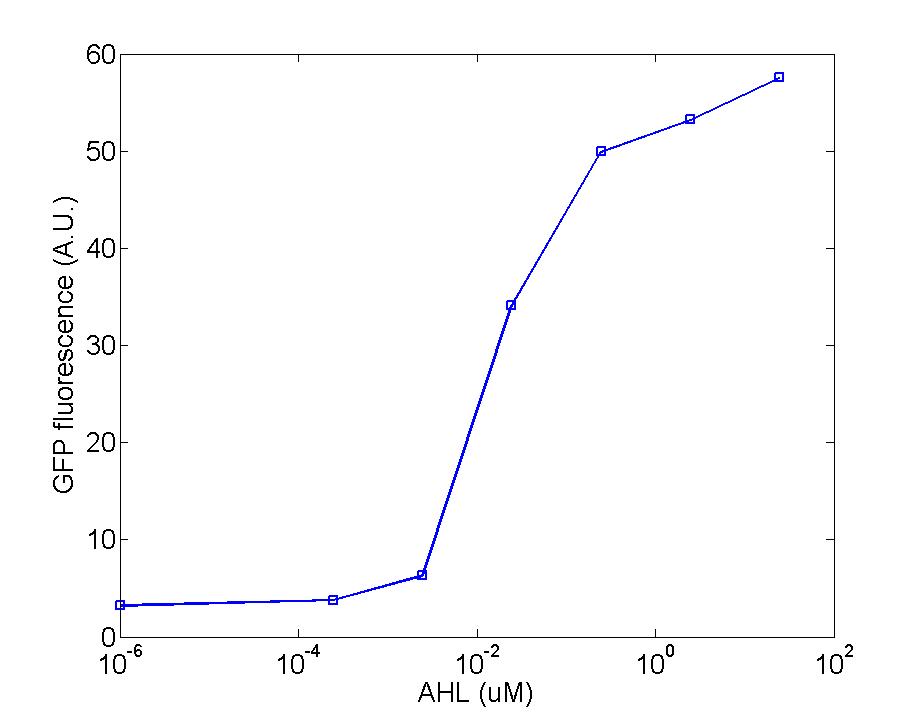
Figure 2: The production of GFP is initiated when the concentration of AHL reaches 0.01uM, then keeps increasing linearly within the range of 0.01-1uM, finally varies inconspicuously at values over 1uM.
After mixing the detector cells culture and the AHL solution for 1.5 hours, the fluorescence value is measured by Virian Cary Eclipse fluorescence spectrophotometer using the 200ul cup at the following condition : Excitation wavelength-495nm(10nm),Emission wavelength-515nm(10nm),Average time 5s. Five individual parallel experiments for each sample have been executed to get a more accurate result.

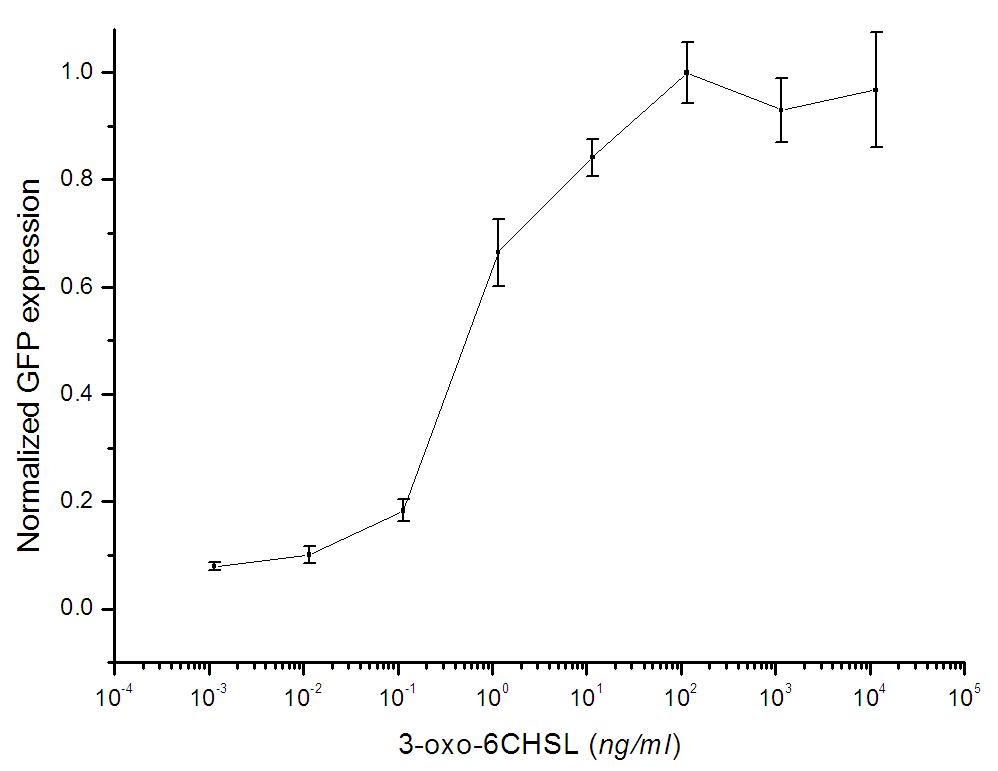
Figure 3: The dependability of this measuring method is tested by calculating the standard deviation of data from three parallel experiments. As shown on the graph, the length of vertical lines displays the value of standard deviation at a particular concentration of AHL, so the denser AHL is, the more inaccuracy the data could be.
After mixing the detector cells culture and the AHL solution for 1.5 hours, the fluorescence value is measured by Virian Cary Eclipse fluorescence spectrophotometer using the 3ml cup at the following condition : Excitation wavelength-501nm(5nm),Emission wavelength-511nm(5nm),Average time 0.5s. Three individual parallel experiment for each sample have been executed to get a more accurate result.

Figure 4: Relationship between the cell density and the expression of GFP.
Obviously, GFP increased with the density of E.coli cells.The abscissa means the relative OD (which is measured after diluted).When the cells reach a high density,the fluorescence value will not rise up at the same rate as before. Another result, attained using the 3ml cup, which is not presented here shows the same result that when the cell OD is higher than 0.8 the fluorescence value is not directly proportional to the cell density.(We guess that it is because of the larger cup volume)
After mixing the detector cells culture and the AHL solution for 2 hours, the fluorescence value is measured by Virian Cary Eclipse fluorescence spectrophotometer using the 200ul cup at the following condition : Excitation wavelength-495nm(10nm),Emission wavelength-515nm(10nm),Average time 5s. Five individual parallel experiment for each sample have been executed to get a more accurate result.
