Davidson Missouri W/Results
From 2007.igem.org
Wideloache (Talk | contribs) (→Flipping Detection by Phenotype) |
Wideloache (Talk | contribs) (→Gene Splitting Worked) |
||
| (86 intermediate revisions not shown) | |||
| Line 4: | Line 4: | ||
<br> | <br> | ||
| - | = | + | ==Gene Splitting Worked== |
| + | We were able to split two genes: GFP and RFP. Split GFP has strong green fluorescence. Split RFP's red color is somewhat reduced compared to wild-type RFP. It takes overnight incubation at room temperature for the red color to be visible in white light. Both colors are fluorescent under UV light, although the green color predominates. | ||
| - | + | [[Image:RFPGFPsplit.png|thumb|left|700px|'''Figures 1 and 2''': Split GFP (left) fluoresces green and split RFP (right) fluoresces red.]] | |
| - | [[Image: | + | [[Image:linebreak.png]] |
| - | + | ==Graphs== | |
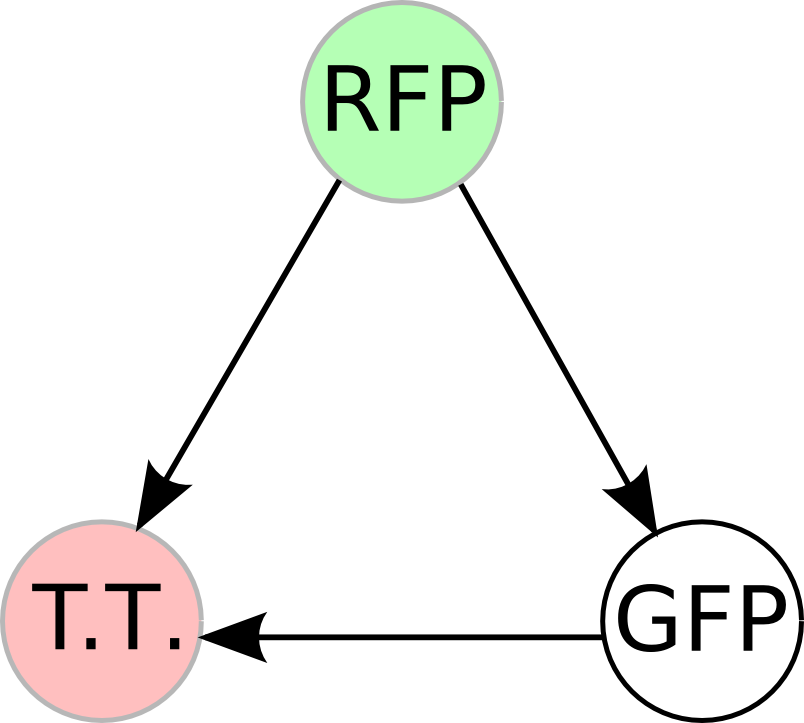
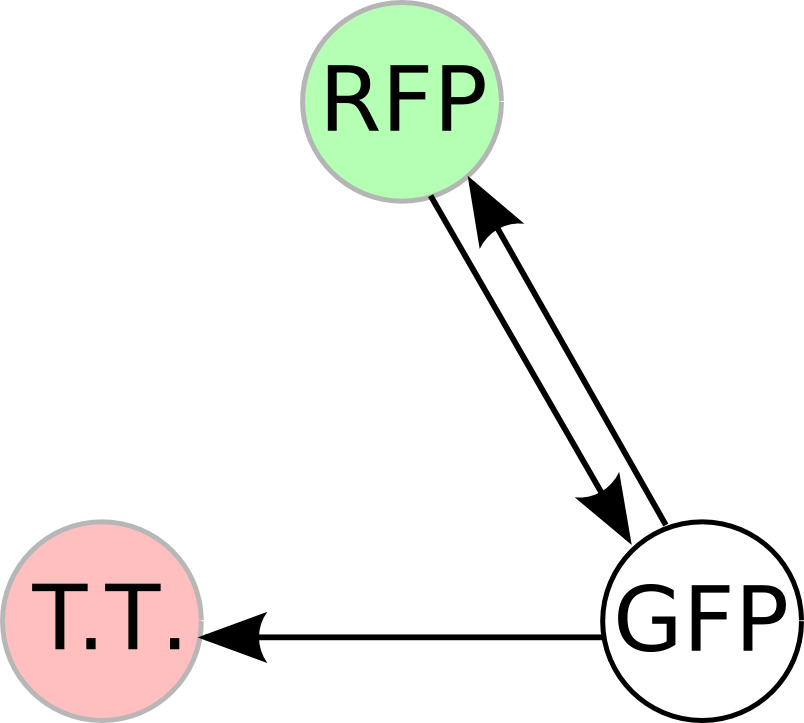
| - | + | Once we managed to split two genes, we proceeded to implement two different 3-node graphs into plasmids. These graphs were named Graphs A and B and are shown below. For each graph, we wanted to find a Hamiltonian Path from the node represented by RFP (colored in green) to the node represented by the transcriptional terminator (colored in red). The plasmid representation of Graph A is not be capable of flipping into a [https://2007.igem.org/Davidson_Missouri_W/Mathematical_Modeling#True_Positives_and_False_Positives false positive] orientation, while the plasmid representation of Graph B does provide that possibility. | |
| - | [[Image: | + | [[Image:MWSUgraph.png|thumb|200px|left|'''Graph A''': This graph contains 3-nodes and 3-edges. We wanted to find a Hamiltonian path from the node representing RFP (colored in green) to the node representing the transcriptional terminator (colored in red).]] [[Image:DCgraph.png|thumb|200px|none|'''Graph B''': This graph also contains 3-nodes and 3-edges, however it provides the possibility of a false positive solution.]] |
| + | [[Image:Linebreak.png]] | ||
| - | + | ==Starting Orientations== | |
| - | + | We constructed the following Hamiltonian Path Problem (HPP) constructs to test our bacterial computer system for Graphs A and B. Constructs that are built to solve [https://2007.igem.org/Image:MWSUgraph.png Graph A] are labeled HPP-A. Constructs that are built to solve [https://2007.igem.org/Image:DCgraph.png Graph B] are labeled HPP-B. A subscript equal to 0 denotes a plasmid in a solved orientation. A subscript that is greater than 0 denotes a plasmid that is in an unordered starting orientation. | |
| - | + | *'''HPP<sub>0</sub> (Positive Control for HPP-A and HPP-B constructs) '''<br>[[Image:Picture_1.png]]<br> | |
| + | *'''HPP-A<sub>0</sub> (Solved Orientation)'''<br>[[Image:Picture_2.png]]<br> | ||
| + | *'''HPP-A<sub>1</sub> '''<br>[[Image:Picture_3.png]]<br> | ||
| + | *'''HPP-A<sub>2</sub> '''<br>[[Image:Picture_4.png]]<br> | ||
| + | *'''HPP-B<sub>1</sub> '''<br>[[Image:Picture_5.png]]<br> | ||
| - | + | [[Image:Linebreak.png]] | |
| + | ==Controls== | ||
| + | Because are graphs require that solved colonies be selected for by double fluorescence (both red and green), we first performed control experiments to ensure that we could distinguish solved and unsolved colonies. To test fluorescence phenotypes when both split GFP and split RFP are the same cell, we used our positive control constructs ([http://partsregistry.org/Part:BBa_I715045 HPP<sub>0</sub>] and [http://partsregistry.org/Part:BBa_I715042 HPP-A<sub>0</sub>]) with split RFP and split GFP both downstream of the T7 polymerase promoter. In the presence of T7 polymerase, cells with the split RFP/GFP plasmid should demonstrate both green and red fluorescence. | ||
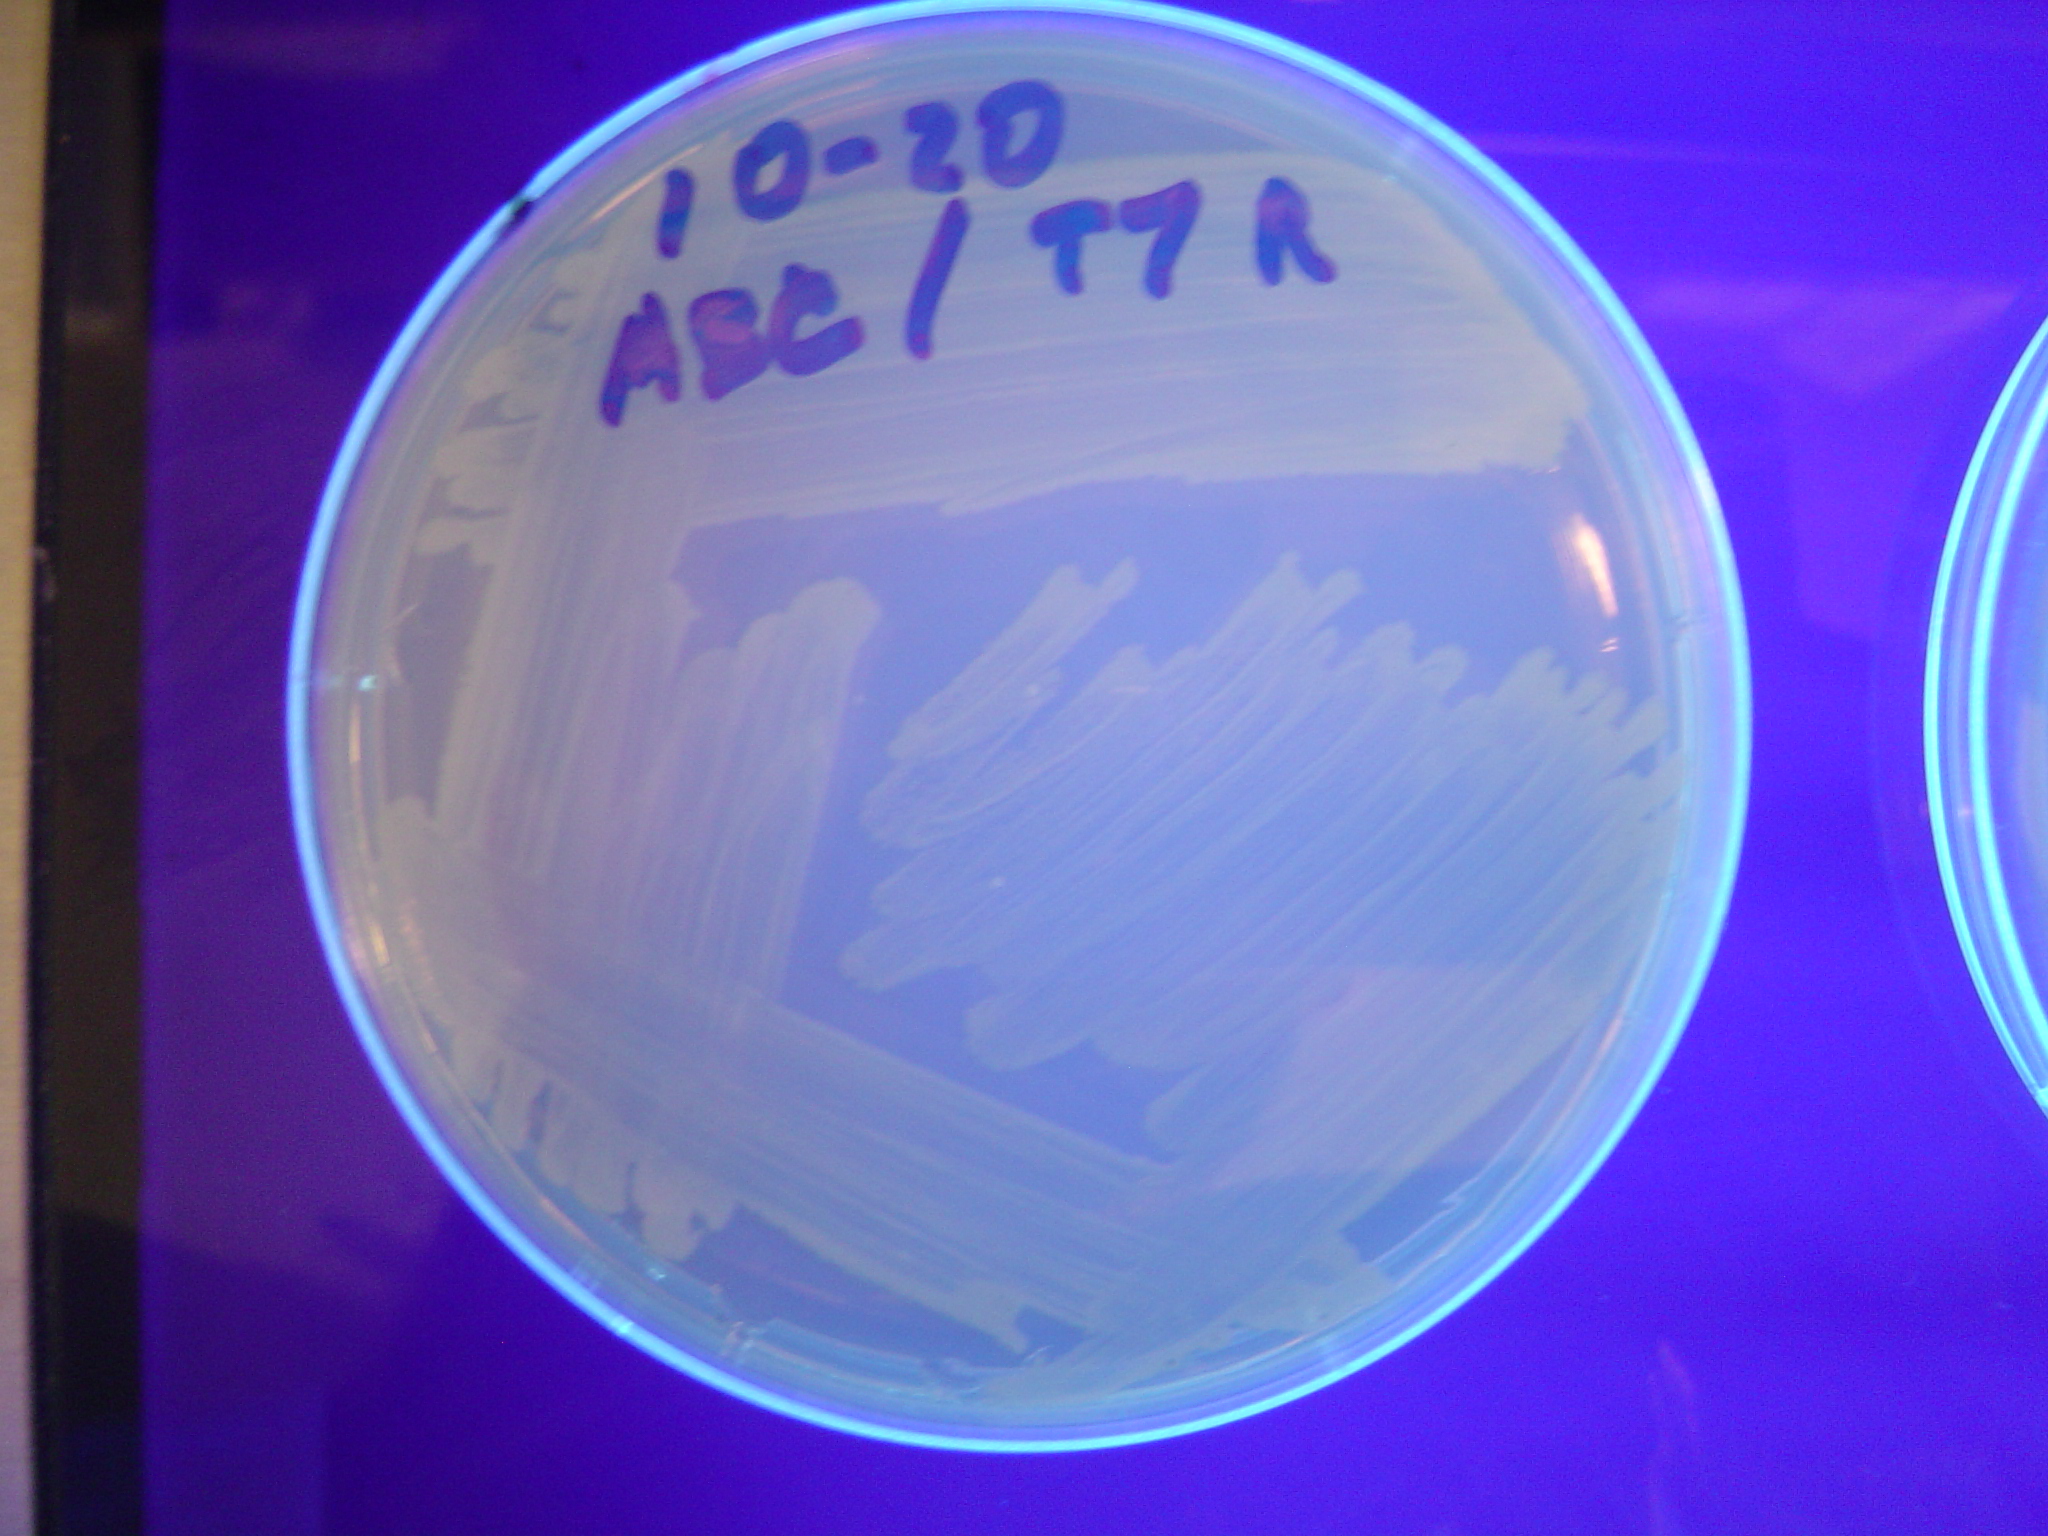
| - | [ | + | We first tried cotransforming our HPP<sub>0</sub> construct with a T7 RNA polymerase plasmid construct ([http://partsregistry.org/Part:BBa_I715038 BBa_I715038]). As can be seen in [https://2007.igem.org/Image:SplitRFP-GFP.jpg Figure 3] below, this cotransformation resulted in bright green colonies that demonstrated minimal red fluorescence. When we measured the fluorescence of the cotransformed control, RFP was not present at detectable levels (See fluorescence data [https://2007.igem.org/Davidson_Missouri_W/Results#Dectection_of_Fluoresence_by_Spectroscopy below]). |
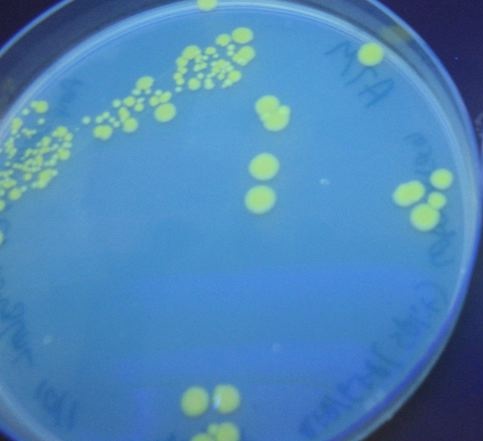
| + | We then tried transforming our HPP-A<sub>0</sub> control plasmid into cells that already contained T7 polymerase in their chromosome (T7 RNAP cells). As can be seen in [https://2007.igem.org/Image:DSC02737.jpeg Figure 4] below, these colonies displayed the yellowish color we expected. Based on our fluorescence data, (shown [https://2007.igem.org/Davidson_Missouri_W/Results#Dectection_of_Fluoresence_by_Spectroscopy below]), we were able to show that GFP and RFP were present at detectable levels in this control. We hypothesize that the difference in the two controls is due to higher concentrations of T7 RNA polymerase in the T7 RNAP cells than in the cotransformants. We therefore used the T7 RNAP cells for future experiments. | ||
| + | [[Image:SplitRFP-GFP.jpg|thumb|left|300px|'''Figure 3''': Colonies containing both the T7 RNA polymerase plasmid and the HPP<sub>0</sub> control plasmid demonstrated strong green fluorescence, but minimal red fluorescence.]] | ||
| + | [[Image:DSC02737.jpeg|thumb|left|380px|'''Figure 4''': T7 RNAP colonies that contain the HPP-A<sub>0</sub> control plasmid demonstrated the expected yellow fluorescence.]] | ||
| + | [[Image:Linebreak.png]] | ||
| + | In addition to the regular split RFP/GFP controls, we also tested 2 "hybrid" constructs to ensure that they would not fluoresce. GFP and RFP have similar structures and functions. Previous studies have shown that it is possible to modify GFP to display a wide range of color phenotypes. We created the following parts: Plac-RBS-RFP1-hixC-GFP2 ([http://partsregistry.org/Part:BBa_I715036 BBa_I715036]) and Plac-RBS-GFP1-hixC-RFP2 ([http://partsregistry.org/Part:BBa_I715035 BBa_I715035]). A plasmid may, at some point during its flipping process, contain such sequences. We tested to make sure that the similarity of these two proteins did not make them compatible enough to fluoresce. It was found that neither of these parts show any fluorescence or color change (See fluorescence data [https://2007.igem.org/Davidson_Missouri_W/Results#Dectection_of_Fluoresence_by_Spectroscopy below]). | ||
| + | [[Image:Linebreak.png]] | ||
| + | ==Dectection of Fluoresence by Spectroscopy== | ||
| + | We used a fluorometer to measure the fluorescence of various HPP constructs. First, we had to determine the excitation and emission wavelengths that would allow us to detect the green and red fluorescence of split genes. Scans were conducted in order to find these wavelengths. The graphs below show scans of excitation wavelengths that produce fluorescence at an emission wavelength of 515 nm , the wavelength we found to be best for green, and 608 nm, the best wavelength for red. We used these scans to pick a peak emission wavelength for further testing. | ||
| + | For these scans we used the following constructs:<br> | ||
| + | '''pLac-RBS-GFP1-''hixC''-GFP2''' - This construct fluoresces green on the UV box.<br> | ||
| + | '''HPP-A<sub>0</sub>''' - This construct fluoresces yellow on the UV box.<br> | ||
| + | '''HPP-A<sub>1</sub>''' - This construct fluoresces red on the UV box.<br> | ||
| + | '''HPP-A<sub>2</sub>''' - This construct shows no fluorescence on the UV box.<br> | ||
| + | <br> | ||
| - | + | [[Image:GFP Fluorescence.png|frame|none|Excitation Spectra at an Emission Wavelength of 515 nm (green light)]] | |
| - | + | ||
| - | + | ||
| - | + | ||
| - | + | ||
| - | + | ||
| - | + | [[Image:Red Fluorescence.png|frame|none|Excitation Spectra at an Emission Wavelength of 608 nm (red light)]] | |
| - | + | <br> | |
| + | On the basis of these scans, we used excitation/emission wavelengths of 450 nm / 515 nm for green and 560 nm / 608 nm for red to obtain the results shown below. | ||
| + | <br> | ||
| - | + | ===<center>Normalized* Fluorimetry Results</center>=== | |
| + | {| border="1" cellpadding="5" cellspacing="0" align="center" width="100%" | ||
| + | |- | ||
| + | ! style="color: black; background-color: white;" | Construct | ||
| + | ! style="color: black; background-color: white;" | Fluorescent Color on UV Box | ||
| + | ! style="color: black; background-color: white;" | Green | ||
| + | ! style="color: black; background-color: white;" | Red | ||
| + | |- | ||
| - | |||
| - | + | |pLac-RBS-<span style="color:red">RFP</span> | |
| + | |Red | ||
| + | |7 | ||
| + | |<span style="color:red">263</span> | ||
| + | |- | ||
| - | + | |pLac-RBS-<span style="color:red">RFP</span>-RBS-<span style="color:green">GFP</span> | |
| + | |Red | ||
| + | |<span style="color:green">144</span> | ||
| + | |<span style="color:red">370</span> | ||
| + | |- | ||
| - | + | |pLac-RBS-<span style="color:green">GFP1</span>-''hixC''-<span style="color:green">GFP2</span> | |
| + | |Green | ||
| + | |<span style="color:green">136</span> | ||
| + | |0 | ||
| + | |- | ||
| - | < | + | |pLac-RBS-<span style="color:red">RFP1</span>-''hixC''-<span style="color:red">RFP2</span> |
| + | |None | ||
| + | |0 | ||
| + | |<span style="color:red">147</span> | ||
| + | |- | ||
| - | |||
| - | + | |pLac-RBS-<span style="color:green">GFP1</span>-''hixC''-<span style="color:red">RFP2</span> | |
| + | |None | ||
| + | |11 | ||
| + | |2 | ||
| + | |- | ||
| - | + | |pLac-RBS-<span style="color:red">RFP1</span>-''hixC''-<span style="color:green">GFP2</span> | |
| + | |None | ||
| + | |13 | ||
| + | |2 | ||
| + | |- | ||
| - | + | |HPP<sub>0</sub>*** | |
| + | |Green | ||
| + | |<span style="color:green">72</span> | ||
| + | |18 | ||
| + | |- | ||
| - | + | |HPP-A<sub>0</sub> | |
| + | |Yellow | ||
| + | |<span style="color:green">340</span> | ||
| + | |<span style="color:red">255</span> | ||
| + | |- | ||
| - | + | |HPP-A<sub>1</sub> | |
| + | |Red | ||
| + | |1 | ||
| + | |<span style="color:red">143</span> | ||
| + | |- | ||
| - | + | |HPP-A<sub>2</sub> | |
| - | < | + | |None |
| - | < | + | |11 |
| - | + | |3 | |
| - | + | |- | |
| - | |||
| - | + | |HPP-B<sub>1</sub>*** | |
| - | + | |hybrid green | |
| - | + | |15 | |
| - | + | |3 | |
| - | + | |- | |
| - | + | ||
| - | + | ||
| - | + | ||
| - | + | |} | |
| - | + | '* To normalize the data, 57 fluorescence units were subtracted from the Green column and 18 from the Red column. These were the lowest fluorescence values for each wavelength.<br> | |
| + | '*** These 2 constructs were cotransformed with the T7 RNA polymerase plasmid (as opposed to being transformed into T7 RNAP cells). This could explain their reduced fluorescence. | ||
| - | |||
| - | |||
| - | |||
| - | |||
| - | |||
| - | |||
| - | |||
<br> | <br> | ||
| - | + | ==Solution Detected by Phenotype== | |
| - | [[ | + | To test for flipping by phenotype, we used our 3 - [[Davidson_Missouri_W/Results#Constructs |Graph A]] constructs from above, HPP-A<sub>0</sub>, HPP-A<sub>1</sub>, HPP-A<sub>2</sub>. As expected, unflipped HPP-A<sub>0</sub> fluoresced yellow, unflipped HPP-A<sub>1</sub> fluoresced red, and unflipped HPP-A<sub>2</sub> demonstrated no fluorescence when transformed into the T7 RNAP cells (See Figures 5-7 below). |
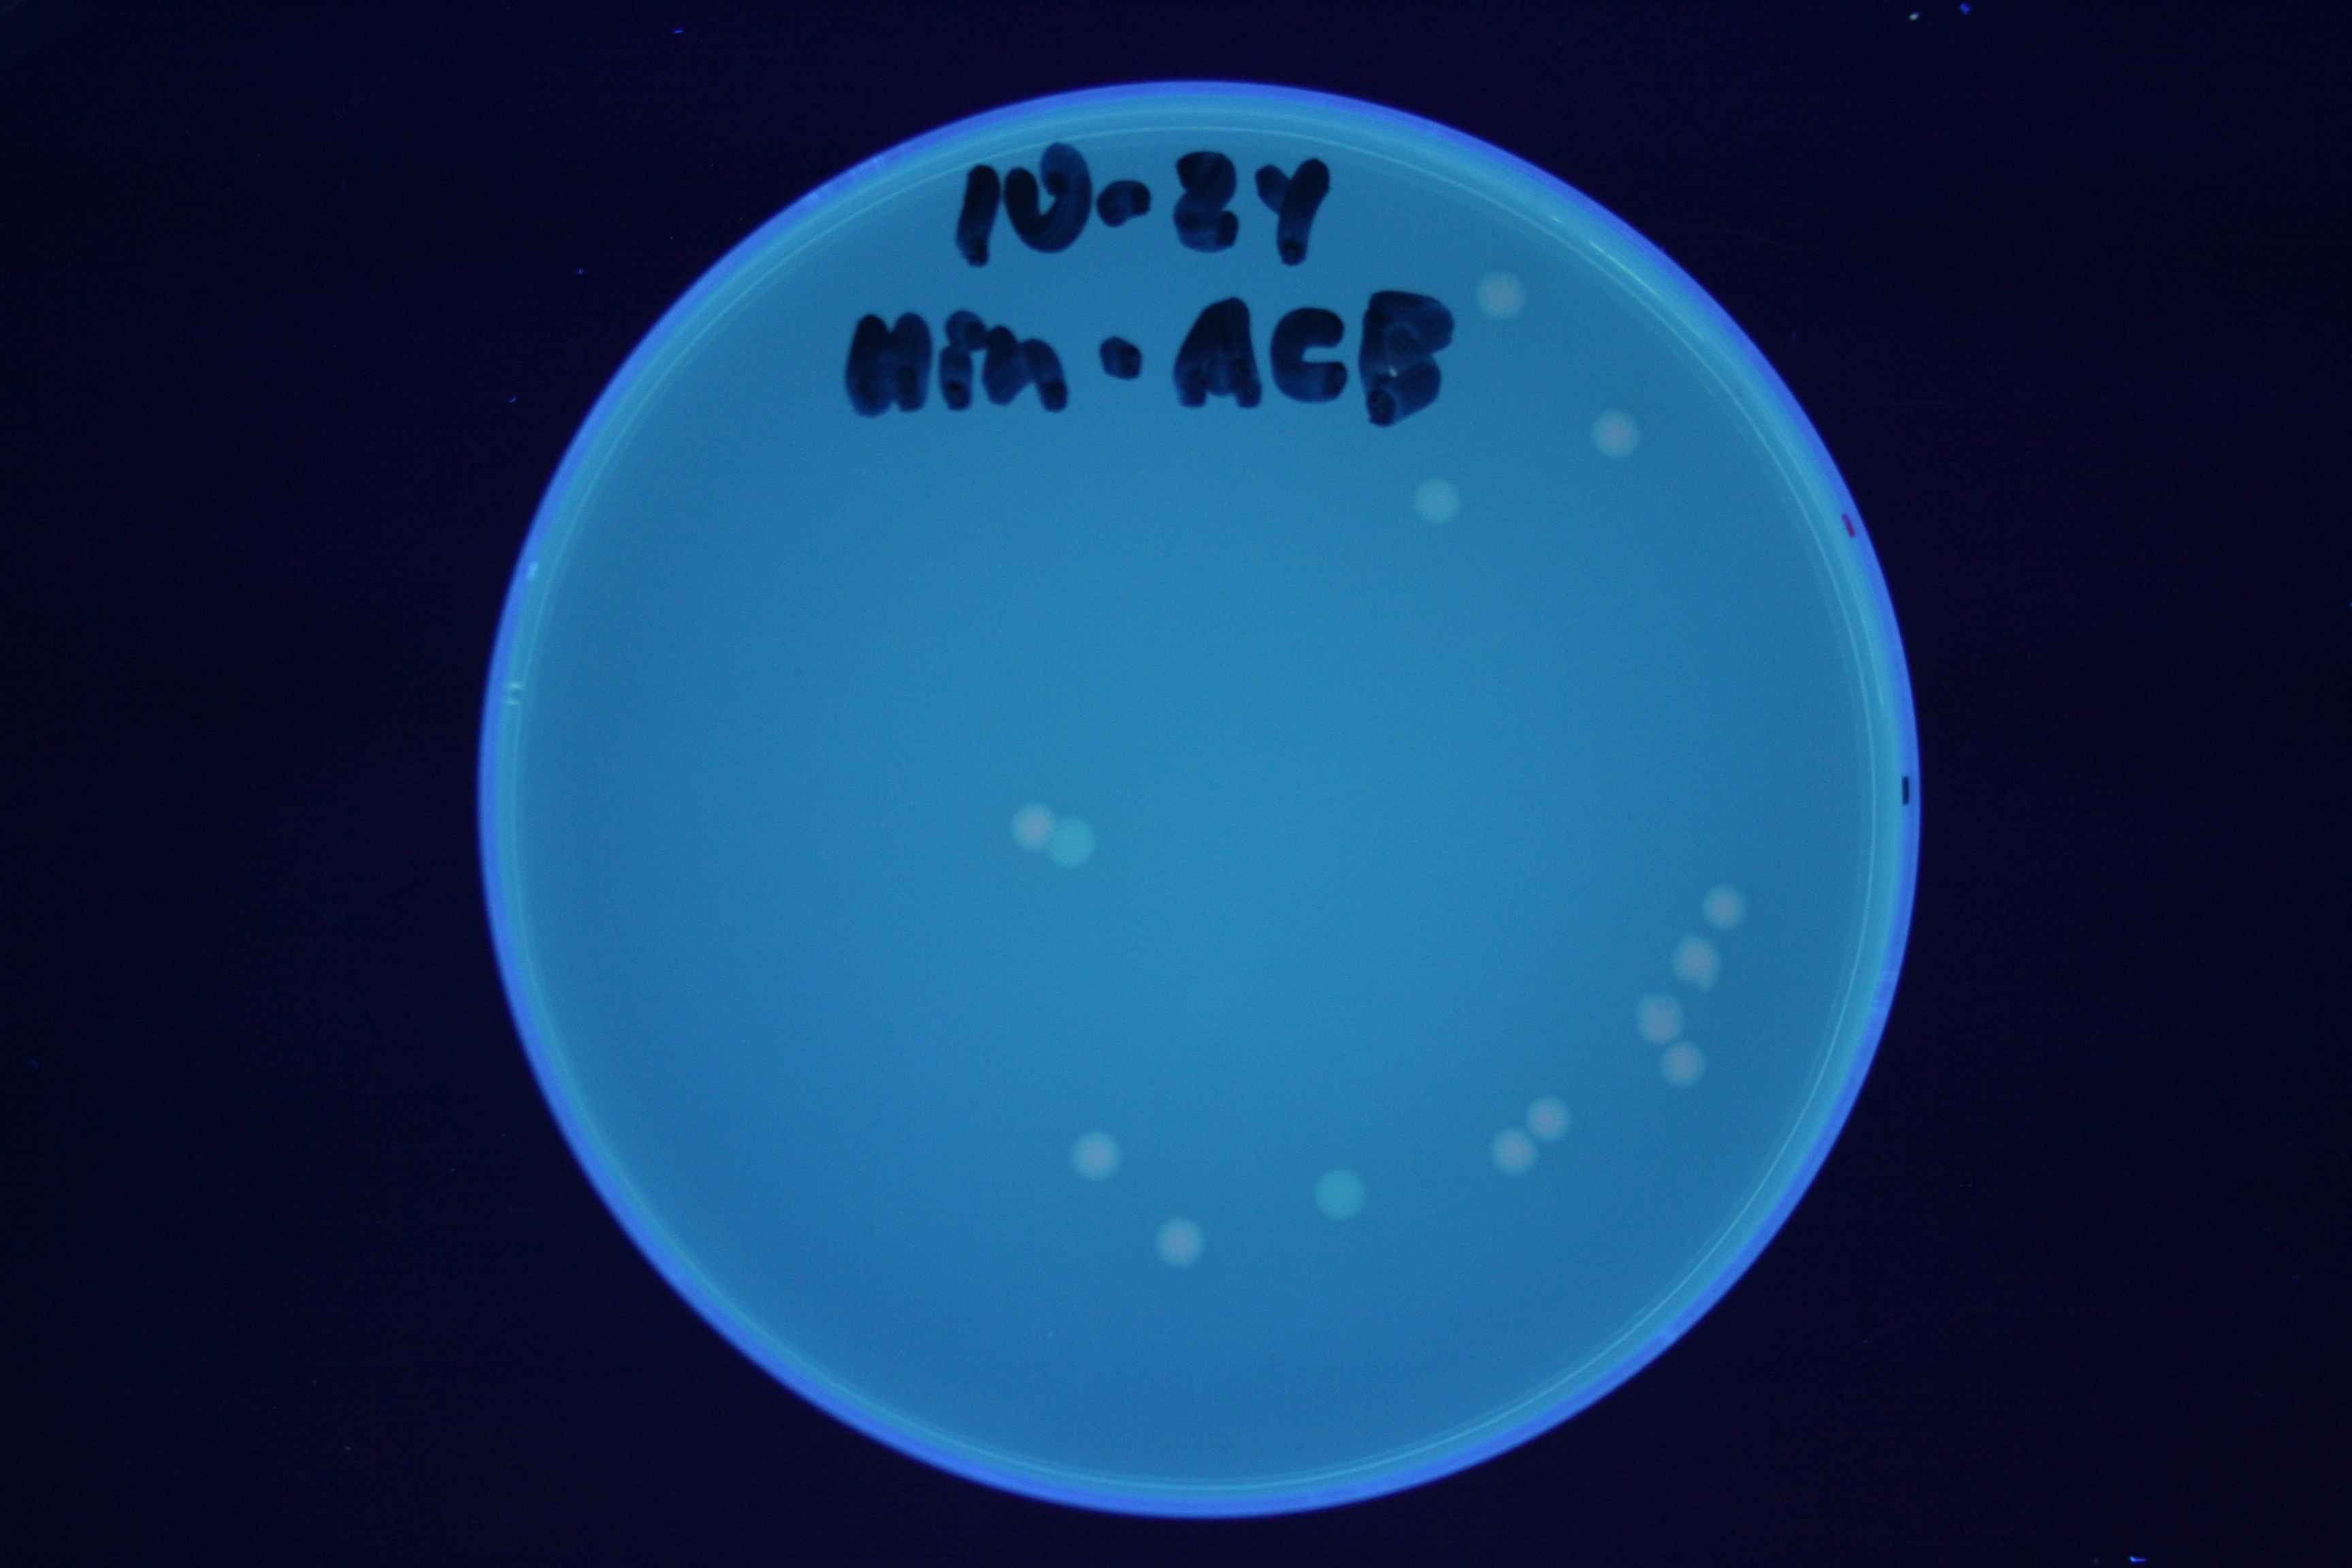
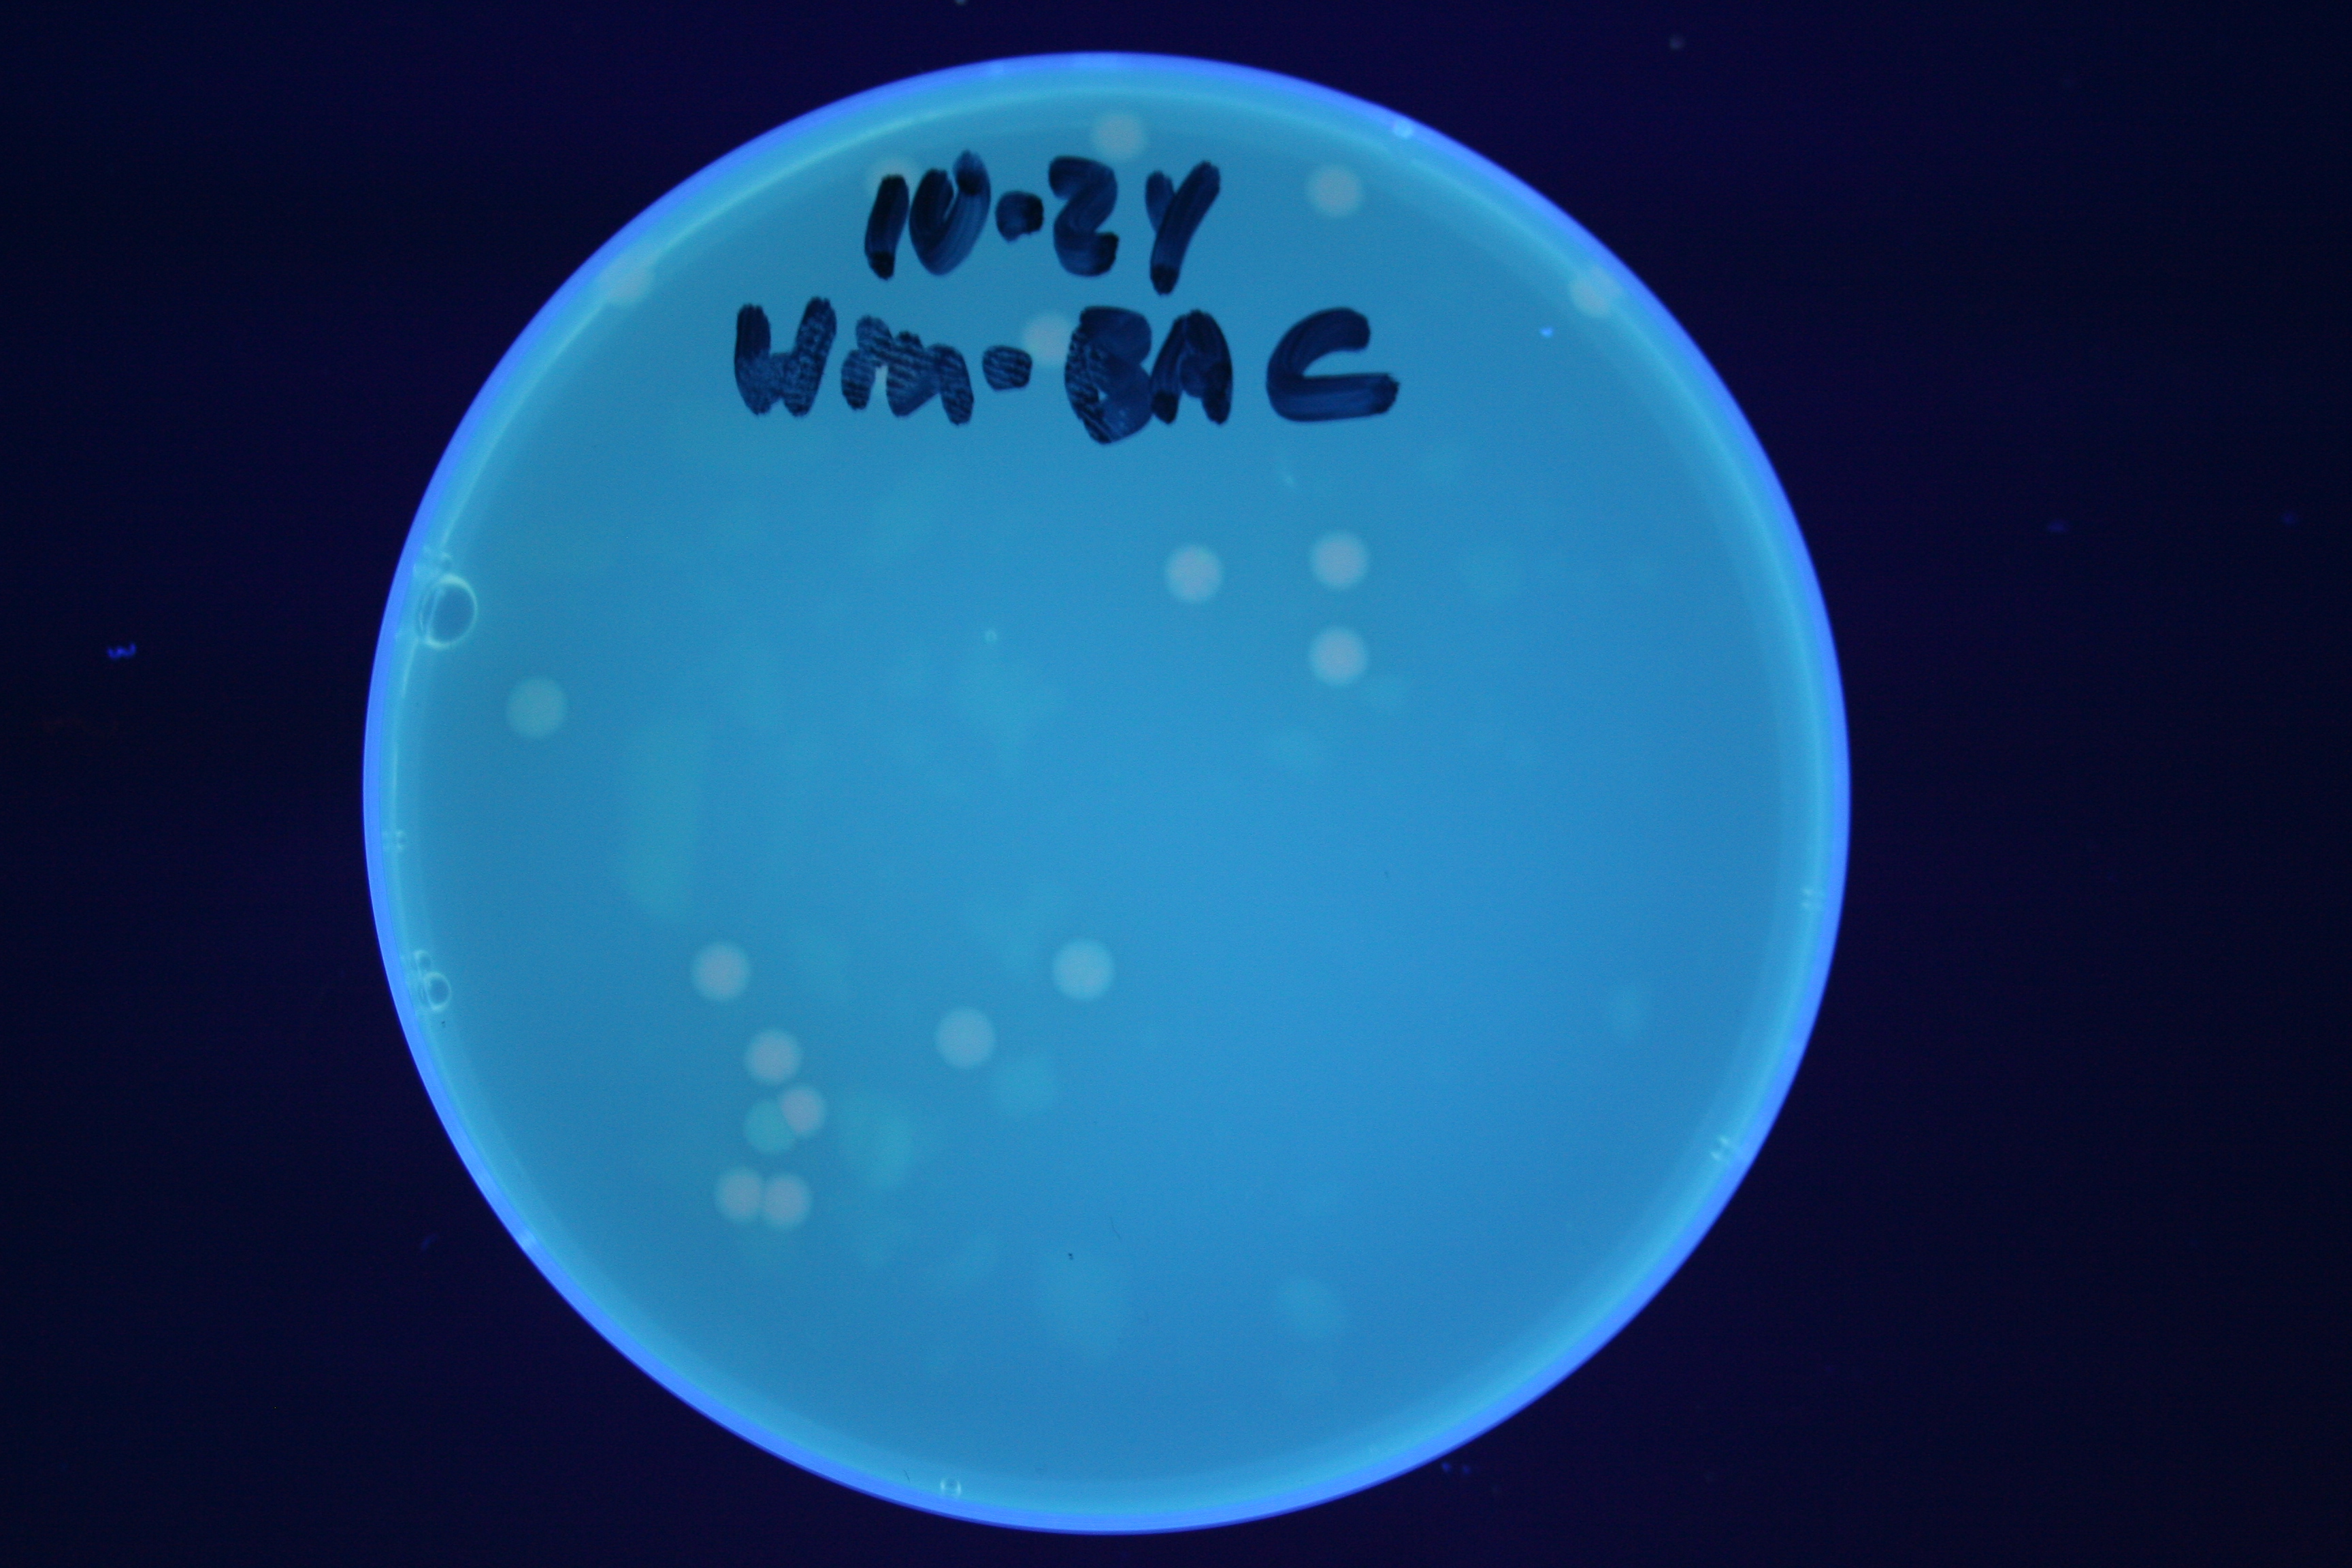
| + | A fragment containing the Hin expression cassette (pLac-RBS-Hin-LVA, [http://partsregistry.org/Part:BBa_S03536 BBa_S03536]) was ligated in front of each of the 3 HPP-A constructs. These HPP-A + Hin plasmids were then transformed into T7 RNAP cells. A colony from each transformation was picked and grown overnight for plasmid mini-prep. Each of the 3 constructs was restriction digested and the insert sizes were verified to be correct. The 3 constructs were then retransformed into T7 RNAP cells, and the resulting transformation mixture was streaked for colony isolation. '''The HPP-A<sub>0</sub> + Hin plate contained mostly yellow colonies but also red and green (See Figures 8 and 11). The Hin HPP-A<sub>1</sub> + Hin plate contained red, green and yellow colonies (See Figures 9 and 12). The HPP-A<sub>2</sub> + Hin plate contained mostly nonfluorescent colonies with a few green and red colonies (See Figures 10 and 13).'''<br> | ||
| + | |||
| + | |||
| + | ''Click twice on the images below for higher resolution.'' | ||
| + | |||
| + | [[Image:DSC02737.jpeg|thumb|left|270px|'''Figure 5:''' HPP-A<sub>0</sub> - These colonies fluoresced yellow]] [[Image:DSC02738.jpeg|thumb|left|270px|'''Figure 6:''' HPP-A<sub>1</sub> - These colonies fluoresced red]] [[Image:DSC02739.jpeg|thumb|left|270px|'''Figure 7:''' HPP-A<sub>2</sub> - These colonies do not fluoresce]] | ||
| + | |||
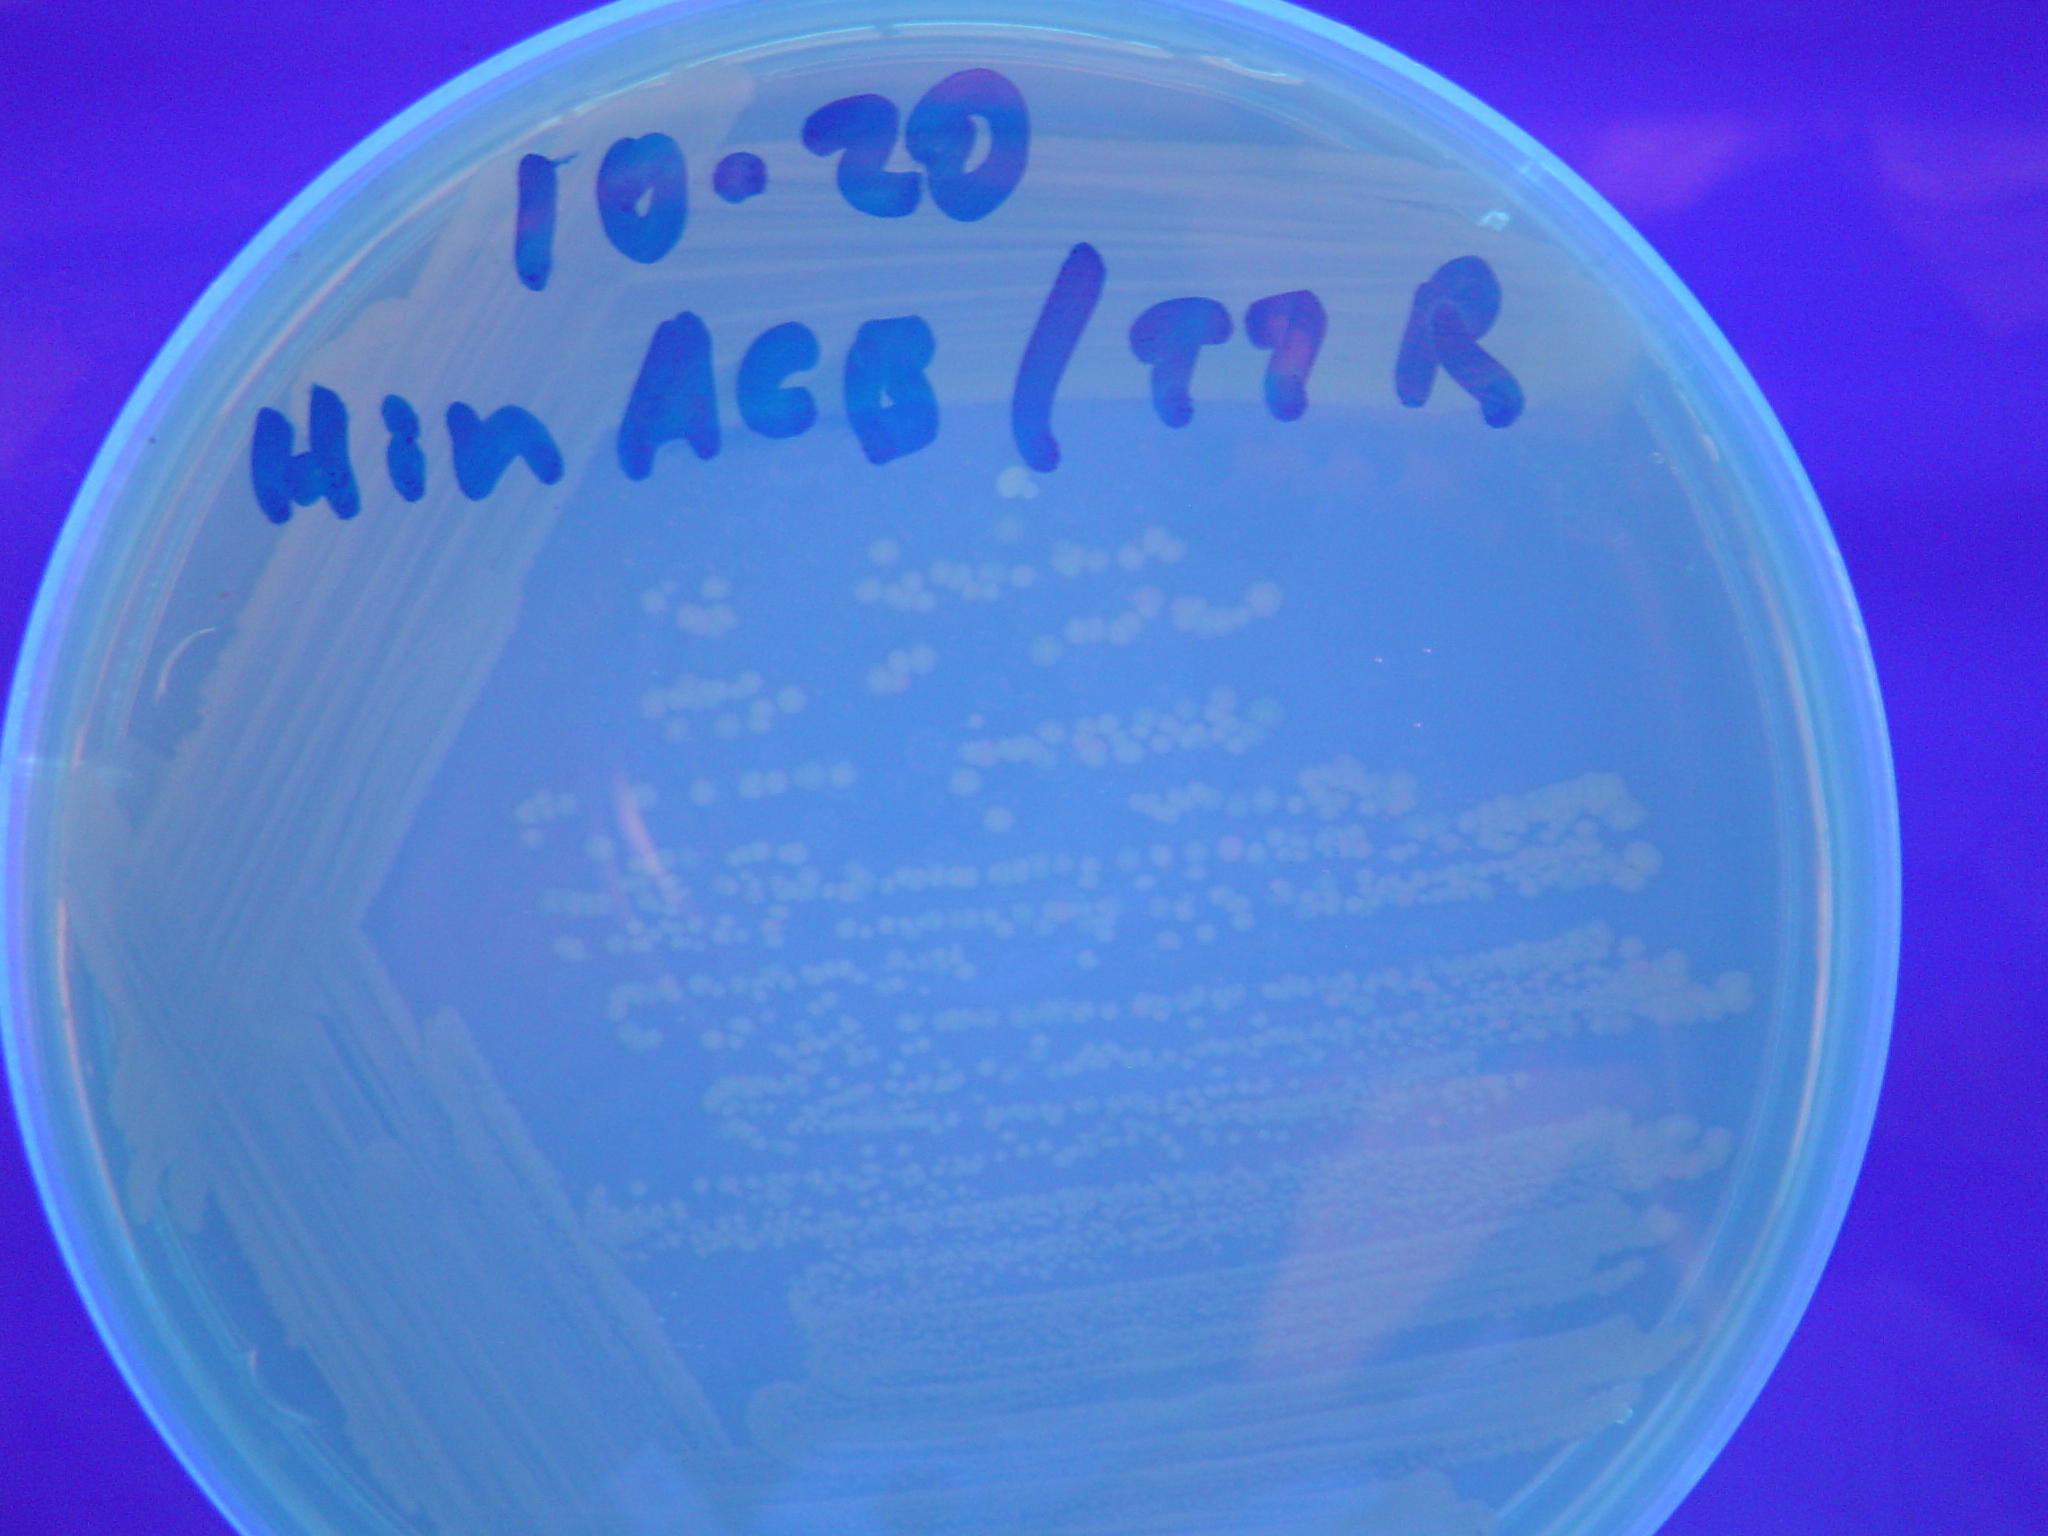
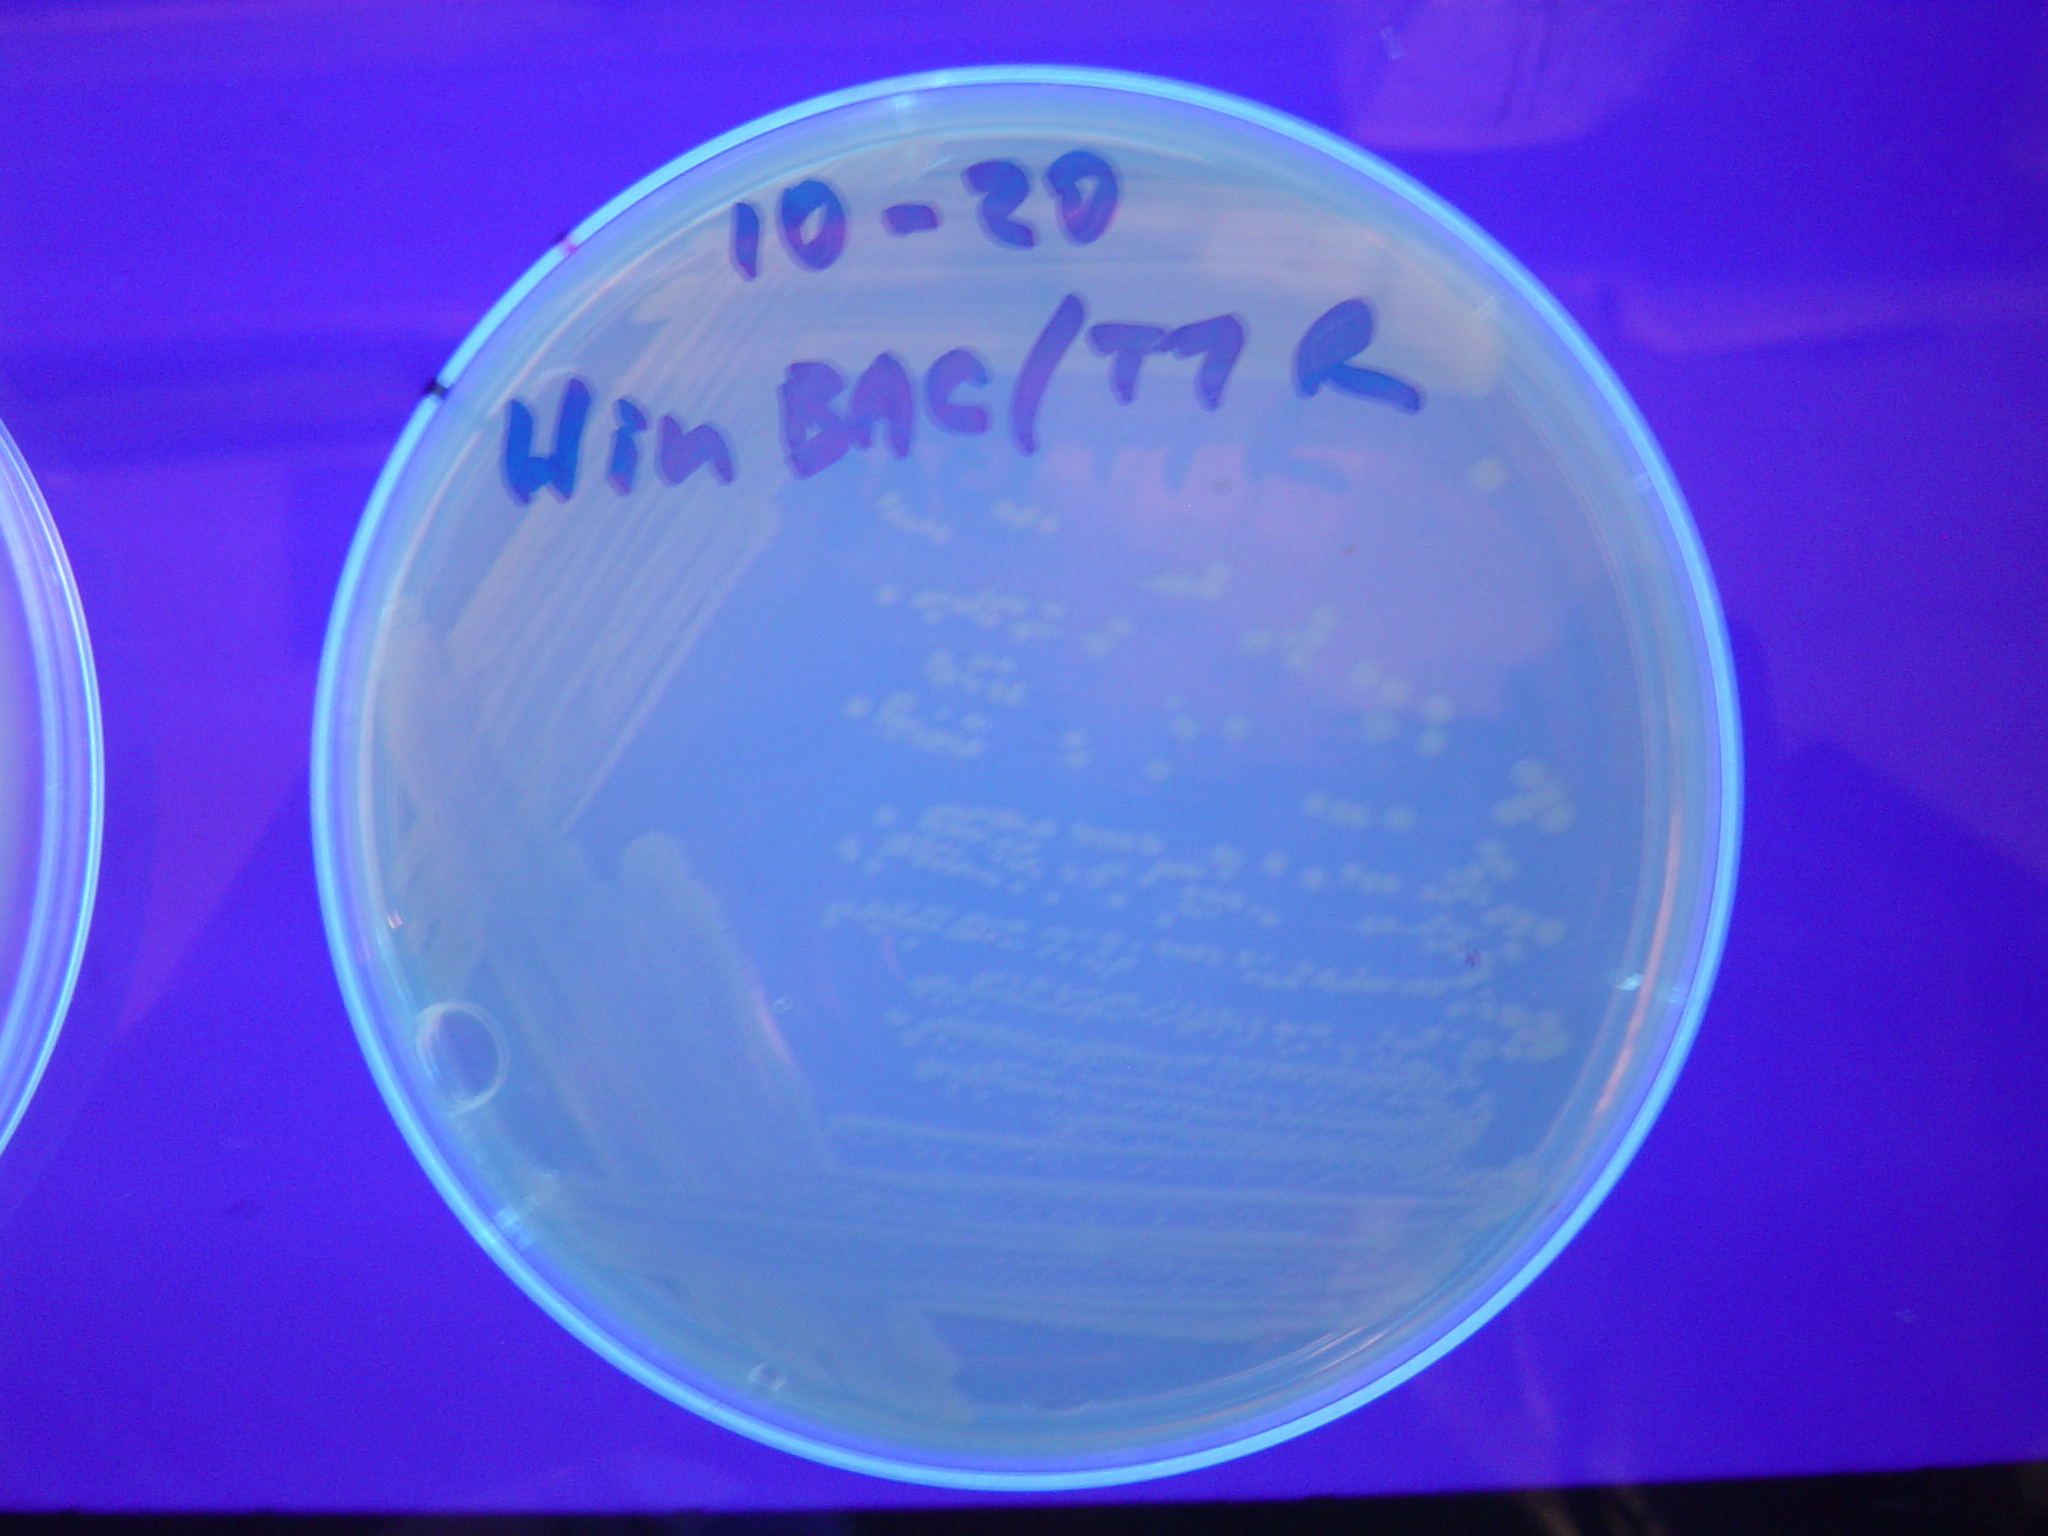
| + | [[Image:DSC02746.jpeg|thumb|left|270px|'''Figure 8:''' HPP-A<sub>0</sub> + Hin - The addition of Hin has produced green, red, and yellow colonies]] [[Image:DSC02744.jpeg|thumb|left|270px|'''Figure 9:''' HPP-A<sub>1</sub> + Hin - The addition of Hin has produced green, red, and yellow colonies]] [[Image:DSC02736.jpeg|thumb|left|270px|'''Figure 10:''' HPP-A<sub>2</sub> + Hin - The addition of Hin has produced green and red colonies]] | ||
| + | |||
| + | [[Image:Hin-ABC-cropped2.JPG|thumb|left|270px|'''Figure 11:''' HPP-A<sub>0</sub> + Hin - closeup of Figure 8]] | ||
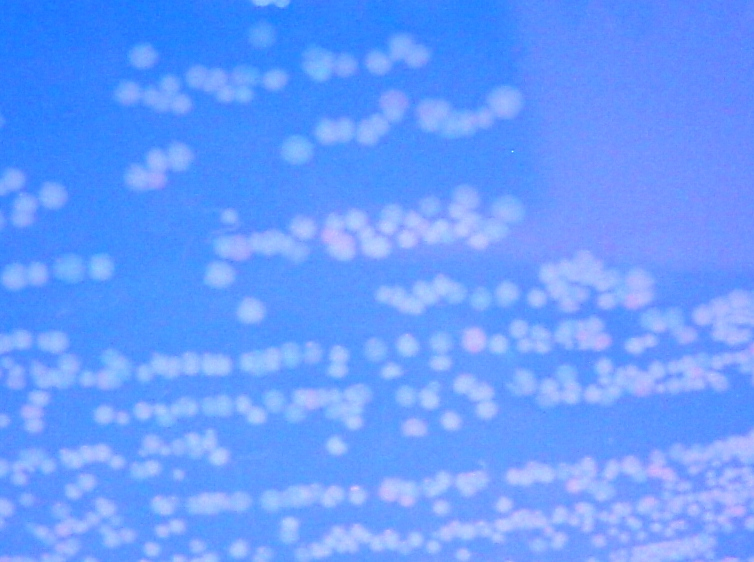
| + | [[Image:Hin-ACB-cropped3.JPG|thumb|left|270px|'''Figure 12:''' HPP-A<sub>1</sub> + Hin - closeup of Figure 9]] | ||
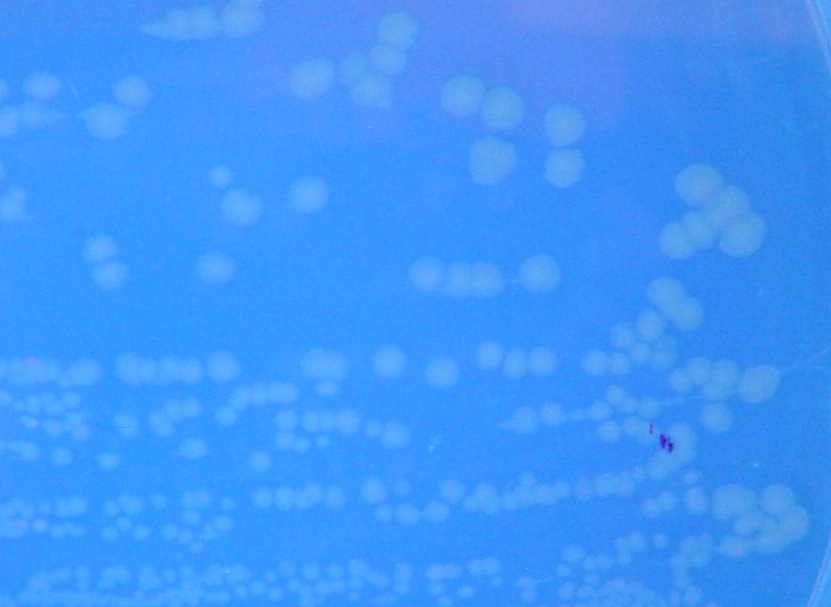
| + | [[Image:Hin-BAC-cropped.JPG|thumb|left|270px|'''Figure 13:''' HPP-A<sub>2</sub> + Hin - closeup of Figure 10]] | ||
| + | [[Image:Linebreak.png]] | ||
| + | [[Image:Hin-ABC-high.jpg|thumb|left|270px|'''Figure 14:''' HPP-A<sub>0</sub> + Hin]] | ||
| + | [[Image:Hin-ACB-high.jpg|thumb|left|270px|'''Figure 15:''' HPP-A<sub>1</sub> + Hin]] | ||
| + | [[Image:Hin-BAC-high.jpg|thumb|left|270px|'''Figure 16:''' HPP-A<sub>2</sub> + Hin]] | ||
| + | [[Image:Hin-ABC-low.jpg|thumb|left|270px|'''Figure 16:''' HPP-A<sub>0</sub> + Hin]] | ||
| + | [[Image:Hin-ACB-low.jpg|thumb|left|270px|'''Figure 17:''' HPP-A<sub>1</sub> + Hin]] | ||
| + | [[Image:Hin-BAC-low.jpg|thumb|left|270px|'''Figure 18:''' HPP-A<sub>2</sub> + Hin]] | ||
| + | |||
| + | [[Image:Linebreak.png]] | ||
| + | |||
| + | ==Solution Detected by PCR== | ||
| + | |||
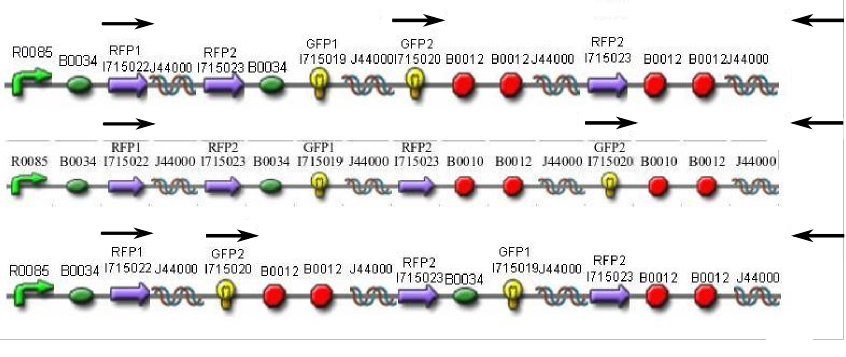
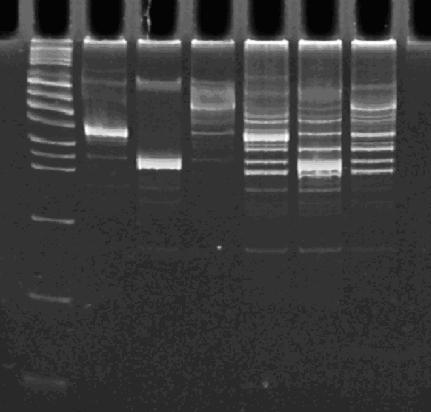
| + | In order to provide physical evidence of Hin-mediated DNA rearrangement of our HPP-A + Hin constructs, we designed PCR primers that would allow us to determine the position of the GFP2 gene half. The experiment below shows the results of PCR using the following multiplex primers: the universal reverse primer [http://partsregistry.org/Part:BBa_G00101 G00101], which binds to the 3' biobrick suffix, a forward primer that binds to RFP1, and a GFP2-forward primer. <br><br> | ||
| + | Here is how the primers bind to the 3 HPP-A constructs:<br> | ||
| + | [[Image:PCR with Primers.jpeg.png|frame|none|400px|'''PCR Primer Binding''': (from top to bottom) HPP-A<sub>0</sub>, HPP-A<sub>1</sub>, HPP-A<sub>2</sub>]]<br> | ||
<br> | <br> | ||
| - | + | [[Image:PCR 10-25-07.JPG|thumb|left|270px|Lane 1 : MW marker (50, 100, 200, 300, 400, 500, 750, 1000, 1400/1550, 2000, 3000, 4000, 6000 bp), Lanes 2 : HPP-A<sub>0</sub>, Lanes 3 : HPP-A<sub>1</sub>, Lanes 4 : HPP-A<sub>2</sub>, Lanes 5 : Hin+HPP-A<sub>0</sub>, Lanes 6 : Hin+HPP-A<sub>1</sub>, Lanes 7 : Hin+HPP-A<sub>2</sub>]] | |
<br> | <br> | ||
| + | [[Image:gels_10_25_07.JPG|thumb|left|270px|'''Left Gel''' - Lane 1 : MW marker (50, 100, 200, 300, 400, 500, 750, 1000, 1400/1550, 2000, 3000, 4000, 6000 bp), Lanes 2,3 : ClaI digest of Hin+HPP-A<sub>0</sub>, Lanes 4,5 : ClaI digest of Hin+HPP-A<sub>1</sub>, Lanes 6,7 : ClaI digest of Hin+HPP-A<sub>2</sub><br> | ||
| + | '''Right Gel''' - Lane 1 : MW marker (50, 100, 200, 300, 400, 500, 750, 1000, 1400/1550, 2000, 3000, 4000, 6000 bp), Lane 2 : unrelated digest, Lane 3 : EcoRI+PstI digest of Hin+HPP-A<sub>0</sub>, Lane 4 : unrelated digest, Lane 5 : EcoRI+PstI digest of Hin+HPP-A<sub>1</sub>, Lane 6 : unrelated digest, Lane 7 : EcoRI+PstI digest of Hin+HPP-A<sub>2</sub>]] | ||
| - | |||
<br> | <br> | ||
| - | + | [[Image:Linebreak.png]] | |
| + | |||
| + | [[Image:Linebreak.png]] | ||
| + | |||
| + | ==Conclusions== | ||
| + | We were able to insert a 13 amino acid ''hixC'' site into Green Fluorescent Protein (GFP) and Red Fluorescent Protein (RFP), maintaining the functionality of the proteins and allowing for flipping of the DNA by Hin Recombinase. When both split RFP and split GFP are present in the same cell, a yellow color can be observed by eye under UV light, and both red and green fluorescence are detected by fluorimetry. We then constructed a bacterial computer capable of solving a 3-node Hamiltonian Path Problem. We detected the solution by isolating cells that fluoresced yellow (both red and green). | ||
| + | |||
| + | To test for flipping of our HPP computer constructs, we attatched a Hin-expression vector to the HPP construct and observed phenotypic differences in colonies. For all of the starting orientations, we observed colonies of varying colors, suggesting that some colonies had flipped away from their starting orientation and into a new orientation that produced a different phenotype. We also tested for flipping by PCR and were able to see multiple bands for all of our flipped constructs. These results indicate that flipping has occured in each of our HPP constructs. | ||
| + | |||
| + | In the coming days, we plan to retransform our flipped HPP plasmid (with Hin-Recombinase removed from the plasmid) into T7 RNAP cells in order to obtain clonal colonies. We will screen for yellow colonies and sequencing any plasmids to verify correct solutions to the Hamiltonian Path Problem and solved by ''E. coli''. | ||
<br> | <br> | ||
Latest revision as of 13:56, 13 March 2008
Contents |
Gene Splitting Worked
We were able to split two genes: GFP and RFP. Split GFP has strong green fluorescence. Split RFP's red color is somewhat reduced compared to wild-type RFP. It takes overnight incubation at room temperature for the red color to be visible in white light. Both colors are fluorescent under UV light, although the green color predominates.
Graphs
Once we managed to split two genes, we proceeded to implement two different 3-node graphs into plasmids. These graphs were named Graphs A and B and are shown below. For each graph, we wanted to find a Hamiltonian Path from the node represented by RFP (colored in green) to the node represented by the transcriptional terminator (colored in red). The plasmid representation of Graph A is not be capable of flipping into a false positive orientation, while the plasmid representation of Graph B does provide that possibility.
Starting Orientations
We constructed the following Hamiltonian Path Problem (HPP) constructs to test our bacterial computer system for Graphs A and B. Constructs that are built to solve Graph A are labeled HPP-A. Constructs that are built to solve Graph B are labeled HPP-B. A subscript equal to 0 denotes a plasmid in a solved orientation. A subscript that is greater than 0 denotes a plasmid that is in an unordered starting orientation.
- HPP0 (Positive Control for HPP-A and HPP-B constructs)

- HPP-A0 (Solved Orientation)

- HPP-A1

- HPP-A2

- HPP-B1

Controls
Because are graphs require that solved colonies be selected for by double fluorescence (both red and green), we first performed control experiments to ensure that we could distinguish solved and unsolved colonies. To test fluorescence phenotypes when both split GFP and split RFP are the same cell, we used our positive control constructs ([http://partsregistry.org/Part:BBa_I715045 HPP0] and [http://partsregistry.org/Part:BBa_I715042 HPP-A0]) with split RFP and split GFP both downstream of the T7 polymerase promoter. In the presence of T7 polymerase, cells with the split RFP/GFP plasmid should demonstrate both green and red fluorescence.
We first tried cotransforming our HPP0 construct with a T7 RNA polymerase plasmid construct ([http://partsregistry.org/Part:BBa_I715038 BBa_I715038]). As can be seen in Figure 3 below, this cotransformation resulted in bright green colonies that demonstrated minimal red fluorescence. When we measured the fluorescence of the cotransformed control, RFP was not present at detectable levels (See fluorescence data below).
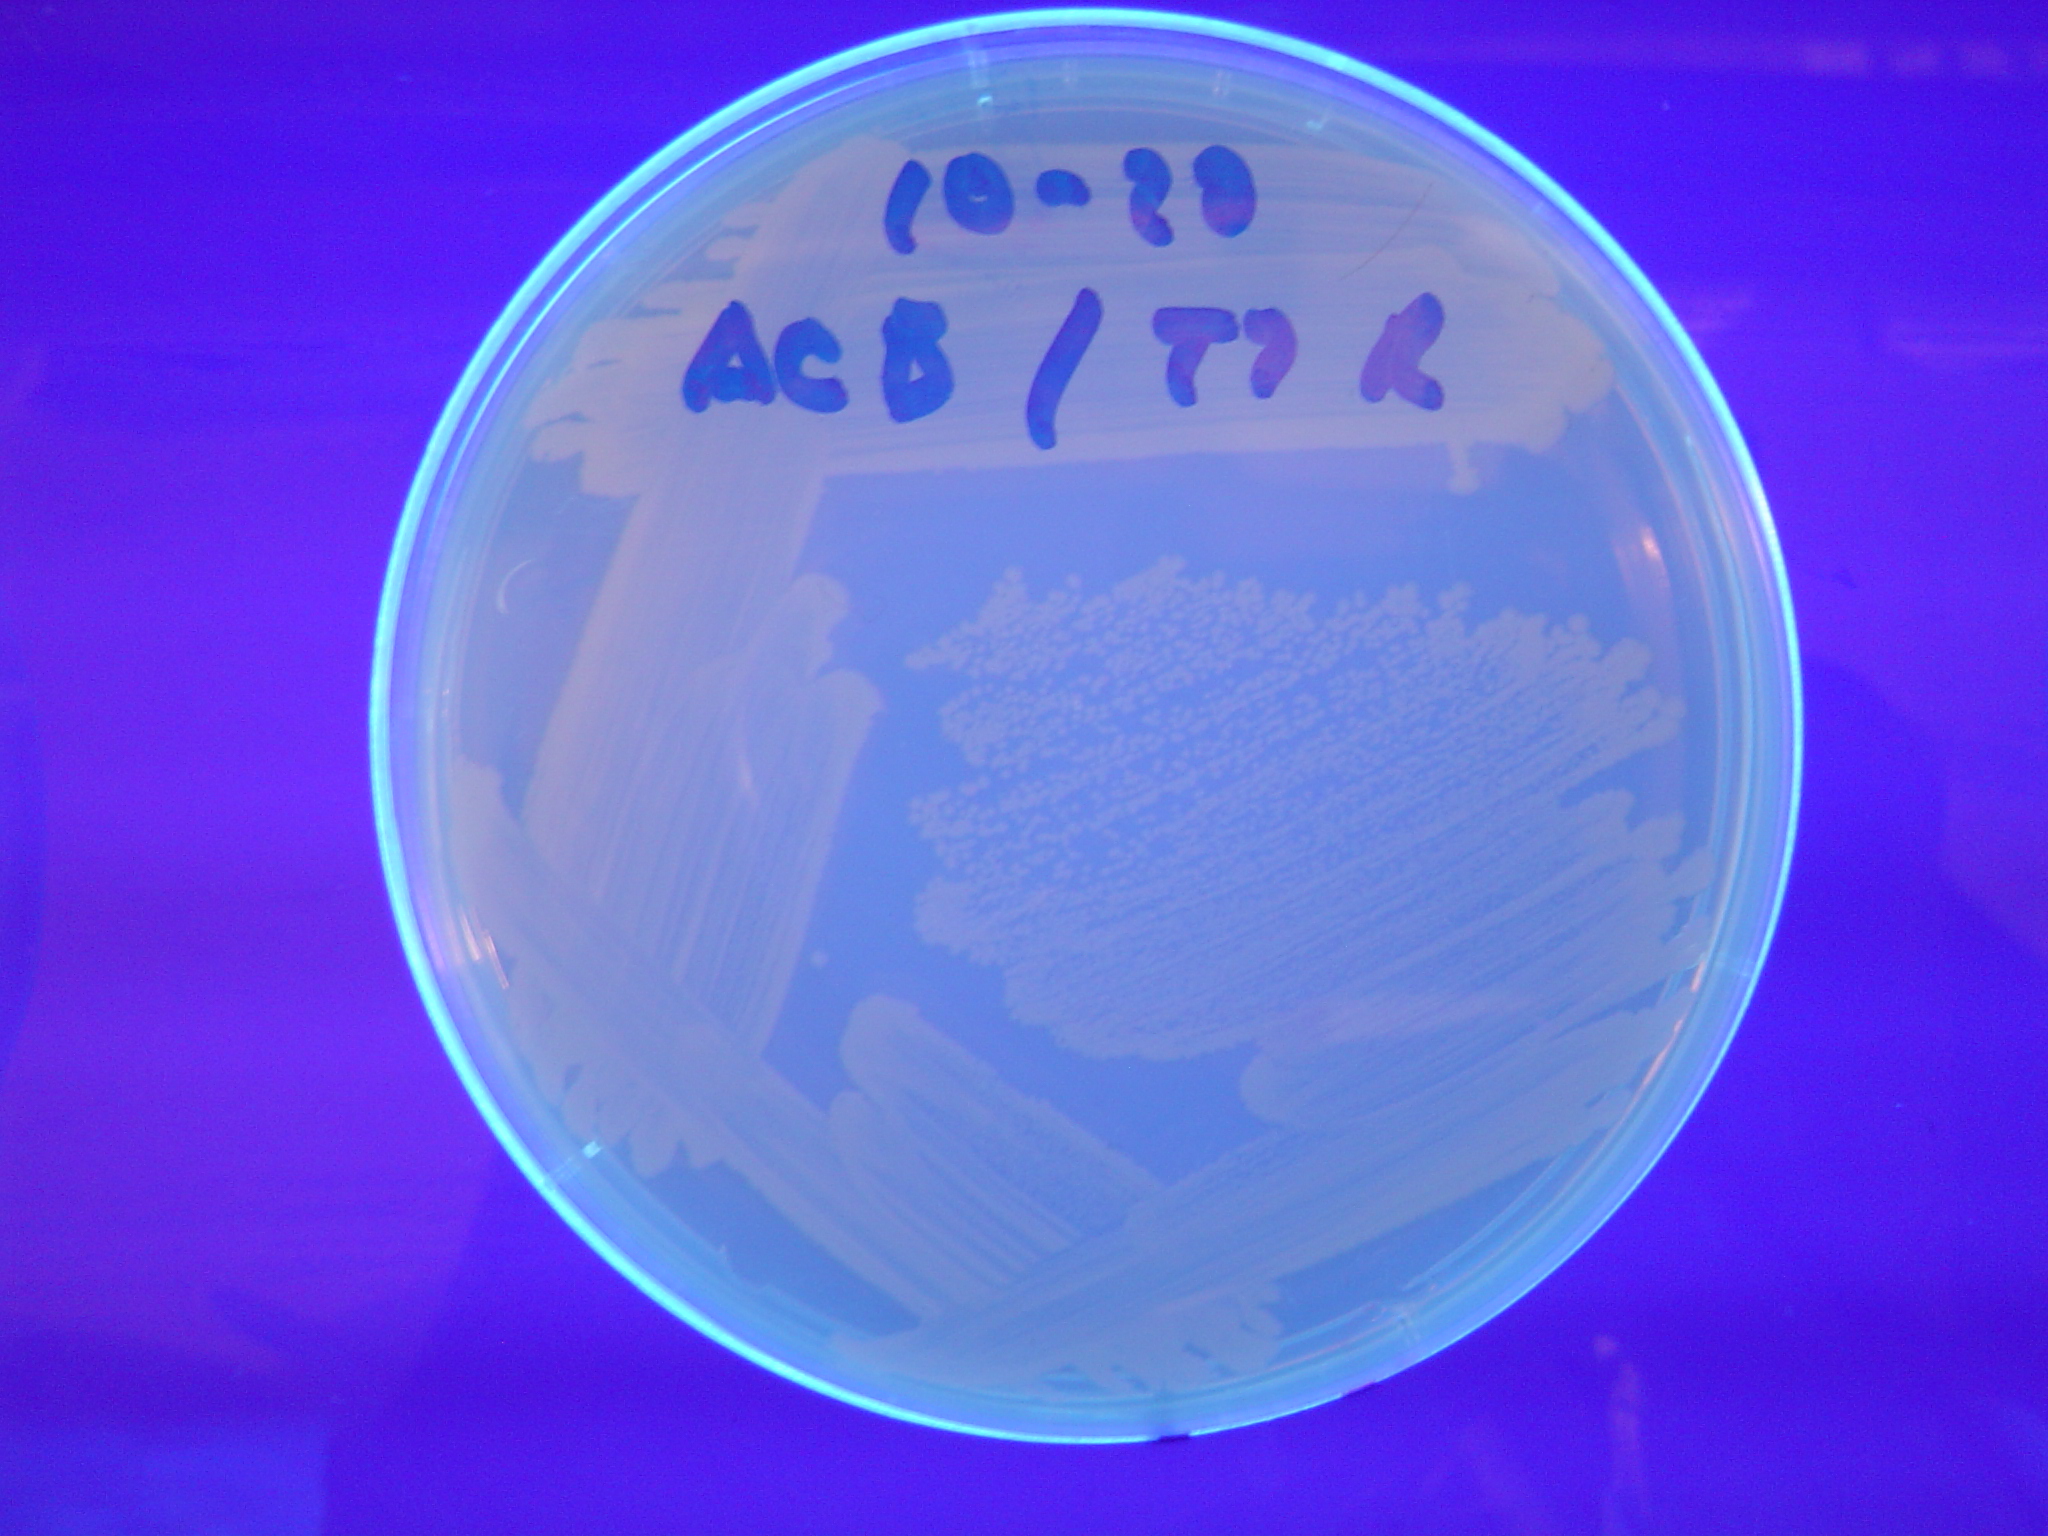
We then tried transforming our HPP-A0 control plasmid into cells that already contained T7 polymerase in their chromosome (T7 RNAP cells). As can be seen in Figure 4 below, these colonies displayed the yellowish color we expected. Based on our fluorescence data, (shown below), we were able to show that GFP and RFP were present at detectable levels in this control. We hypothesize that the difference in the two controls is due to higher concentrations of T7 RNA polymerase in the T7 RNAP cells than in the cotransformants. We therefore used the T7 RNAP cells for future experiments.
In addition to the regular split RFP/GFP controls, we also tested 2 "hybrid" constructs to ensure that they would not fluoresce. GFP and RFP have similar structures and functions. Previous studies have shown that it is possible to modify GFP to display a wide range of color phenotypes. We created the following parts: Plac-RBS-RFP1-hixC-GFP2 ([http://partsregistry.org/Part:BBa_I715036 BBa_I715036]) and Plac-RBS-GFP1-hixC-RFP2 ([http://partsregistry.org/Part:BBa_I715035 BBa_I715035]). A plasmid may, at some point during its flipping process, contain such sequences. We tested to make sure that the similarity of these two proteins did not make them compatible enough to fluoresce. It was found that neither of these parts show any fluorescence or color change (See fluorescence data below).
Dectection of Fluoresence by Spectroscopy
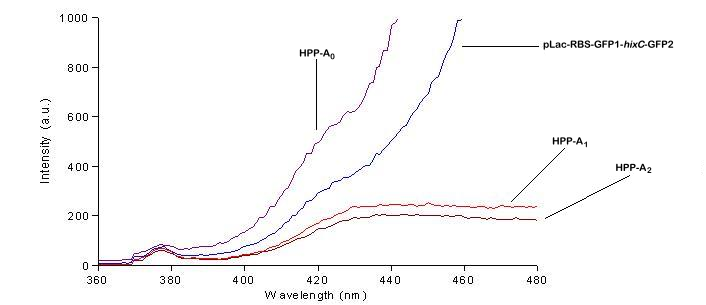
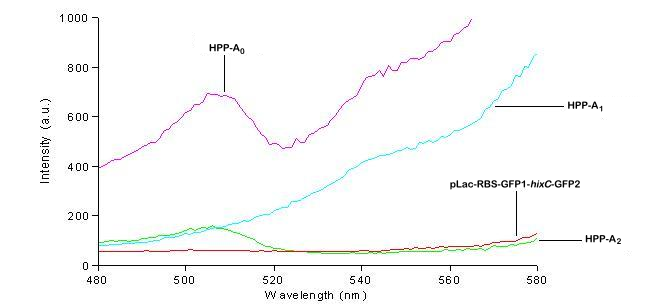
We used a fluorometer to measure the fluorescence of various HPP constructs. First, we had to determine the excitation and emission wavelengths that would allow us to detect the green and red fluorescence of split genes. Scans were conducted in order to find these wavelengths. The graphs below show scans of excitation wavelengths that produce fluorescence at an emission wavelength of 515 nm , the wavelength we found to be best for green, and 608 nm, the best wavelength for red. We used these scans to pick a peak emission wavelength for further testing.
For these scans we used the following constructs:
pLac-RBS-GFP1-hixC-GFP2 - This construct fluoresces green on the UV box.
HPP-A0 - This construct fluoresces yellow on the UV box.
HPP-A1 - This construct fluoresces red on the UV box.
HPP-A2 - This construct shows no fluorescence on the UV box.
On the basis of these scans, we used excitation/emission wavelengths of 450 nm / 515 nm for green and 560 nm / 608 nm for red to obtain the results shown below.
Normalized* Fluorimetry Results
| Construct | Fluorescent Color on UV Box | Green | Red |
|---|---|---|---|
| pLac-RBS-RFP | Red | 7 | 263 |
| pLac-RBS-RFP-RBS-GFP | Red | 144 | 370 |
| pLac-RBS-GFP1-hixC-GFP2 | Green | 136 | 0 |
| pLac-RBS-RFP1-hixC-RFP2 | None | 0 | 147 |
| pLac-RBS-GFP1-hixC-RFP2 | None | 11 | 2 |
| pLac-RBS-RFP1-hixC-GFP2 | None | 13 | 2 |
| HPP0*** | Green | 72 | 18 |
| HPP-A0 | Yellow | 340 | 255 |
| HPP-A1 | Red | 1 | 143 |
| HPP-A2 | None | 11 | 3 |
| HPP-B1*** | hybrid green | 15 | 3 |
'* To normalize the data, 57 fluorescence units were subtracted from the Green column and 18 from the Red column. These were the lowest fluorescence values for each wavelength.
'*** These 2 constructs were cotransformed with the T7 RNA polymerase plasmid (as opposed to being transformed into T7 RNAP cells). This could explain their reduced fluorescence.
Solution Detected by Phenotype
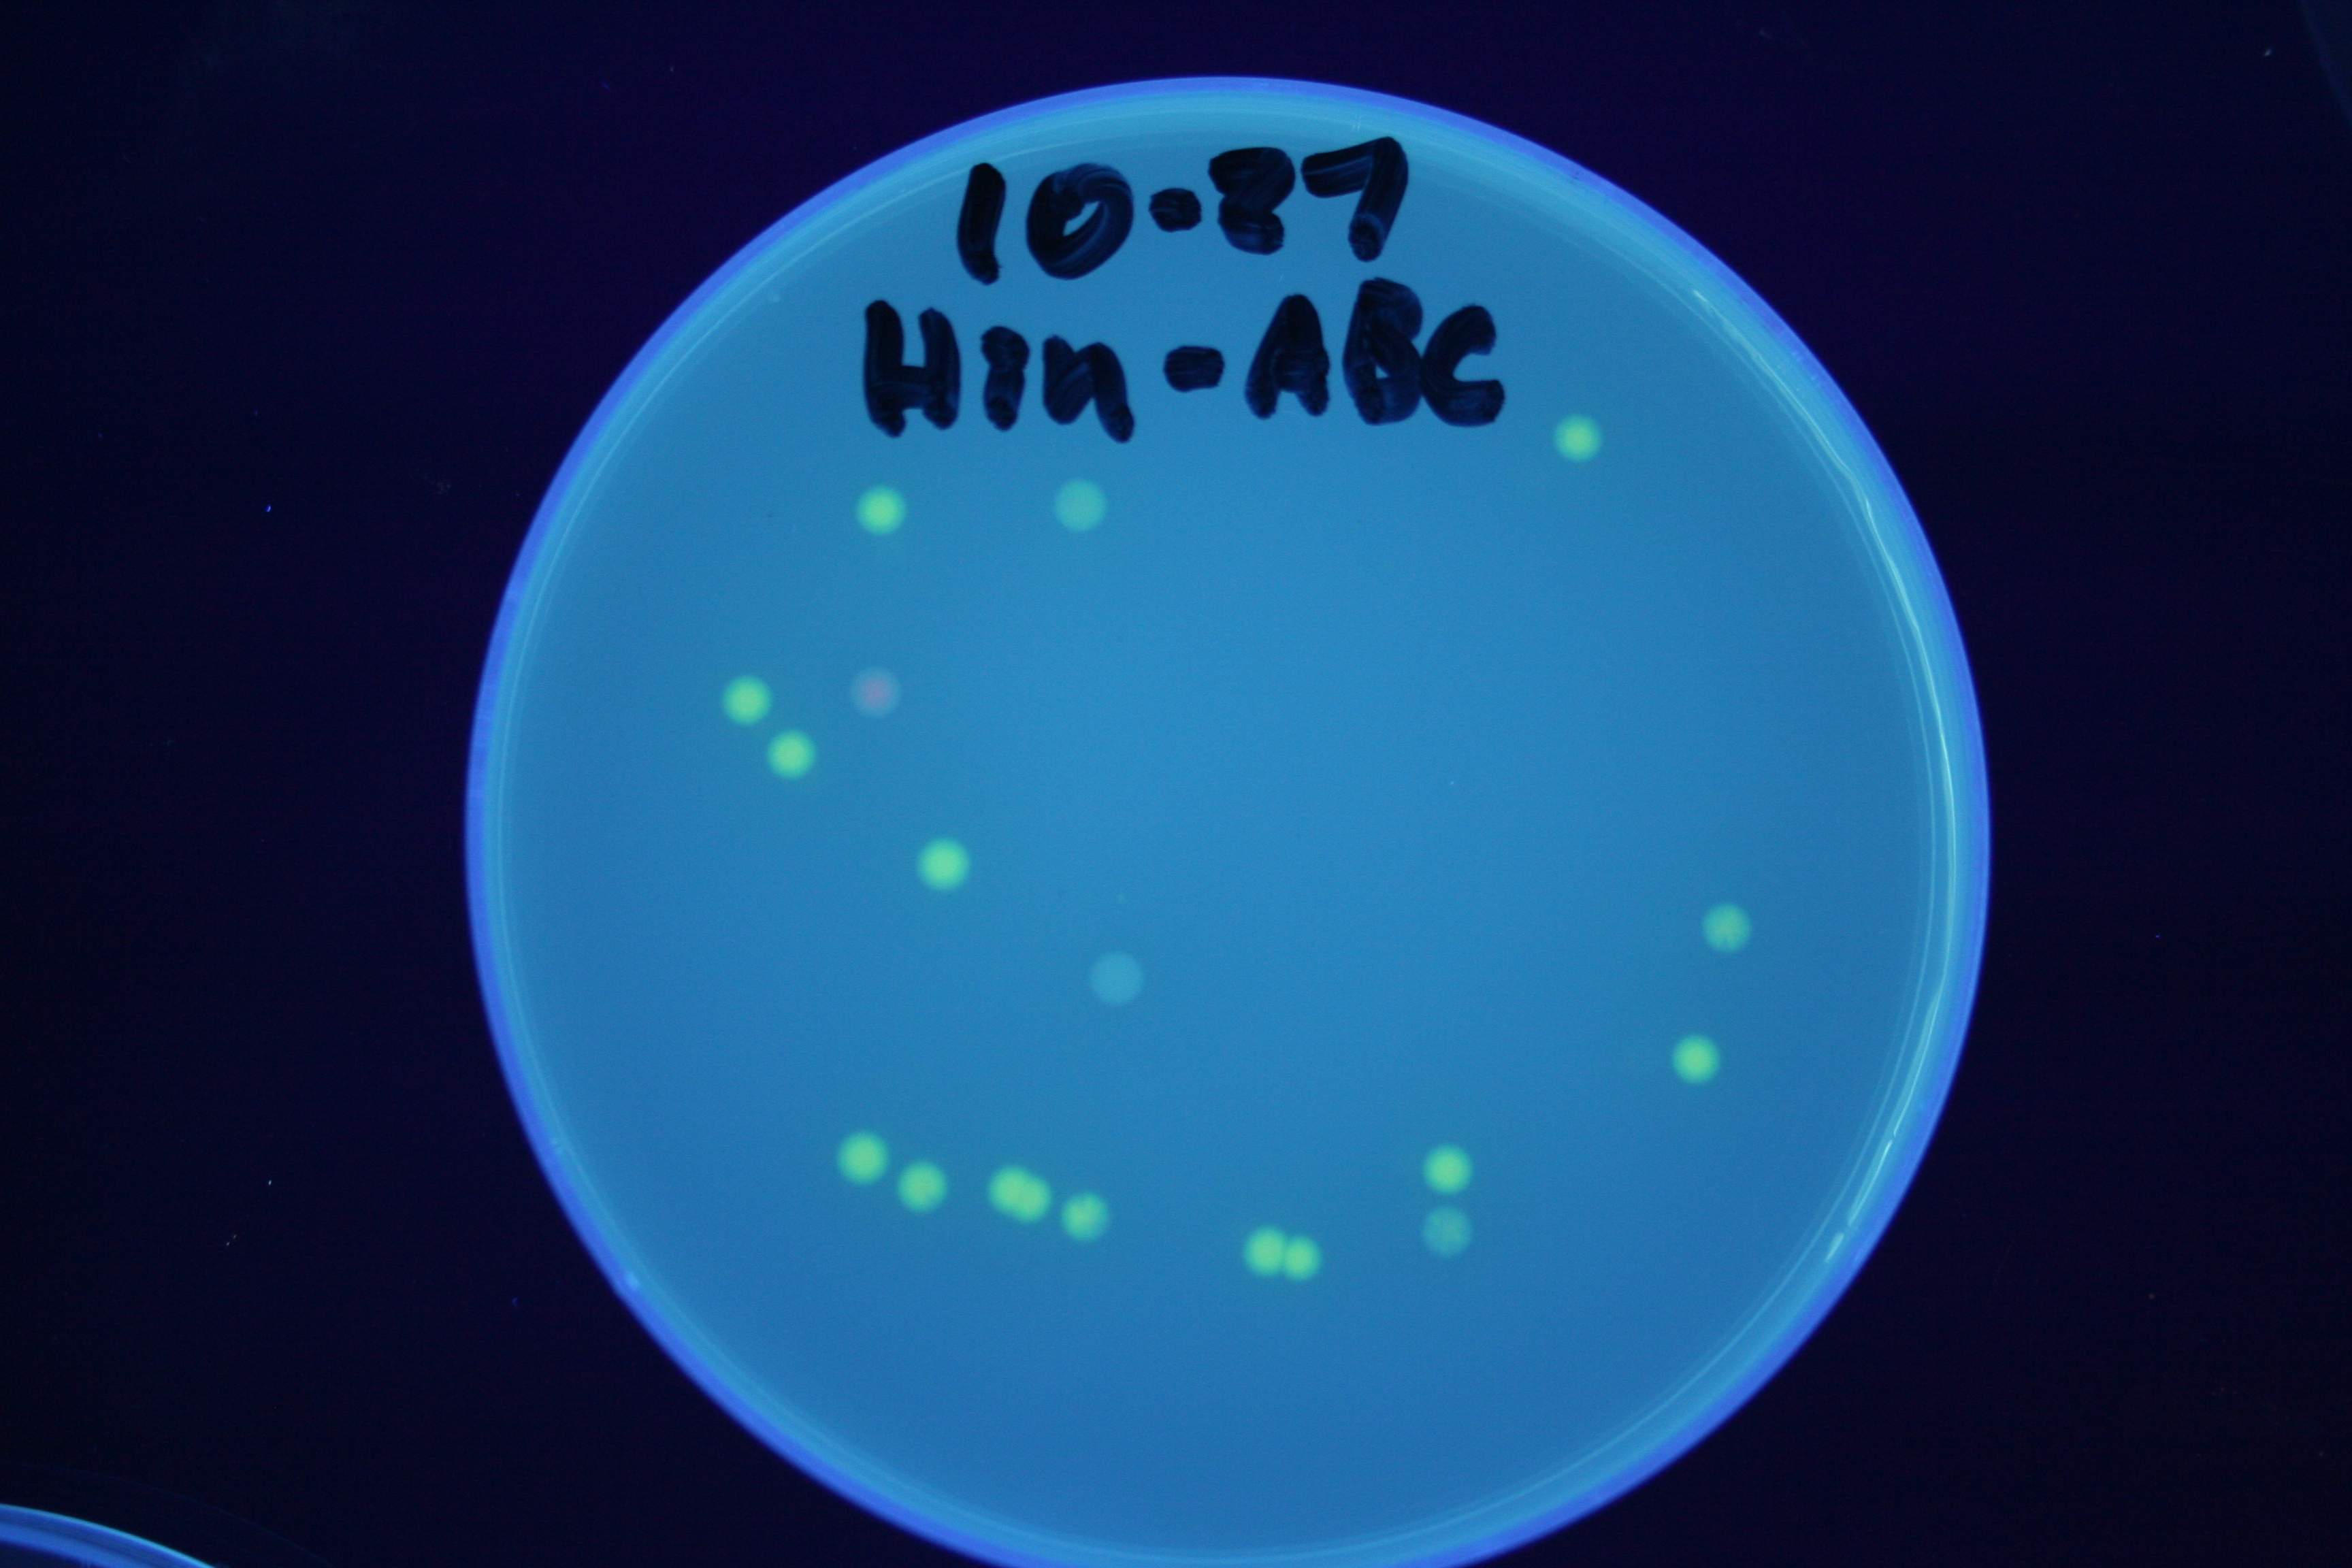
To test for flipping by phenotype, we used our 3 - Graph A constructs from above, HPP-A0, HPP-A1, HPP-A2. As expected, unflipped HPP-A0 fluoresced yellow, unflipped HPP-A1 fluoresced red, and unflipped HPP-A2 demonstrated no fluorescence when transformed into the T7 RNAP cells (See Figures 5-7 below).
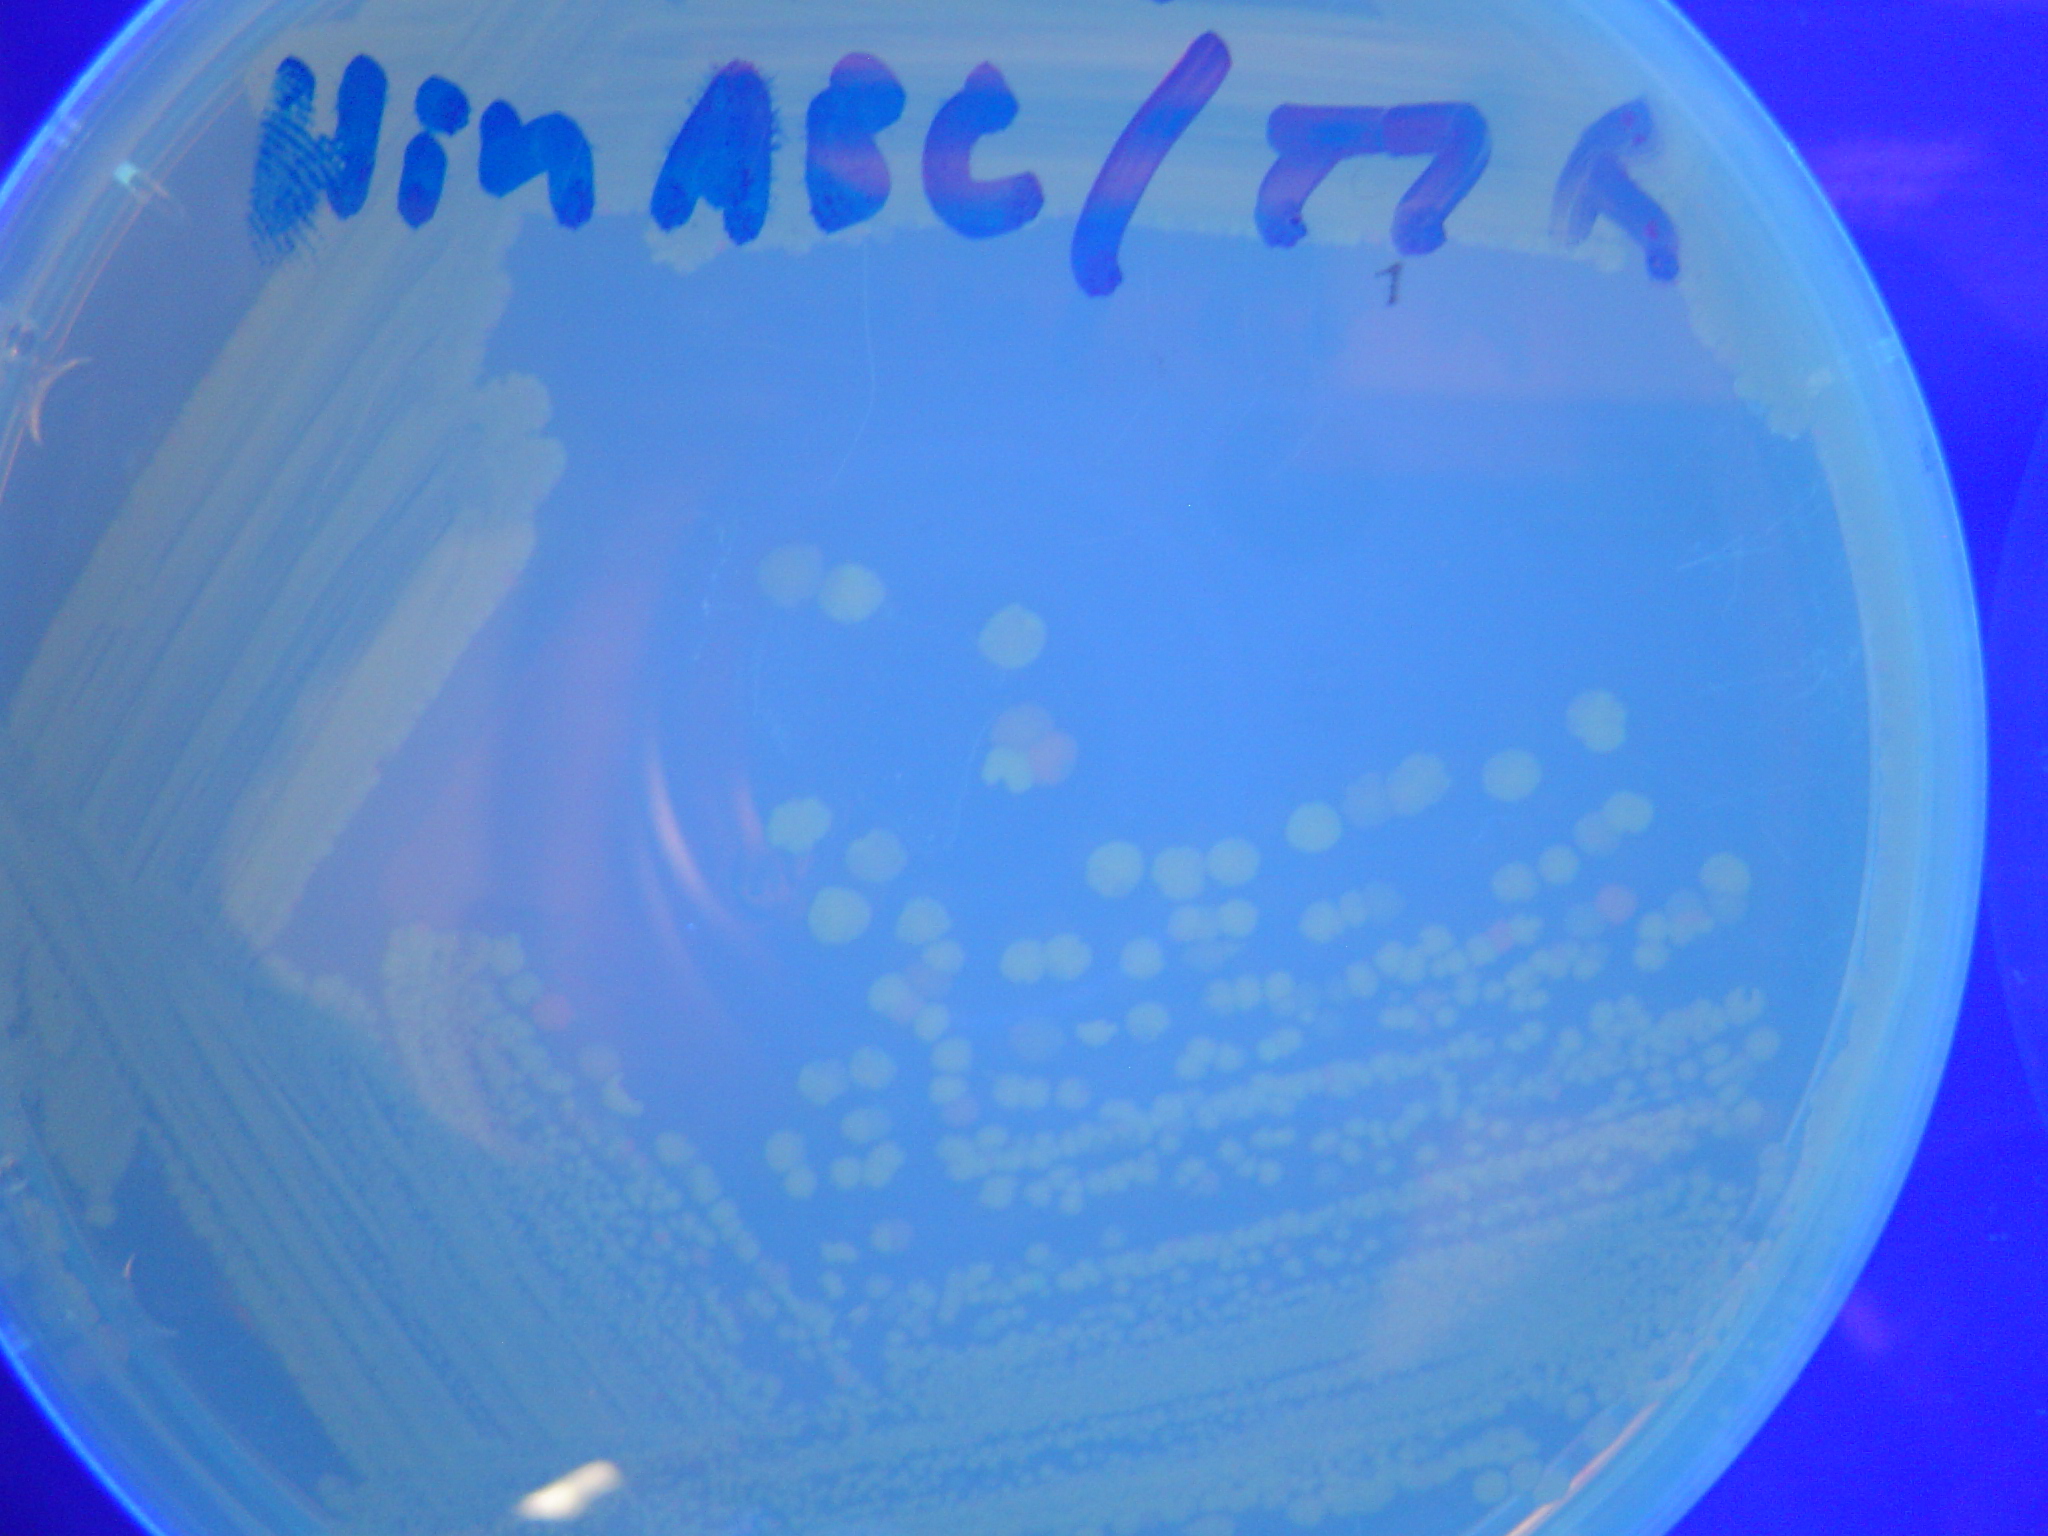
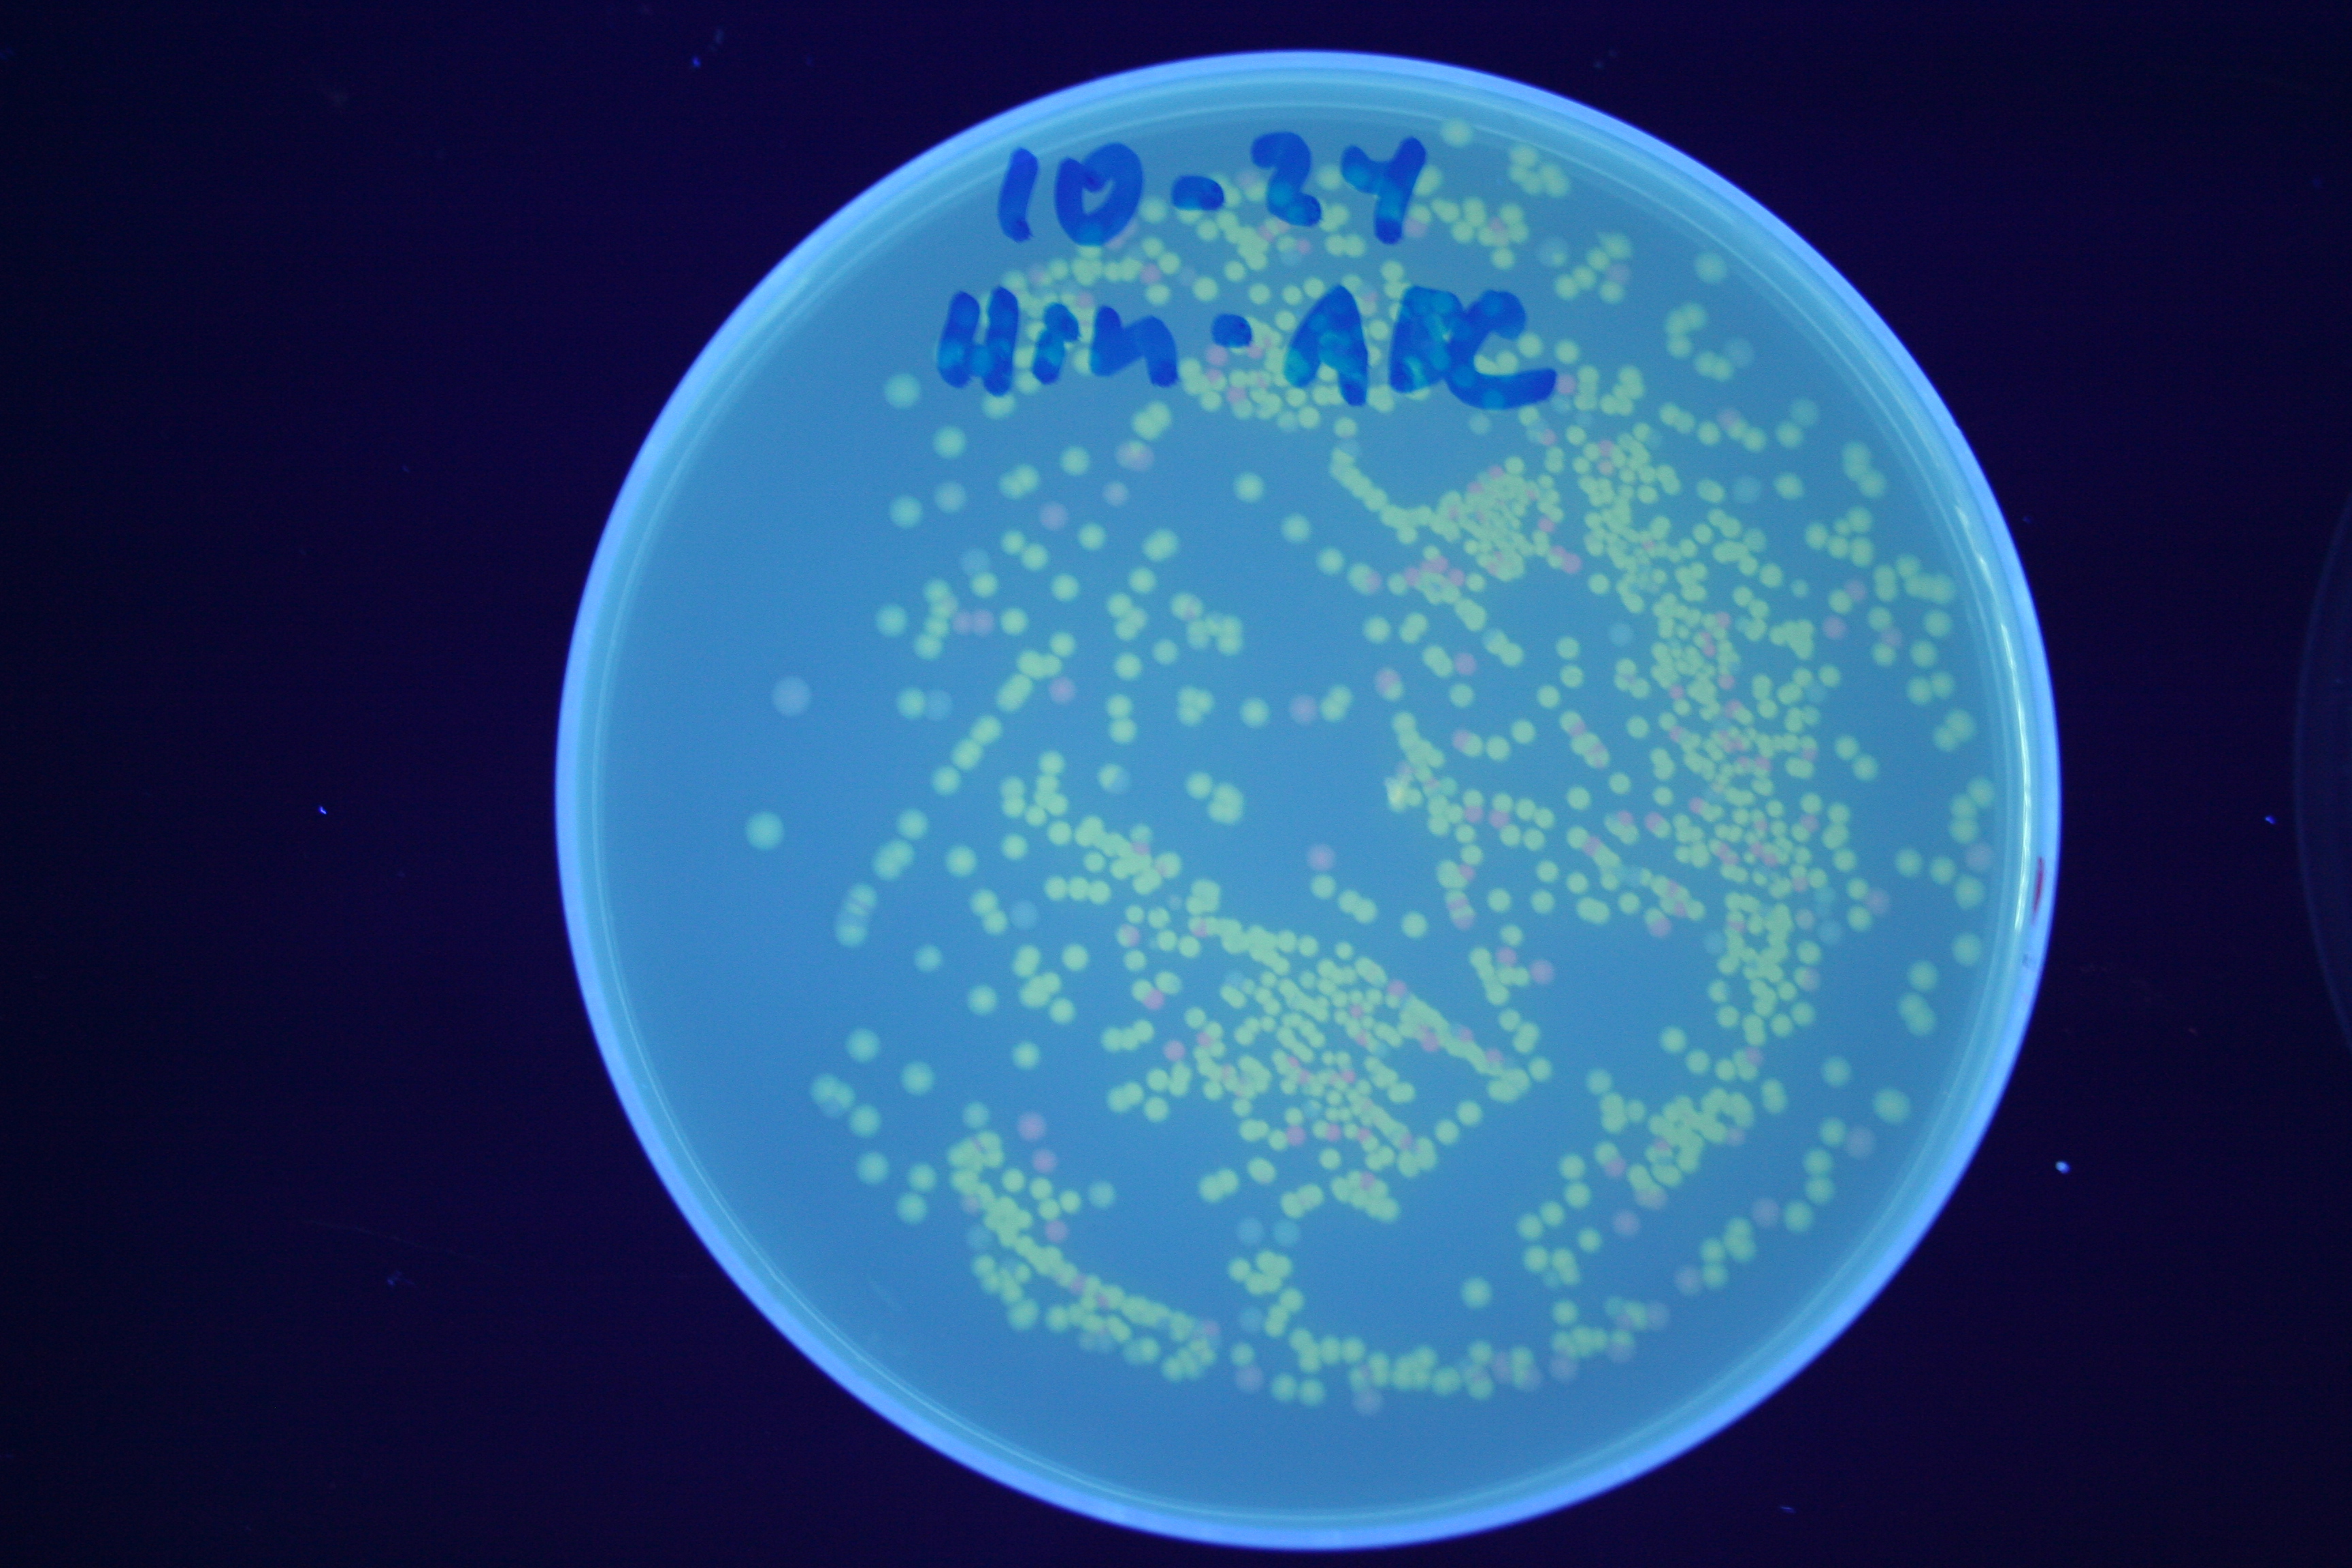
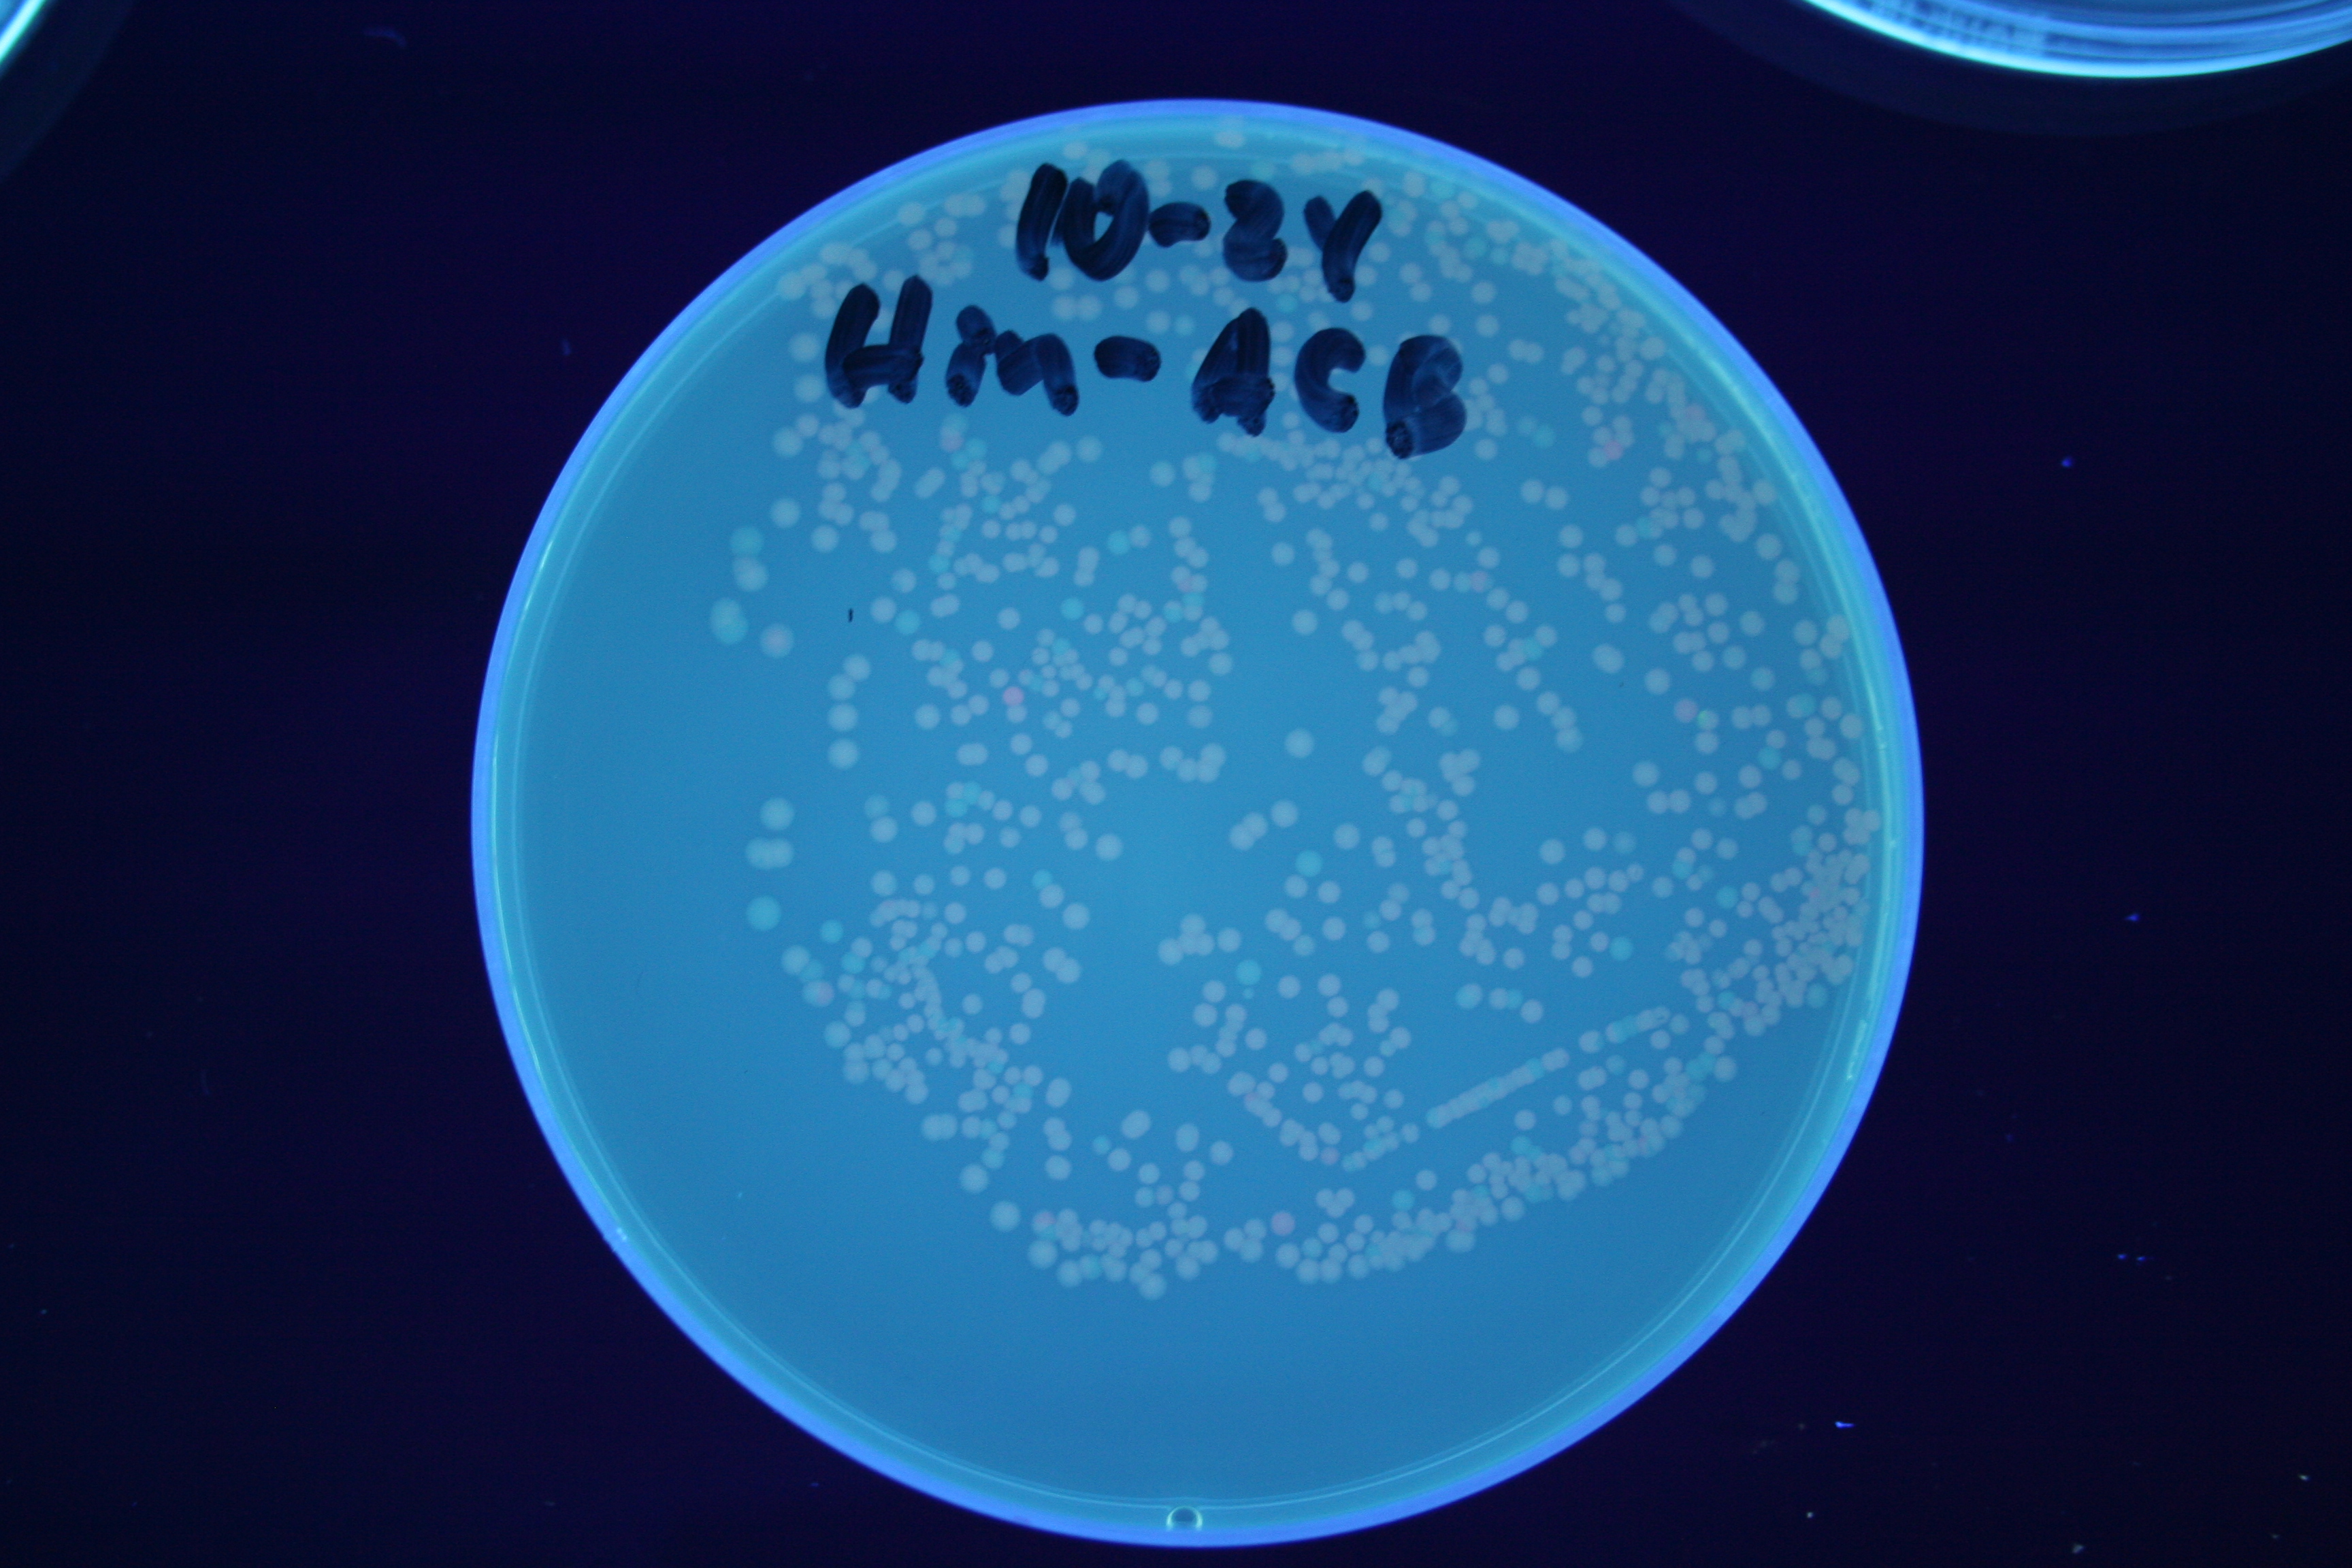
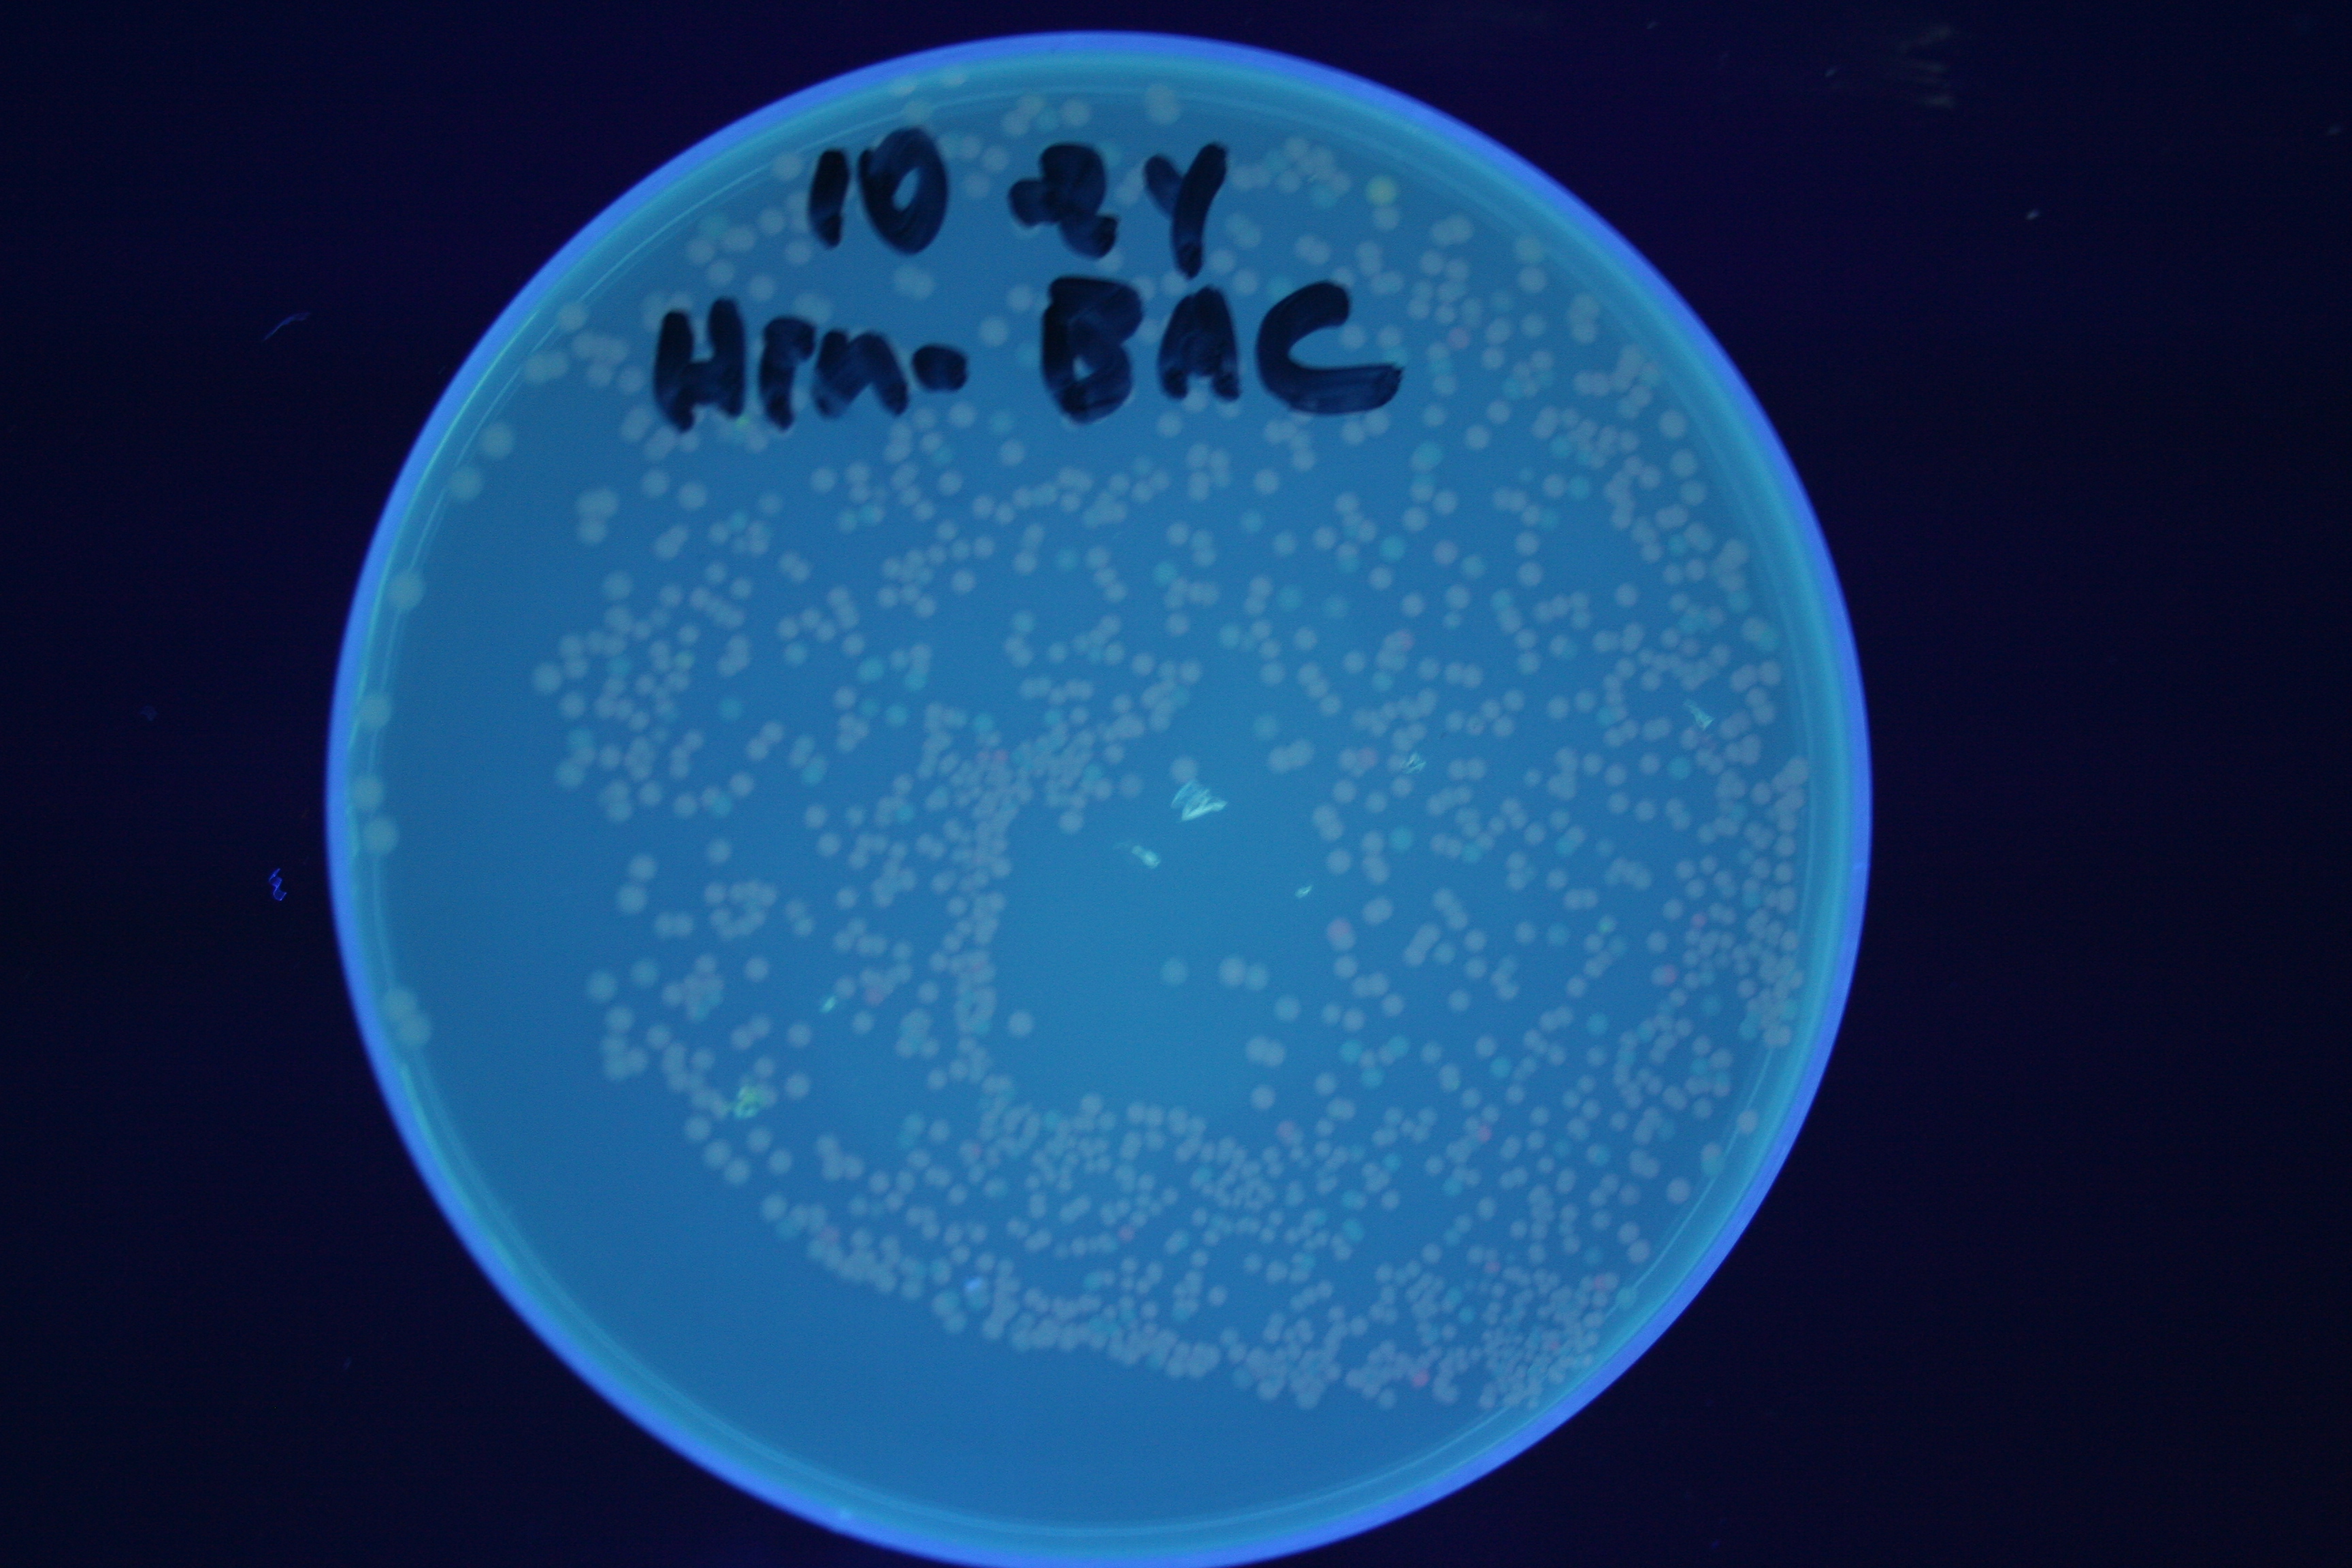
A fragment containing the Hin expression cassette (pLac-RBS-Hin-LVA, [http://partsregistry.org/Part:BBa_S03536 BBa_S03536]) was ligated in front of each of the 3 HPP-A constructs. These HPP-A + Hin plasmids were then transformed into T7 RNAP cells. A colony from each transformation was picked and grown overnight for plasmid mini-prep. Each of the 3 constructs was restriction digested and the insert sizes were verified to be correct. The 3 constructs were then retransformed into T7 RNAP cells, and the resulting transformation mixture was streaked for colony isolation. The HPP-A0 + Hin plate contained mostly yellow colonies but also red and green (See Figures 8 and 11). The Hin HPP-A1 + Hin plate contained red, green and yellow colonies (See Figures 9 and 12). The HPP-A2 + Hin plate contained mostly nonfluorescent colonies with a few green and red colonies (See Figures 10 and 13).
Click twice on the images below for higher resolution.
Solution Detected by PCR
In order to provide physical evidence of Hin-mediated DNA rearrangement of our HPP-A + Hin constructs, we designed PCR primers that would allow us to determine the position of the GFP2 gene half. The experiment below shows the results of PCR using the following multiplex primers: the universal reverse primer [http://partsregistry.org/Part:BBa_G00101 G00101], which binds to the 3' biobrick suffix, a forward primer that binds to RFP1, and a GFP2-forward primer.
Here is how the primers bind to the 3 HPP-A constructs:
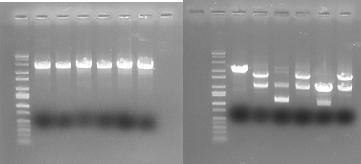
Right Gel - Lane 1 : MW marker (50, 100, 200, 300, 400, 500, 750, 1000, 1400/1550, 2000, 3000, 4000, 6000 bp), Lane 2 : unrelated digest, Lane 3 : EcoRI+PstI digest of Hin+HPP-A0, Lane 4 : unrelated digest, Lane 5 : EcoRI+PstI digest of Hin+HPP-A1, Lane 6 : unrelated digest, Lane 7 : EcoRI+PstI digest of Hin+HPP-A2
Conclusions
We were able to insert a 13 amino acid hixC site into Green Fluorescent Protein (GFP) and Red Fluorescent Protein (RFP), maintaining the functionality of the proteins and allowing for flipping of the DNA by Hin Recombinase. When both split RFP and split GFP are present in the same cell, a yellow color can be observed by eye under UV light, and both red and green fluorescence are detected by fluorimetry. We then constructed a bacterial computer capable of solving a 3-node Hamiltonian Path Problem. We detected the solution by isolating cells that fluoresced yellow (both red and green).
To test for flipping of our HPP computer constructs, we attatched a Hin-expression vector to the HPP construct and observed phenotypic differences in colonies. For all of the starting orientations, we observed colonies of varying colors, suggesting that some colonies had flipped away from their starting orientation and into a new orientation that produced a different phenotype. We also tested for flipping by PCR and were able to see multiple bands for all of our flipped constructs. These results indicate that flipping has occured in each of our HPP constructs.
In the coming days, we plan to retransform our flipped HPP plasmid (with Hin-Recombinase removed from the plasmid) into T7 RNAP cells in order to obtain clonal colonies. We will screen for yellow colonies and sequencing any plasmids to verify correct solutions to the Hamiltonian Path Problem and solved by E. coli.

