July 3
From 2007.igem.org
(→Analysis) |
(→Analysis) |
||
| Line 55: | Line 55: | ||
|[[Image:pTluxIC_0703_yfp.png|center|thumb|300px|mean YFP vs IPTG conc.]] | |[[Image:pTluxIC_0703_yfp.png|center|thumb|300px|mean YFP vs IPTG conc.]] | ||
|- | |- | ||
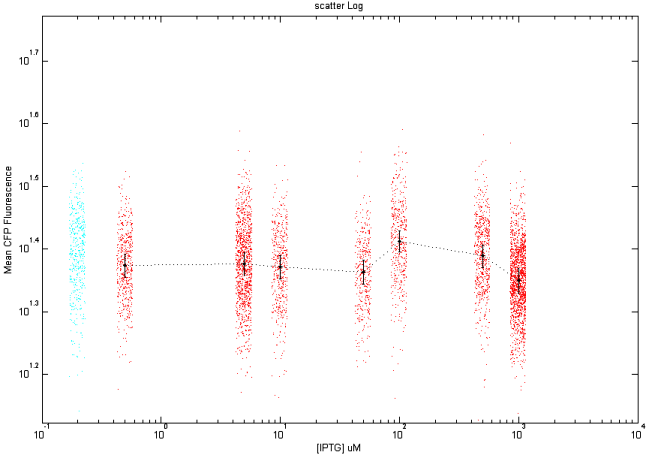
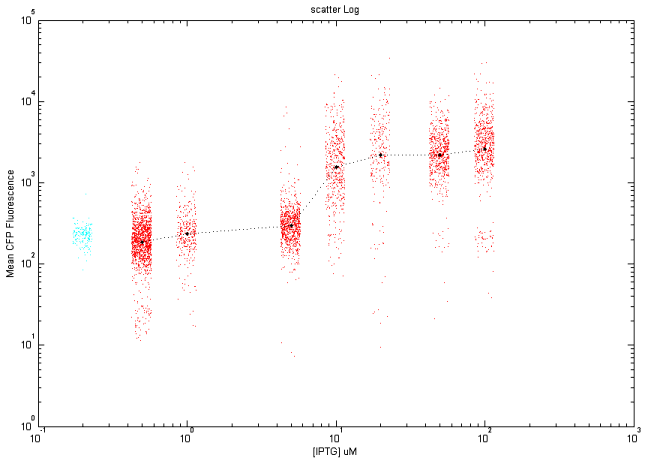
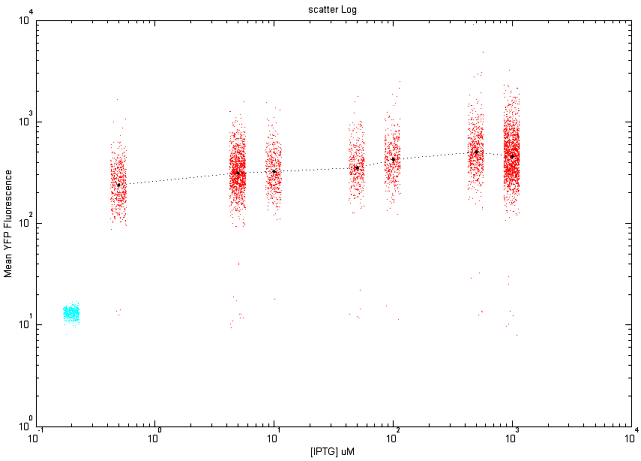
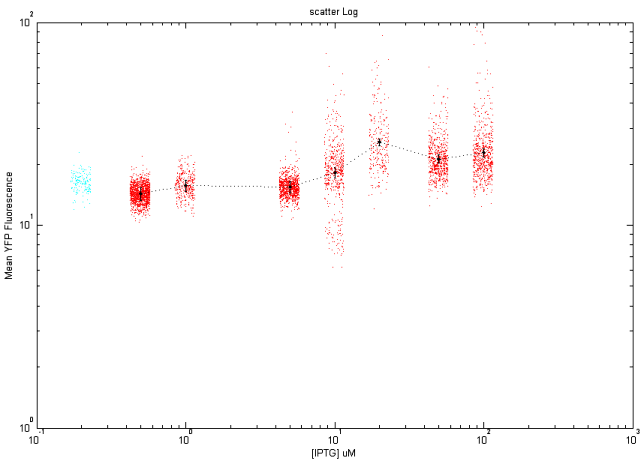
| - | |colspan="2" align="center"|<font color="Red">'''Scatter plot:'''</font> Each dot here represents the fluorescence value of an individual cell. | + | |colspan="2" align="center"|<font color="Red">'''Scatter plot:'''</font> Each dot here represents the fluorescence value of an individual cell. The Cyan dots represent the fluorescence values of wild-strain K12z1 cells. |
|} | |} | ||
== Inference == | == Inference == | ||
Revision as of 05:05, 9 July 2007
Back to Bangalore
Back to e-Notebook
Experiments
- Open loop experiment [E]
i) Cells were transferred to 50 mL Glu M9 in 250 mL flask with [aTc]=50 ng/mL and inoculum=1,0.1 uL/mL.
ii) pL.LuxR.Y.pR.C and K12Z1 were inoculated in LB.
iii) K12z1 was inoculated in Glu M9 and atc (1000)
iv) The contents of the flask with required OD (50 ng/mL) were filtered.
v) Seven dilutions for pL.LuxR.Y.pR.C were made with 50 old:50 new 2xM9 along with -ve control: K12z1
- The following -ve controls were also done :
i) pL.LuxR.Y.pR.C with K12Z1 grown medium,500 uM IPTG.
ii) pL.LuxR.Y.pR.C with new M9,500 uM IPTG.
- Open loop experiment [F]
i) Cells were transferred to 50 mL Glu M9 in 250 mL flask with [aTc]=0 ng/mL and inoculum=1,0.1 uL/mL
ii) pL.LuxR.Y.pR.C, K12Z1 and pL.YFP were inoculated in LB
iii) The contents of the flask with required OD ( ) were filtered.
Microscopy
- pT.LuxI.C imaging was done as part of the equivalence expt.
- pL.LuxR.Y imaging was done as part of the eqiuvalence expt.
Analysis
- We obtained the following scatter plots (mean log) for the equivalence curves:
| pL.luxR.YFP | pT.luxI.CFP |
|---|---|
| Scatter plot: Each dot here represents the fluorescence value of an individual cell. The Cyan dots represent the fluorescence values of wild-strain K12z1 cells. | |


