July 2
From 2007.igem.org
(Difference between revisions)
(→Experiments) |
(→Analysis) |
||
| Line 32: | Line 32: | ||
==Analysis== | ==Analysis== | ||
| + | * We obtained the following scatter plots (mean log): | ||
| - | + | {|align="center" width="75%" | |
| - | + | !align="center" colspan="2"|pL.luxI.CFP | |
| + | |- | ||
| + | |[[Image:pLluxIC_0704_cfp.png|center|thumb|300px|mean CFP vs IPTG conc.]] | ||
| + | |[[Image:pLluxIC_0704_yfp.png|center|thumb|300px|mean YFP vs IPTG conc.]] | ||
| + | |- | ||
| + | |colspan="2" align="justify"|<font color="Red">'''Scatter plot:'''</font> Each dot here represents the fluorescence value of an individual cell. | ||
| + | |} | ||
==Discussions== | ==Discussions== | ||
Latest revision as of 05:12, 9 July 2007
Back to Bangalore
Back to e-Notebook
Experiments
- pT.LuxI.C and K12Z1 inoculated for equivalence expt to be done on July 3.
- pL.LuxR.Y and K12Z1 inoculated along with pL.Y(+ve control) for equivalence expt to be done on July 4.
- Dilutions of pT.LuxI.C made in aTc conc viz. 0,1,5,10,20,50,100 ng/mL and K12Z1 in aTc conc viz. 10,50 ng/mL for 2 inoculum volumes: 0.1 & 0.01 uL/mL each.
- Open loop experiments [E],[F]
i) pT.LuxI.C inoculated in L/B.
ii) The following dilutions were made :
pL.LuxR.Y in IPTG: 0,5,10,50,100,500,1000 uM
pL.Y in IPTG: 50,100 uM
K12Z1 in Glu M9.
Microscopy
- pL LuxI.C imaging done.
Analysis
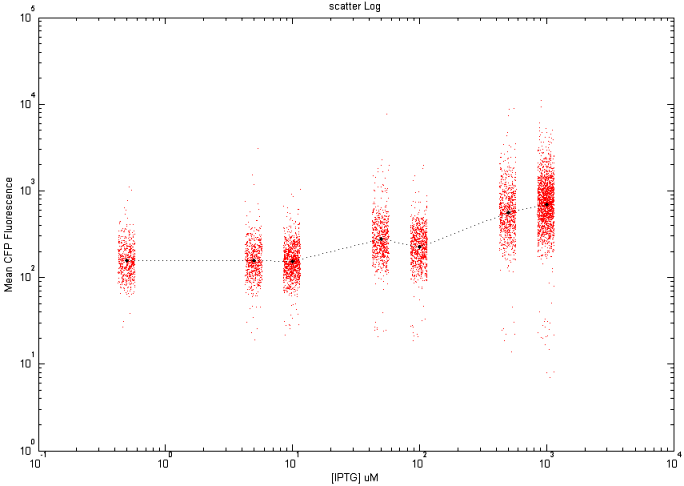
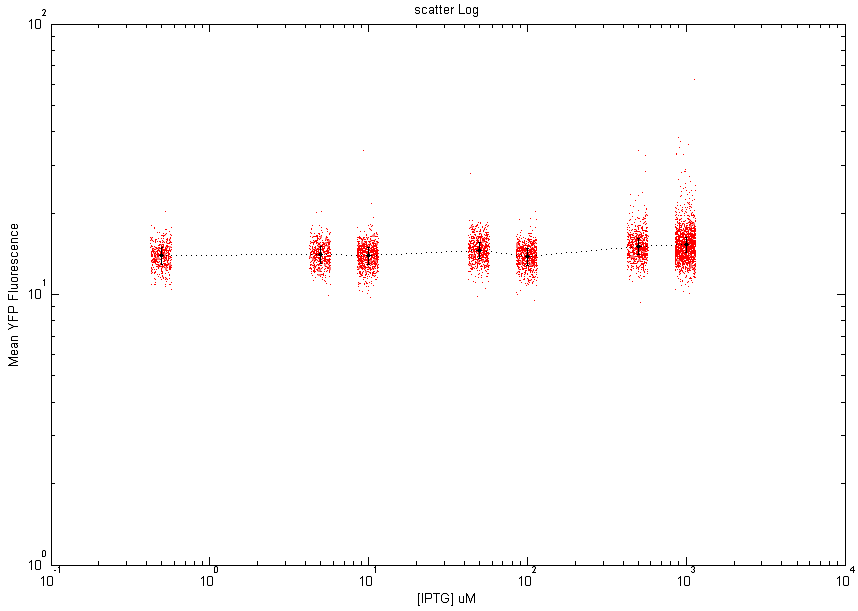
- We obtained the following scatter plots (mean log):
| pL.luxI.CFP | |
|---|---|
| Scatter plot: Each dot here represents the fluorescence value of an individual cell. | |
Discussions
It was again a meeting with people from The National Institute of Advanced Studies at 11.30am. Mukund first took up all the biological aspects like DNA and plasmids and then once again all the experiments were discussed but in quite a detail.
Moreover it was decided that instead of next Monday there would be a final meeting on Thursday, July 12 at NIAS itself and the final presentation for iGEM '07 would be held on Saturday, July 14 at NCBS.
So..start preparing!!

