July 4
From 2007.igem.org
(→Experiments) |
(→Analysis) |
||
| (14 intermediate revisions not shown) | |||
| Line 41: | Line 41: | ||
| - | * pT.LuxI.C and K12Z1 inoculated in L/B for open loop expts [ | + | * pT.LuxI.C and K12Z1 inoculated in L/B for open loop expts [Aa],[Bb]. |
| - | * To Prove scaling argument: aTc=20 ng/mL, OD=0.257 & 0.015 | + | |
| - | ** A 6: | + | * To Prove scaling argument: aTc=20 ng/mL, OD=0.257 & 0.015 (0.015/0.257=0.06) |
| + | ** A 6:100 dilution of the 1:2 diluted 0.257 sample in 2xM9, and a 1:2 dilution of 0.015 sample was made. | ||
** For each of these above AI containing media, IPTG dilutions were made for 5,50,500 uM in duplicates of inoculum (.01,.1). | ** For each of these above AI containing media, IPTG dilutions were made for 5,50,500 uM in duplicates of inoculum (.01,.1). | ||
** The argument will be proved if they show exact same CFP expression. | ** The argument will be proved if they show exact same CFP expression. | ||
| Line 54: | Line 55: | ||
* pT.LuxI.C,K12z1 of both [AA] and [FF] were Imaged on FACS and microscopy; but both K12Z1 samples had contamination. | * pT.LuxI.C,K12z1 of both [AA] and [FF] were Imaged on FACS and microscopy; but both K12Z1 samples had contamination. | ||
| + | |||
| + | |||
==Analysis== | ==Analysis== | ||
| + | |||
| + | * We obtained the following scatter plots (mean log) for the equivalence curve for open loop expt [E]: | ||
| + | |||
| + | {|align="center" width="70%" | ||
| + | |- | ||
| + | |[[Image:mean_cfp_fluorescence_vs_IPTG.jpg|thumb|300px|mean CFP vs IPTG conc]] | ||
| + | |[[Image:mean yfp fluorescence vs IPTG conc.jpg|thumb|300px|mean YFP vs IPTG conc]] | ||
| + | |- | ||
| + | |colspan="2" align="justify"|<font color="Red">'''Scatter plot:'''</font> Each dot here represents the fluorescence value of an individual cell. The <font color="Cyan">'''Cyan'''</font> dots represent fluorescence values of wild-strain K12Z1 cells (autofluorescence). | ||
| + | |} | ||
Latest revision as of 05:20, 9 July 2007
Back to Bangalore
Back to e-Notebook
Experiments
- Open Loop experiment [AA]
i) pT.luxI.C was transferred to 50 mL Glu M9 in 250 mL flask with 20 ng/mL of [aTc] and 1 and 0.1 uL/mL of inoculum
ii) K12z1 was inoculated in 5 mL Glu M9 in 50 mL tube with 20 ng/mL of [aTc] and 1 and 0.1 uL/mL of inoculum.
iii) pL.LuxR.Y.pR.C, K12Z1 and pL.Y were Inoculated in LB
iv) The flask with OD=0.263 was filtered and stored at 4 degrees
v) K12Z1 strains in aTc(20,0 ng/mL) were filtered at OD ~0.2 and stored at 4 degrees.
vi) 7 dilutions for pL.LuxR.Y.pR.C were made in 30 mL AI medium:30 mL new 2xM9 [x2 inoculum=.1,.01]
vii) The following negative controls were done:
- K12z1(20 ng/mL aTc)
- pL.LuxR.Y.pR.C in 3 mL K12Z1 grown medium:3 mL new 2xM9,500 uM IPTG. However M9 turned out to be contaminated.
- pL.LuxR.Y.pR.C in new M9,500 uM IPTG [x2 inoculum=.1,.01]
viii) The following positive control was done: pL.Y in new M9 induced with IPTG: 100 uM.
- Open Loop experiment [FF]
i) pT.luxI.C was transferred to 50 mL Glu M9 in 250 mL flask with [aTc]=0 ng/mL and 1,0.1 uL/mL of inoculum.
ii) K12z1 was inoculated in 5 mL Glu M9 in 50 mL tube with [aTc]=0 ng/mL and inoculum=1,0.1 uL/mL.
iii) pL.LuxR.Y.pR.C, K12z1 and pL.Y were inoculated in LB
iv) Flask with OD=0.257 was filtered and stored at 4 degrees
v) 7 dilutions were made for pL.LuxR.Y.pR.C 30 mL AI medium:30 mL new 2xM9 [x2 inoculum=.1,.01] along with the negative control with K12z1.
- pT.LuxI.C and K12Z1 inoculated in L/B for open loop expts [Aa],[Bb].
- To Prove scaling argument: aTc=20 ng/mL, OD=0.257 & 0.015 (0.015/0.257=0.06)
- A 6:100 dilution of the 1:2 diluted 0.257 sample in 2xM9, and a 1:2 dilution of 0.015 sample was made.
- For each of these above AI containing media, IPTG dilutions were made for 5,50,500 uM in duplicates of inoculum (.01,.1).
- The argument will be proved if they show exact same CFP expression.
Microscopy
- Open loop samples [E] were imaged.
- pT.LuxI.C,K12z1 of both [AA] and [FF] were Imaged on FACS and microscopy; but both K12Z1 samples had contamination.
Analysis
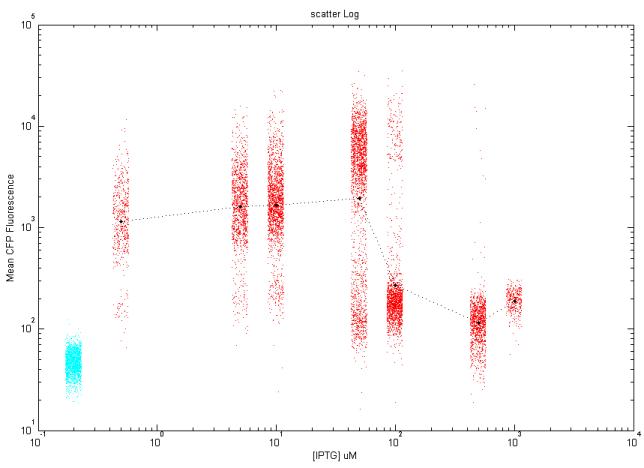
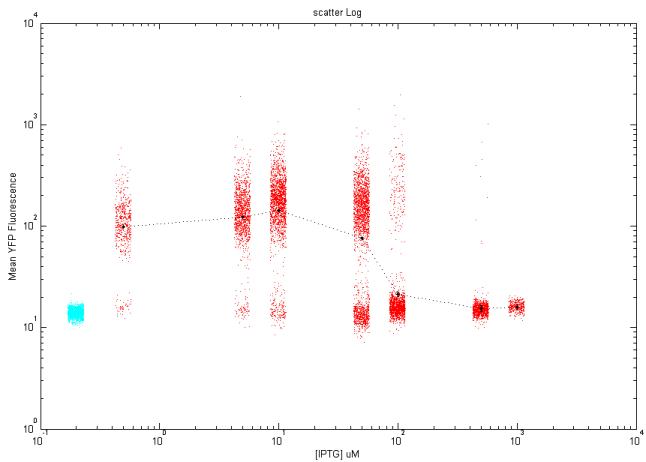
- We obtained the following scatter plots (mean log) for the equivalence curve for open loop expt [E]:
| Scatter plot: Each dot here represents the fluorescence value of an individual cell. The Cyan dots represent fluorescence values of wild-strain K12Z1 cells (autofluorescence). | |

