Valencia/Controller
From 2007.igem.org
| (8 intermediate revisions not shown) | |||
| Line 1: | Line 1: | ||
| - | + | {{Valencia/Cabecera}} | |
| - | { | + | |
| - | + | ||
| - | { | + | |
| - | + | ||
| - | + | ||
| - | + | ||
| - | + | ||
| - | + | ||
| - | + | ||
| - | + | ||
| - | + | ||
| - | + | ||
| - | + | ||
| - | + | ||
| - | + | ||
==An alternative use of our comparator: The P controller== | ==An alternative use of our comparator: The P controller== | ||
| - | As it is explained in [[Valencia/The idea| the idea]] section, a possible application of the comparator could be to couple two of these devices to build a controller that controls the concentration of certain substance in order to maintain it between certain values. | + | As it is explained in [[Valencia/The idea| the idea]] section, a possible application of the comparator could be to couple two of these devices to build a controller that controls the concentration of a certain substance in order to maintain it between certain threshold values. |
===Electronic Proportional Controller=== | ===Electronic Proportional Controller=== | ||
| - | The controller which we are going to describe is very similar to the what is call in engineering | + | The controller which we are going to describe is very similar to the what is call in engineering a proportional controler. Therefore, it could be suitable to give first a brief introduction to this device in the context of electronics. |
| - | These controllers are characterized by the fact that they have a proportional response to the error value of the controlled magnitud.The proportional response can be adjusted by multiplying the error by a constant Kp, called the proportional gain. A typical response of this devices is shown in the following figure: | + | These controllers are characterized by the fact that they have a proportional response to the error value of the controlled magnitud. The proportional response can be adjusted by multiplying the error by a constant Kp, called the proportional gain. A typical response of this devices is shown in the following figure: |
| + | <center> | ||
| + | [[Image:VControlador proporcional.jpg]] | ||
| - | [ | + | an example of a proportional controller can be seen at Wikipedia's [http://en.wikipedia.org/wiki/PID_controller PID controller entry]. |
| + | </center> | ||
A high proportional gain results in a large change in the output for a given change in the error. If the proportional gain is too high, the system can become unstable (See the section on Loop Tuning). In contrast, a small gain results in a small output response to a large input error, and a less responsive (or sensitive) controller. If the proportional gain is too low, the control action may be too small when responding to system disturbances. | A high proportional gain results in a large change in the output for a given change in the error. If the proportional gain is too high, the system can become unstable (See the section on Loop Tuning). In contrast, a small gain results in a small output response to a large input error, and a less responsive (or sensitive) controller. If the proportional gain is too low, the control action may be too small when responding to system disturbances. | ||
| - | Moreover, from that figure we can see an importat characteristic of these systems: | + | Moreover, from that figure we can see an importat characteristic of these systems: in the absence of disturbances a purely proportional control will not settle at its target value, but will retain a steady state error that is a function of the proportional gain and the process gain. Depending on the control accuracy desired either we can avoid to consider this error or we should complement this device with another devices which complement it. This devices could be an integer controller, in that case we have a PI controller or also a derivative controller and we obtain a PID controller quite extended in automatic systems. |
===Biological Proportional Controller=== | ===Biological Proportional Controller=== | ||
| Line 45: | Line 33: | ||
| - | par={αx=20,αy=20,αz=20,αv=20,αu=20,α2=20,n1=2,ny=2,n2=2,nx=2,n3=2,nu=2,nv=2,nz=2,k1=40,ky=40,k2=40,kx=40,k3=40,ku=40,kv=40,kz=40,βx=0.069,βy=0.069,βz=0.069 10-3,βv=0.069,βu=0.069,β2=0.069 10-3,β1=0.069 10-5,β3=0.069 10-5,γx=0.01,γy=0.01,γz=0.01,γv=0.01,γu=0.01,γp2=0.000001,x(0)=0,y(0)=0,z(0)=0,v(0)=0,u(0)=0,p2(0)=3,p1(0)=5,p3(0)=1}; | + | par={αx=20,αy=20,αz=20,αv=20,αu=20,α2=20,n1=2,ny=2,n2=2,nx=2,n3=2,nu=2,nv=2,nz=2,k1=40,ky=40,k2=40,kx=40,k3=40,ku=40,kv=40,kz=40, |
| + | βx=0.069,βy=0.069,βz=0.069 10-3,βv=0.069,βu=0.069,β2=0.069 10-3,β1=0.069 10-5,β3=0.069 10-5,γx=0.01,γy=0.01,γz=0.01,γv=0.01,γu=0.01, | ||
| + | γp2=0.000001,x(0)=0,y(0)=0,z(0)=0,v(0)=0,u(0)=0,p2(0)=3,p1(0)=5,p3(0)=1}; | ||
| Line 51: | Line 41: | ||
| - | [[Image: | + | [[Image:VLalala copia.jpg|500 px]] |
In this figure we can appreciate the typical behaviour of a P-Controller with the associated steady state error. Depending on the desired precision in the control of the variable, this controller could be enough or we need to add another device which performs the integer operation of a PI-controller. | In this figure we can appreciate the typical behaviour of a P-Controller with the associated steady state error. Depending on the desired precision in the control of the variable, this controller could be enough or we need to add another device which performs the integer operation of a PI-controller. | ||
| Line 80: | Line 70: | ||
Some representative results can be seen in the following figures: | Some representative results can be seen in the following figures: | ||
{| | {| | ||
| - | |[[Image:V1-controller.jpg|thumb|left| | + | |[[Image:V1-controller.jpg|thumb|left|900 px|Change of initial concentrations of (x,y), (u,v) and (x,y,u,v) ]] |
|- | |- | ||
| - | |[[Image:V2-controller.jpg|thumb|left| | + | |[[Image:V2-controller.jpg|thumb|left|900 px|Study of the z basal state dependency of the system. a) z~0 b) z>> basal state of x, y, u and v c) z ~ basal state of x, y, u and v ]] |
|- | |- | ||
| - | |[[Image:V3-controller.jpg|thumb|left| | + | |[[Image:V3-controller.jpg|thumb|left|900 px|Study of the p2 basal state. a) p2*100 b) p2*1000 c) p2*10000 ]] |
|- | |- | ||
| - | |[[Image:V4-controller.jpg|thumb|left| | + | |[[Image:V4-controller.jpg|thumb|left|900 px|A progressive reduction of the degradation constant of x shows the behaviour observed in the first two figs, the reduction of the degradation constant of y is show the last one ]] |
|- | |- | ||
| - | |[[Image:V5-controller.jpg|thumb|center| | + | |[[Image:V5-controller.jpg|thumb|center|900 px|A progressive reduction of the degradation constant of u shows the behaviour observed in the first two figs, the reduction of the degradation constant of v is show the last one]] |
|- | |- | ||
|[[Image:V6-controller.jpg|thumb|left|700 px|Z degradation constant dependency study: a) 10 times higher b) 100 times higher | |[[Image:V6-controller.jpg|thumb|left|700 px|Z degradation constant dependency study: a) 10 times higher b) 100 times higher | ||
| Line 106: | Line 96: | ||
The simulations of that system can be found in the mathematica file: | The simulations of that system can be found in the mathematica file: | ||
[http://www.igem.upv.es/igem07/images/3/37/Stabilizator.rar Mathematica model file] | [http://www.igem.upv.es/igem07/images/3/37/Stabilizator.rar Mathematica model file] | ||
| + | |||
| + | ===Conclusions=== | ||
The most important conclusions of that work were: | The most important conclusions of that work were: | ||
| Line 112: | Line 104: | ||
*The Z basal state reduce under the consigned levels the concentration of the controlled magnitude (p2) | *The Z basal state reduce under the consigned levels the concentration of the controlled magnitude (p2) | ||
| - | * The basal concentration of p2 should be in the same range as the basal concentration of the controllers because if we increase it too much the controller does not work | + | *The basal concentration of p2 should be in the same range as the basal concentration of the controllers because if we increase it too much the controller does not work |
*The basal state of x,y,u and v do not have any influence in the final controller result | *The basal state of x,y,u and v do not have any influence in the final controller result | ||
| - | * The degradation constant of x and u reduces significantly the efficiency of the controller, but the degradation constants of y and v do not have any influence on the system | + | *The degradation constant of x and u reduces significantly the efficiency of the controller, but the degradation constants of y and v do not have any influence on the system |
*If the degradation constant of z increases the system lose its hability to operate as a controller | *If the degradation constant of z increases the system lose its hability to operate as a controller | ||
| Line 125: | Line 117: | ||
| - | It's a pity that it is not so easy to manipulate the value of the different parameter of a biological system (like the strenght of a promoter) than to manipulate the parameters of an electronic device :-( !! | + | '''It's a pity that it is not so easy to manipulate the value of the different parameter of a biological system (like the strenght of a promoter) than to manipulate the parameters of an electronic device :-( !!''' |
Nevertheless, this theoretical development constitutes a very good example of how modelling could be combined with biology in order to implement a system. | Nevertheless, this theoretical development constitutes a very good example of how modelling could be combined with biology in order to implement a system. | ||
| - | Regarding the stability of the system, developing a similar study to the one developed for the promoter calibrator, we see that the local lyapunov coefficients are also lower than 0, therefore this system is also stable as it can be expected from the previous figures. | + | Further note: Regarding the stability of the system, developing a similar study to the one developed for the promoter calibrator, we see that the local lyapunov coefficients are also lower than 0, therefore this system is also stable as it can be expected from the previous figures. |
Latest revision as of 15:23, 26 October 2007

|
|
Contents |
An alternative use of our comparator: The P controller
As it is explained in the idea section, a possible application of the comparator could be to couple two of these devices to build a controller that controls the concentration of a certain substance in order to maintain it between certain threshold values.
Electronic Proportional Controller
The controller which we are going to describe is very similar to the what is call in engineering a proportional controler. Therefore, it could be suitable to give first a brief introduction to this device in the context of electronics.
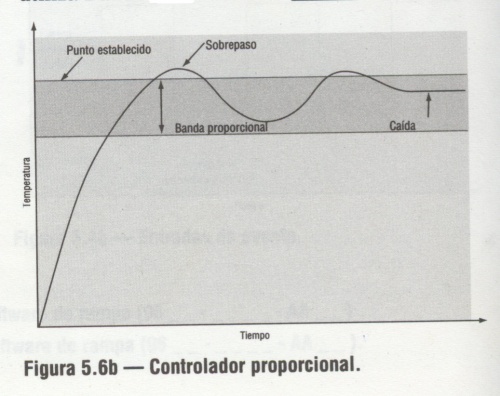
These controllers are characterized by the fact that they have a proportional response to the error value of the controlled magnitud. The proportional response can be adjusted by multiplying the error by a constant Kp, called the proportional gain. A typical response of this devices is shown in the following figure:
an example of a proportional controller can be seen at Wikipedia's [http://en.wikipedia.org/wiki/PID_controller PID controller entry].
A high proportional gain results in a large change in the output for a given change in the error. If the proportional gain is too high, the system can become unstable (See the section on Loop Tuning). In contrast, a small gain results in a small output response to a large input error, and a less responsive (or sensitive) controller. If the proportional gain is too low, the control action may be too small when responding to system disturbances.
Moreover, from that figure we can see an importat characteristic of these systems: in the absence of disturbances a purely proportional control will not settle at its target value, but will retain a steady state error that is a function of the proportional gain and the process gain. Depending on the control accuracy desired either we can avoid to consider this error or we should complement this device with another devices which complement it. This devices could be an integer controller, in that case we have a PI controller or also a derivative controller and we obtain a PID controller quite extended in automatic systems.
Biological Proportional Controller
To build this device we should couple two comparators with the proper promoters (by proper we mean, properly calibrated to produce an action at certain level) in such a way that if the concentration is higher or lower than the reference value they activate the required metabolic circuits to reduce or increase the amount of the controlled protein. A basic scheme of the P-Controller is shown in the following figure:
According to the explanation of the last sections, the system of equations which describe that system should be:
Solving this system of equations with the following parameters value:
par={αx=20,αy=20,αz=20,αv=20,αu=20,α2=20,n1=2,ny=2,n2=2,nx=2,n3=2,nu=2,nv=2,nz=2,k1=40,ky=40,k2=40,kx=40,k3=40,ku=40,kv=40,kz=40,
βx=0.069,βy=0.069,βz=0.069 10-3,βv=0.069,βu=0.069,β2=0.069 10-3,β1=0.069 10-5,β3=0.069 10-5,γx=0.01,γy=0.01,γz=0.01,γv=0.01,γu=0.01,
γp2=0.000001,x(0)=0,y(0)=0,z(0)=0,v(0)=0,u(0)=0,p2(0)=3,p1(0)=5,p3(0)=1};
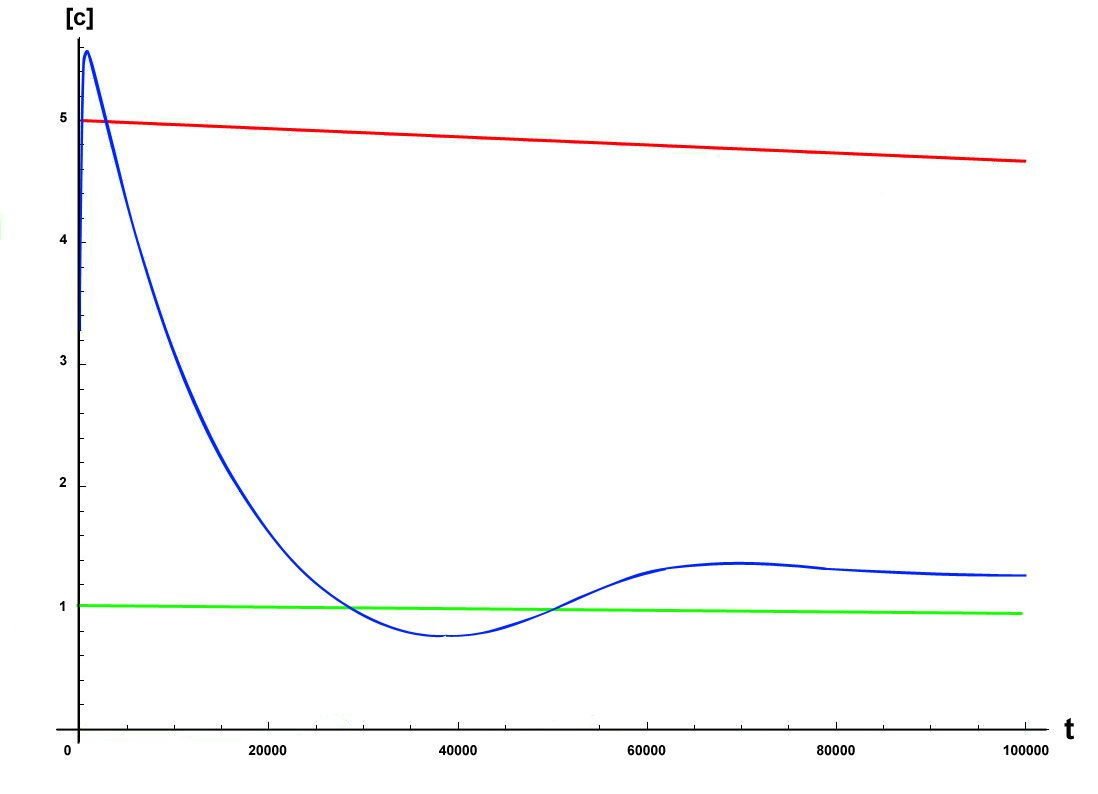
Where the parameters values were selected according the ones given by ref[1], and performing the simulation for t=100000.We observe the system behaviour shown in the following figure
In this figure we can appreciate the typical behaviour of a P-Controller with the associated steady state error. Depending on the desired precision in the control of the variable, this controller could be enough or we need to add another device which performs the integer operation of a PI-controller.
Sensibility of the system to the different parameters
Later on we are going to describe the sensibility of the device to different parameters of the model in order to understand in more detail the capabilities of the system and in which conditions could operate:
In this analysis, the dependence of the system with the following parameters was studied:
- Initial concentrations of “x”, “y”, “u”, “v”
- Basal constants of those variables
- Basal constant of “z”.
- Basal constant of “p2”.
- Degradation constants of “x”, “y”, “u”, “v”
- Degradation constant of “z”
- Degradation constant of “p2”
- Degradation constants of “p1” and “p3”
Some representative results can be seen in the following figures:
The simulations of that system can be found in the mathematica file:
[http://www.igem.upv.es/igem07/images/3/37/Stabilizator.rar Mathematica model file]
Conclusions
The most important conclusions of that work were:
- The initial concentrations of x,y,u and v do not have too much influence in the results
- The Z basal state reduce under the consigned levels the concentration of the controlled magnitude (p2)
- The basal concentration of p2 should be in the same range as the basal concentration of the controllers because if we increase it too much the controller does not work
- The basal state of x,y,u and v do not have any influence in the final controller result
- The degradation constant of x and u reduces significantly the efficiency of the controller, but the degradation constants of y and v do not have any influence on the system
- If the degradation constant of z increases the system lose its hability to operate as a controller
- If the controlled variable (p2) suffers a too large or too small degradation the controller do not work
- Although p1 and p3 becomes degradated the system works
It's a pity that it is not so easy to manipulate the value of the different parameter of a biological system (like the strenght of a promoter) than to manipulate the parameters of an electronic device :-( !!
Nevertheless, this theoretical development constitutes a very good example of how modelling could be combined with biology in order to implement a system.
Further note: Regarding the stability of the system, developing a similar study to the one developed for the promoter calibrator, we see that the local lyapunov coefficients are also lower than 0, therefore this system is also stable as it can be expected from the previous figures.


