Imperial/Infector Detector/Modelling
From 2007.igem.org
(→Representative Model) |
m |
||
| (139 intermediate revisions not shown) | |||
| Line 1: | Line 1: | ||
{{Template:IC07navmenu}} | {{Template:IC07navmenu}} | ||
| + | <br clear="all"> | ||
<html> | <html> | ||
<link rel="stylesheet" href="/igem07/index.php?title=User:Dirkvs/Stylesheets/IC07persist.css&action=raw&ctype=text/css" type="text/css" /> | <link rel="stylesheet" href="/igem07/index.php?title=User:Dirkvs/Stylesheets/IC07persist.css&action=raw&ctype=text/css" type="text/css" /> | ||
| Line 12: | Line 13: | ||
<li><a href="https://2007.igem.org/Imperial/Infector_Detector/Implementation" title=""><span>Implementation</span></a></li> | <li><a href="https://2007.igem.org/Imperial/Infector_Detector/Implementation" title=""><span>Implementation</span></a></li> | ||
<li><a href="https://2007.igem.org/Imperial/Infector_Detector/Testing" title=""><span>Testing</span></a></li> | <li><a href="https://2007.igem.org/Imperial/Infector_Detector/Testing" title=""><span>Testing</span></a></li> | ||
| + | <li><a href="https://2007.igem.org/Imperial/Infector_Detector/F2620 Comparison" title=""><span>F2620</span></a></li> | ||
| + | <li><a href="https://2007.igem.org/Imperial/Infector_Detector/Conclusion" title=""><span>Conclusion</span></a></li> | ||
</ul> | </ul> | ||
</div> | </div> | ||
| - | + | <hr /> | |
<br clear="all"> | <br clear="all"> | ||
</html> | </html> | ||
__NOTOC__ | __NOTOC__ | ||
| + | = Infector Detector: Modelling = | ||
| - | == | + | ==Introduction== |
| - | Infector Detector (ID) is a simple biological detector | + | Infector Detector (ID) is a simple biological detector designed to expose the presence of a bacterial biofilm. It functions by exploiting the inherent AHL (Acetyl Homoserine Lactone) production employed by certain types of quorum-sensing bacteria, in the formation of such structures. The [[Imperial/Infector_Detector/Design| design]] phase of our project has yielded two possible system constructs. |
| - | + | ||
| - | + | ==Implementation & Reaction Network== | |
| - | + | ||
| - | + | ||
| - | + | ||
| - | + | ||
| - | + | In line with the concept of abstraction in Synthetic Biology, the correlation of the output of the proposed system constructs to their inputs, can be visualized by the following black-box illustrations of the two cases. | |
| + | It is evident that AHL is an input to both constructs; a function of the particular biofilm. Furthermore, energy and promoter concentration are included as auxillary inputs to both system constructs. LuxR, is an additional input, exclusive to construct 2, which lacks constitutive expression of LuxR by pTET.<br> | ||
| + | (this of course occuring within our cell-free chassis) | ||
| + | {|- | ||
| + | |[[Image: BB c1.png|thumb|440px|'''Figure 1''': Black-box for Construct 1]]||[[Image: BB c2.png|thumb|440px|'''Figure 2''': Black-box for Construct 2]] | ||
| + | |} | ||
| - | == | + | ====''The Reaction Network''==== |
| - | [[Image: IC07 | + | Both designs are based on the following reaction network: |
| - | [[Image: IC07 C2.png| | + | |
| + | *AHL is assumed to diffuse freely "into" the system (we are dealing with a cell-free system, which comes into direct contact with the biofilm). | ||
| + | *The target AHL molecule binds with the monomeric protein LuxR. | ||
| + | *LuxR is either constitutively produced by construct 1, or directly introduced in purified form, as part of construct 2. | ||
| + | *The binding of these two proteins yields the intermediating LuxR-AHL complex, A. We call k<sub>2</sub> and k<sub>3</sub> the kinetic constants of the forward and backward reactions respectively. | ||
| + | *The formed transcription factor activates the transcription of the pLux operon, which codes for the relevant reporter protein, GFP. Activation occurs by way of the reversible binding of this transcription factor, A, to the response sequences in the operon (k<sub>4</sub> and k<sub>5</sub>) | ||
| + | *This leads to recruitment of RNA polymerase and increases the frequency of transcription initiation (Fuqua et al., 2001) of the construct gfp gene (strictly forward reaction, governed by k<sub>6</sub>). | ||
| + | |||
| + | {|- | ||
| + | |[[Image: IC07 Const1.png|thumb|440px|'''Figure 3''': Reaction network for Construct 1 (Energy-dependent)]] || [[Image: IC07 C2.png|thumb|440px|'''Figure 4''': Reaction network for Construct 2 (Energy-dependent)]] | ||
| + | |} | ||
| + | <br clear="all"> | ||
==Representative Model== | ==Representative Model== | ||
| - | + | In developing this model, we were interested in the behaviour at steady-state, that is when the system has equilibrated and the concentrations of the state variables remain constant. | |
| - | + | '''A Resource-Dependent Model''' | |
| - | + | To simulate the behaviour of both constructs we have developed an ordinary differential equations (ODE) system that describes the evolution with time of the concentrations of the molecules involved in the reaction network. <br> | |
| + | At reasonably high molecular concentrations of the state variables, such a model can be adopted instead of the more accurate stochastic model without any risk of major error. The advantages of the ODE approach in term of complexity and computing time/power are non negligible. | ||
| + | <br>Our model depends not only on the reaction network described above but also on the following considerations: | ||
| + | <br> | ||
| + | *The only difference is with regards to the parameter k<sub>1</sub>, the maximum transcription rate of the constitutive promoter (pTET). Therefore in construct 1, k<sub>1</sub> is non-zero; k<sub>1</sub> = 0 for construct 2 (which lacks pTET). | ||
| + | *The chassis analysis conducted in the cell-free section (wiki link) has shown that some resource – dependent term had to be introduced to curb the synthesis of protein in a cell-free system. We retained the same curbing function as with the chassis characterisation. | ||
| + | *In theory the cost of the synthesis of a protein is proportional to the length of the coding region. Since GFP and LuxR have coding regions of roughly same lengths (800-900 base pairs) we assume an equal cost for both proteins. | ||
| + | *We assume no cooperativity in any of the bindings. | ||
| - | The | + | '''The Equations''' |
| - | + | [[Image:IC07 Model2.png|thumb|center|600px|'''Model 2''', an energy-dependent network, where the dependence on energy assumes Hill-like dynamics]] | |
| + | <br clear="all"> | ||
| - | [[ | + | where [E] represents the [nutrient] or ["energy"] within the system. The energy dependence is assumed to follow Hill-like Dynamics. |
| - | The | + | |
| - | <br><br><br><br><br><br> | + | The parameters of our model are described in the table below |
| + | |||
| + | ====''Model Parameters''==== | ||
| + | |||
| + | |||
| + | |||
| + | {| class="wikitable" border="1" cellspacing="0" cellpadding="2" style="text-align:left; margin: 1em 1em 1em 0; background: #f9f9f9; border: 1px #aaa solid; border-collapse: collapse;" | ||
| + | ! Parameter | ||
| + | ! Description | ||
| + | |- | ||
| + | |<font color = blue>''Kinetic <br> Constants'' </font> | ||
| + | | | ||
| + | |- | ||
| + | | k<sub>1</sub> | ||
| + | | Maximal constitutive transcription of LuxR by pTET | ||
| + | |- | ||
| + | |k<sub>2</sub> | ||
| + | |Binding between LuxR and AHL | ||
| + | |- | ||
| + | |k<sub>3</sub> | ||
| + | |Dissociation of protein complex LuxR-AHL (A) | ||
| + | |- | ||
| + | |k<sub>4</sub> | ||
| + | |Binding between A and pLux promoter | ||
| + | |- | ||
| + | |k<sub>5</sub> | ||
| + | |Dissociaton of A-pLux complex | ||
| + | |- | ||
| + | |k<sub>6</sub> | ||
| + | |Transcription of GFP - k<sub>6</sub> proportional to amount of DNA in solution | ||
| + | |- | ||
| + | |<font color = blue>''Degradation <br> Rates'' </font> | ||
| + | | | ||
| + | |- | ||
| + | |δ<sub>LuxR</sub> | ||
| + | |Degradation rate of LuxR<br> | ||
| + | δ<sub>LuxR</sub> is negligible – assumed to be zero | ||
| + | |- | ||
| + | |δ<sub>AHL</sub> | ||
| + | |Degradation rate of AHL<br> | ||
| + | δ<sub>AHL</sub> is negligible – assumed to be zero | ||
| + | |- | ||
| + | |δ<sub>GFP</sub> | ||
| + | |Degradation rate of GFP<br> | ||
| + | δ<sub>GFP</sub> is negligible – assumed to be zero | ||
| + | |- | ||
| + | |<font color = blue>''Hill Co-operativity''</font> | ||
| + | | | ||
| + | |- | ||
| + | |n | ||
| + | |Co-operativity coefficient describing the degree <br>of energy dependence, which follows Hill-like dynamics | ||
| + | |- | ||
| + | |<font color = blue>''Energy consumption <br> of transcription''</font> | ||
| + | | | ||
| + | |- | ||
| + | |α<sub>1</sub> | ||
| + | |Energy consumption due to constitutive transcription of LuxR | ||
| + | |- | ||
| + | |α<sub>2</sub> | ||
| + | |Energy consumption due to transcription of ''gfp'' gene | ||
| + | |- | ||
| + | |<font color = blue>''Initial Conditions''</font> | ||
| + | | | ||
| + | |- | ||
| + | |P<sub>0</sub> | ||
| + | |Initial Concentration of Promoters <br> | ||
| + | P<sub>0</sub> represents the amount of DNA inserted into the extract | ||
| + | |- | ||
| + | |LuxR<sub>0</sub> | ||
| + | |Initial Concentration of LuxR | ||
| + | |||
| + | |} | ||
| + | |||
| + | <br> | ||
| + | |||
| + | We now present the essential features of the system behaviour, simulated for a given set of parameters. | ||
==Simulations== | ==Simulations== | ||
| - | + | Presented below are the most essential results of the simulations performed on the final construct, i.e. construct 1. | |
| + | In light of the rapid equilibrium approximation which was employed in developing the model, relatively high k-values were selected: | ||
| + | <br>k2 = k3 = k4 = k5 = 100 (dynamical equilibrium); k1 = 0.3 (constitutive transcription by pTet); k6 = 20*k1 (transcription of ''gfp''); | ||
| + | ==== 1. Construct 1: [GFP] vs time - varying [AHL]<sub>0</sub>==== | ||
| + | [[Image: C1 AHL GFP.png|thumb|left|430px|'''Figure 5''': Investigation of the effect on GFP expression by <br>'''Construct 1''', when the initial [AHL] is varied i.e. AHL<sub>0</sub> = 0.1, 1, 5, 10, 50 & 100 a.u. (arbitrary units)]] | ||
| + | |||
| + | [[Image: C1 AHL Energy.png|thumb|right|430px|'''Figure 6''': Comparison of energy consumption of '''Construct''' 1, when the initial [AHL] is varied i.e. AHL<sub>0</sub> = 0.1, 1, 5, 10, 50 & 100 a.u (arbitrary units)]] | ||
| + | |||
| + | ====Discussion==== | ||
| + | |||
| + | Figures 5 and 6 illustrate GFP expression and Energy depletion of construct 1, at various initial AHL concentrations. | ||
| + | |||
| + | The absolute value of the peak expression is a function of the various rate constants. Here our analysis serves to illustrate the general behaviour offered by construct 1 – a qualitative approach. | ||
| + | |||
| + | As initial [AHL] is increased, the level of expression increases accordingly to a point were there is negligible difference between the maximal outputs between adjacent tested cases of [AHL]. In fact, from this figure, and for this set of parameters, it is suggestive that saturation occurs at approximately 5 a.u.; in fact, the difference in maximal GFP output between when AHL is increased several-fold is less than 10%. | ||
| + | |||
| + | Figure 6, the energy depletion plot, serves to illustrate the effect of increased initial concentrations of AHL on consumption of energy. More resources (promoters) need to be employed to "accommodate" the increasing [AHL]. This obviously increases the rate of energy depletion, but only until a certain point, as saturating behaviour has been attained - promoter saturation. This is the likely explanation for the "saturation curve" obtained from the experimental data, since the protein degradation terms themselves are almost negligible. | ||
| + | |||
| + | ====2. Construct 1: [GFP] vs [AHL] - transfer function curve==== | ||
| + | |||
| + | {|- | ||
| + | | [[Image: C1 transfer 300min.png|thumb|left|430px|'''Figure 7''': Transfer function of construct 1, after t = 300 min(x-axis is log-scaled). [AHL] measured in arbitrary units]] || [[Image: C1 Transfer 1000min.png|thumb|right|430px|'''Figure 8''': Transfer function of construct 1, after t = 1000min (x-axis is log-scaled) [AHL] measured in arbitrary units]] | ||
| + | |} | ||
| + | <br clear="all"> | ||
| + | |||
| + | ====Discussion==== | ||
| + | Figure 7 serves to amplify the essential claims from the previous simulation. Saturative behaviour occurs at approximately [AHL] = 5-10 arbitrary units (a.u.). The effect of increasing initial [AHL] beyond this level has negligible effect on [GFP] expression, for initially available resources. This first transfer function is taken at t=300min. | ||
| + | We would expect the curve to be considerably reduced at a later instance. This is due to reduced energy resources. This ties in with what is observed in figure 8, at t = 1000: significantly reduced peak expression of GFP. | ||
| + | |||
| + | ====Construct 1 – effect of varying GFP degradation term on the dynamic behaviour==== | ||
| + | [[Image: C1 dGFP.png|thumb|left|450px|'''Figure 9''': ]]<br clear="all"> | ||
| + | |||
| + | ====Discussion==== | ||
| + | This simulation illustrates the effect of δ<sub>GFP</sub> on the expression of GFP by construct 1. At small δ<sub>GFP</sub>, the steady-state approach clearly can be attributed to the considerable rate of energy depletion. When the degradation terms are more significant, their effect is considerably greater than the effect of limited resources. | ||
| + | If our model were not energy-dependent, then the simulation for δ<sub>GFP</sub> tending to zero should yield a positively sloped parabolic curve. | ||
=== Conclusions === | === Conclusions === | ||
| + | From the initial simulations performed, it was suggested that construct 2 was more effective than construct 1 on the basis of sensitivity, response time and maximal output of reporter. Construct 1 was superior in terms of energy-efficiency. Its life-time was far greater than that of its counterpart. Both constructs possessed significant strenghts and their further testing was warranted. | ||
| + | |||
| + | Experimental work was thus performed on both constructs. The notable feature of these endeavours was that construct 2 was eventually aborted due to difficulty in effectively purifying LuxR. Since our initial simulations were promising with regards to this device, it should be investigated more fully in the future. | ||
| + | |||
| + | Despite this occurence, the simulations for construct 1, correlate with the data presented by the experimental team, and are a fullfilment of our specifications. | ||
| + | |||
| + | Data Analysis now attempts to extract biologically realistic (plausible) parameters to render the model more predictive. | ||
| + | |||
| + | ===Software=== | ||
| + | |||
| + | All deterministic simulations were performed using Matlab 7 (The MathWorks Inc., Natick, MA). | ||
| + | *m-files of all simulations are available on our [https://2007.igem.org/Imperial/Dry_Lab/Software Software] page. | ||
| + | ===References=== | ||
<center> [https://2007.igem.org/Imperial/Infector_Detector/Design << Design] | Modelling | [https://2007.igem.org/Imperial/Infector_Detector/Implementation Implementation >>] | <center> [https://2007.igem.org/Imperial/Infector_Detector/Design << Design] | Modelling | [https://2007.igem.org/Imperial/Infector_Detector/Implementation Implementation >>] | ||
</center> | </center> | ||
Latest revision as of 02:34, 27 October 2007

Infector Detector: Modelling
Introduction
Infector Detector (ID) is a simple biological detector designed to expose the presence of a bacterial biofilm. It functions by exploiting the inherent AHL (Acetyl Homoserine Lactone) production employed by certain types of quorum-sensing bacteria, in the formation of such structures. The design phase of our project has yielded two possible system constructs.
Implementation & Reaction Network
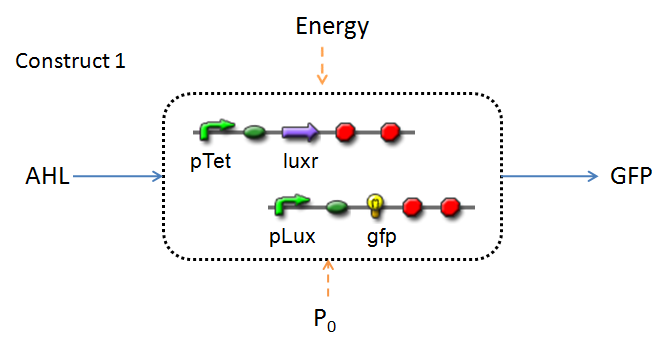
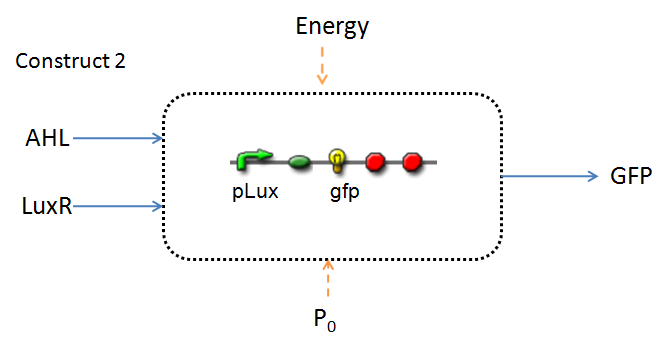
In line with the concept of abstraction in Synthetic Biology, the correlation of the output of the proposed system constructs to their inputs, can be visualized by the following black-box illustrations of the two cases.
It is evident that AHL is an input to both constructs; a function of the particular biofilm. Furthermore, energy and promoter concentration are included as auxillary inputs to both system constructs. LuxR, is an additional input, exclusive to construct 2, which lacks constitutive expression of LuxR by pTET.
(this of course occuring within our cell-free chassis)
The Reaction Network
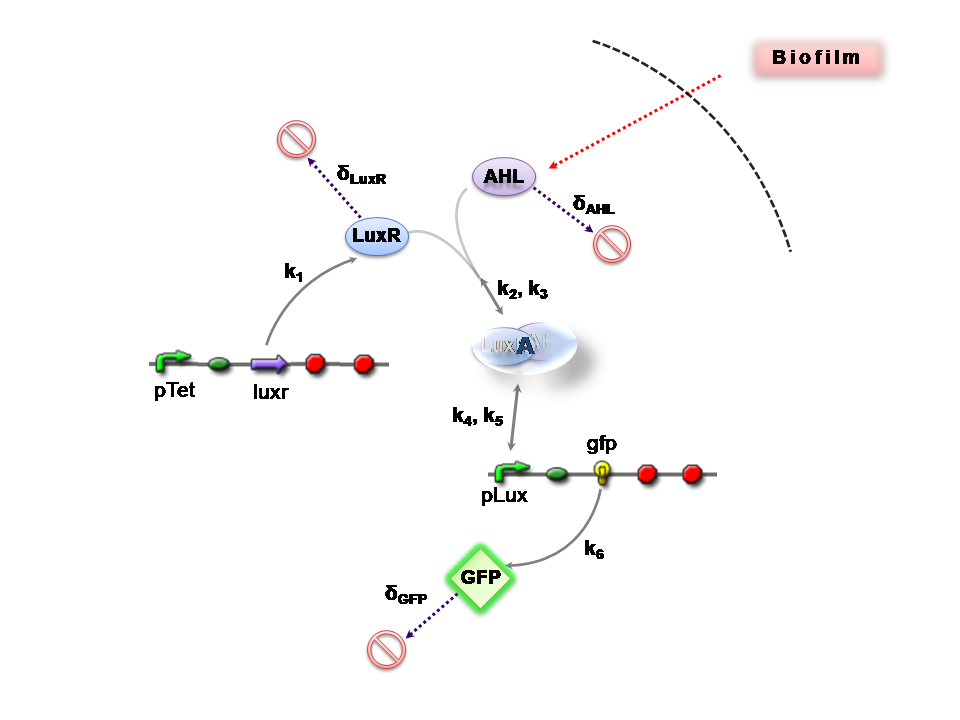
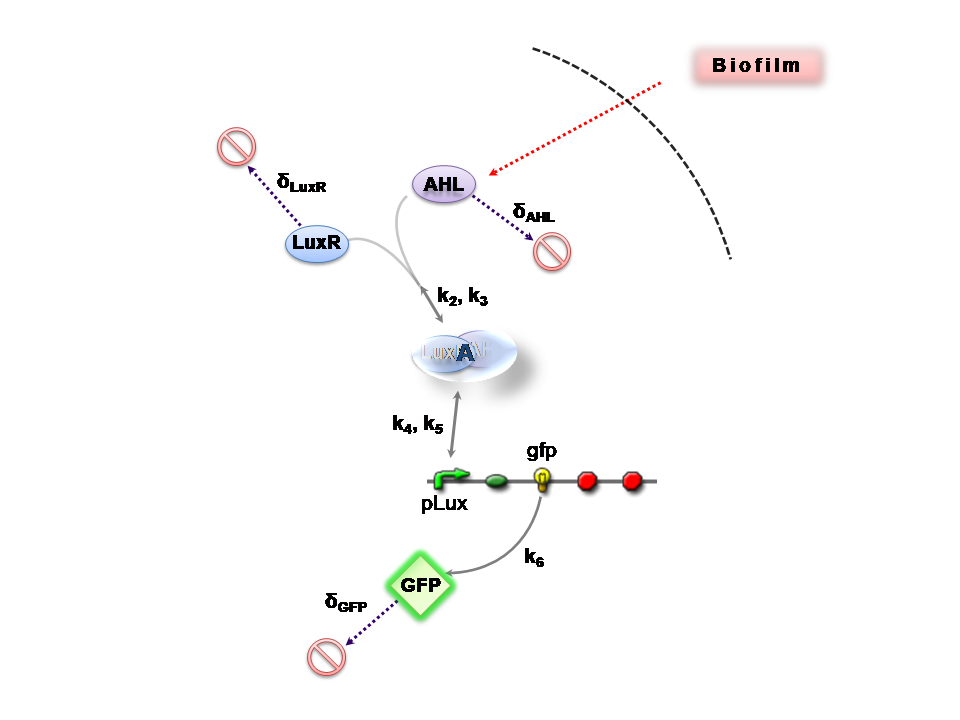
Both designs are based on the following reaction network:
- AHL is assumed to diffuse freely "into" the system (we are dealing with a cell-free system, which comes into direct contact with the biofilm).
- The target AHL molecule binds with the monomeric protein LuxR.
- LuxR is either constitutively produced by construct 1, or directly introduced in purified form, as part of construct 2.
- The binding of these two proteins yields the intermediating LuxR-AHL complex, A. We call k2 and k3 the kinetic constants of the forward and backward reactions respectively.
- The formed transcription factor activates the transcription of the pLux operon, which codes for the relevant reporter protein, GFP. Activation occurs by way of the reversible binding of this transcription factor, A, to the response sequences in the operon (k4 and k5)
- This leads to recruitment of RNA polymerase and increases the frequency of transcription initiation (Fuqua et al., 2001) of the construct gfp gene (strictly forward reaction, governed by k6).
Representative Model
In developing this model, we were interested in the behaviour at steady-state, that is when the system has equilibrated and the concentrations of the state variables remain constant.
A Resource-Dependent Model
To simulate the behaviour of both constructs we have developed an ordinary differential equations (ODE) system that describes the evolution with time of the concentrations of the molecules involved in the reaction network.
At reasonably high molecular concentrations of the state variables, such a model can be adopted instead of the more accurate stochastic model without any risk of major error. The advantages of the ODE approach in term of complexity and computing time/power are non negligible.
Our model depends not only on the reaction network described above but also on the following considerations:
- The only difference is with regards to the parameter k1, the maximum transcription rate of the constitutive promoter (pTET). Therefore in construct 1, k1 is non-zero; k1 = 0 for construct 2 (which lacks pTET).
- The chassis analysis conducted in the cell-free section (wiki link) has shown that some resource – dependent term had to be introduced to curb the synthesis of protein in a cell-free system. We retained the same curbing function as with the chassis characterisation.
- In theory the cost of the synthesis of a protein is proportional to the length of the coding region. Since GFP and LuxR have coding regions of roughly same lengths (800-900 base pairs) we assume an equal cost for both proteins.
- We assume no cooperativity in any of the bindings.
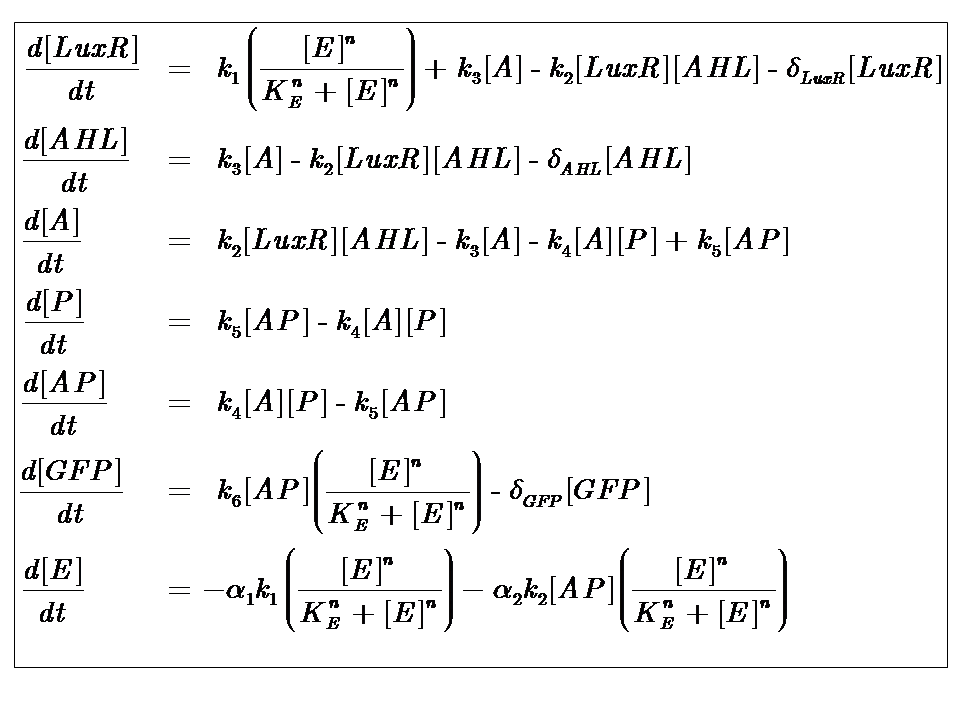
The Equations
where [E] represents the [nutrient] or ["energy"] within the system. The energy dependence is assumed to follow Hill-like Dynamics.
The parameters of our model are described in the table below
Model Parameters
| Parameter | Description |
|---|---|
| Kinetic Constants | |
| k1 | Maximal constitutive transcription of LuxR by pTET |
| k2 | Binding between LuxR and AHL |
| k3 | Dissociation of protein complex LuxR-AHL (A) |
| k4 | Binding between A and pLux promoter |
| k5 | Dissociaton of A-pLux complex |
| k6 | Transcription of GFP - k6 proportional to amount of DNA in solution |
| Degradation Rates | |
| δLuxR | Degradation rate of LuxR δLuxR is negligible – assumed to be zero |
| δAHL | Degradation rate of AHL δAHL is negligible – assumed to be zero |
| δGFP | Degradation rate of GFP δGFP is negligible – assumed to be zero |
| Hill Co-operativity | |
| n | Co-operativity coefficient describing the degree of energy dependence, which follows Hill-like dynamics |
| Energy consumption of transcription | |
| α1 | Energy consumption due to constitutive transcription of LuxR |
| α2 | Energy consumption due to transcription of gfp gene |
| Initial Conditions | |
| P0 | Initial Concentration of Promoters P0 represents the amount of DNA inserted into the extract |
| LuxR0 | Initial Concentration of LuxR |
We now present the essential features of the system behaviour, simulated for a given set of parameters.
Simulations
Presented below are the most essential results of the simulations performed on the final construct, i.e. construct 1.
In light of the rapid equilibrium approximation which was employed in developing the model, relatively high k-values were selected:
k2 = k3 = k4 = k5 = 100 (dynamical equilibrium); k1 = 0.3 (constitutive transcription by pTet); k6 = 20*k1 (transcription of gfp);
1. Construct 1: [GFP] vs time - varying [AHL]0
Discussion
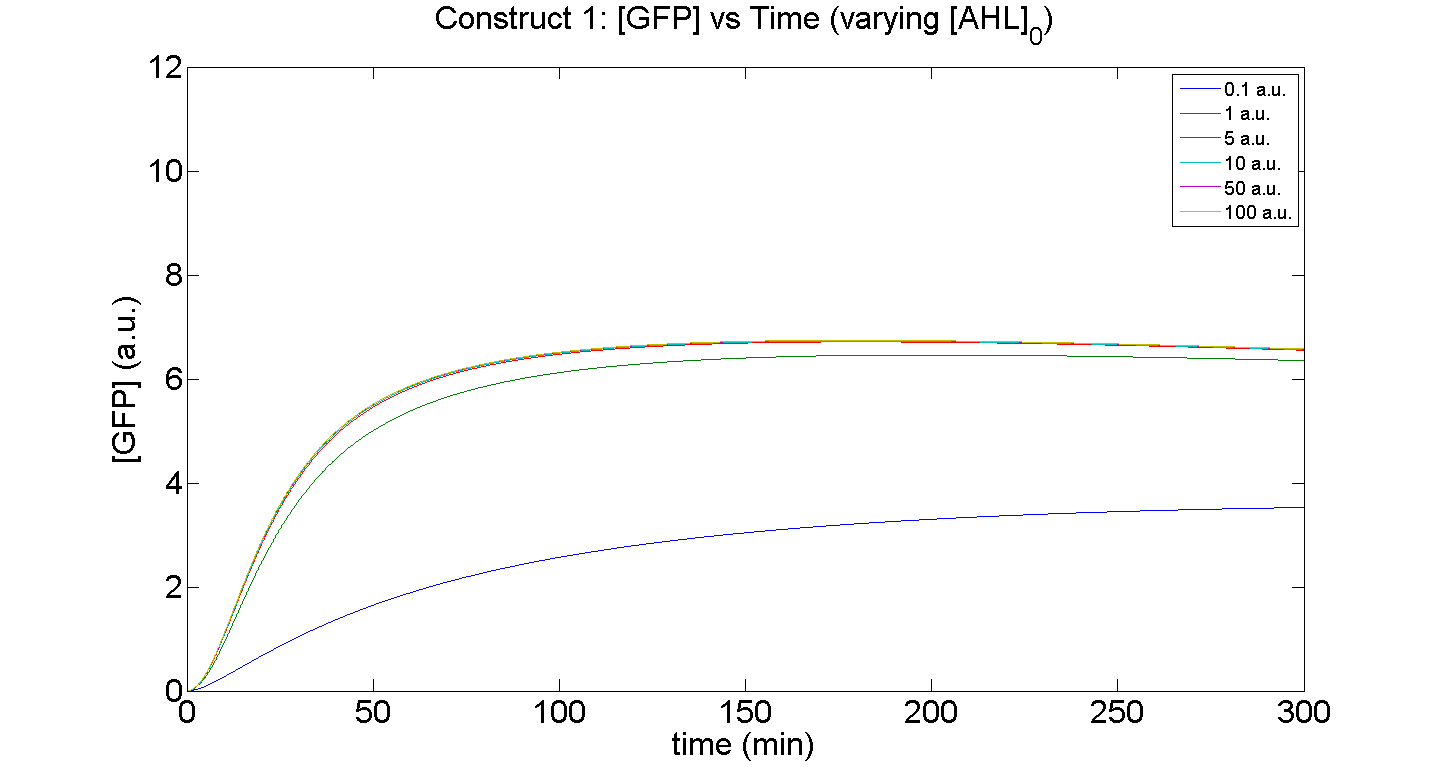
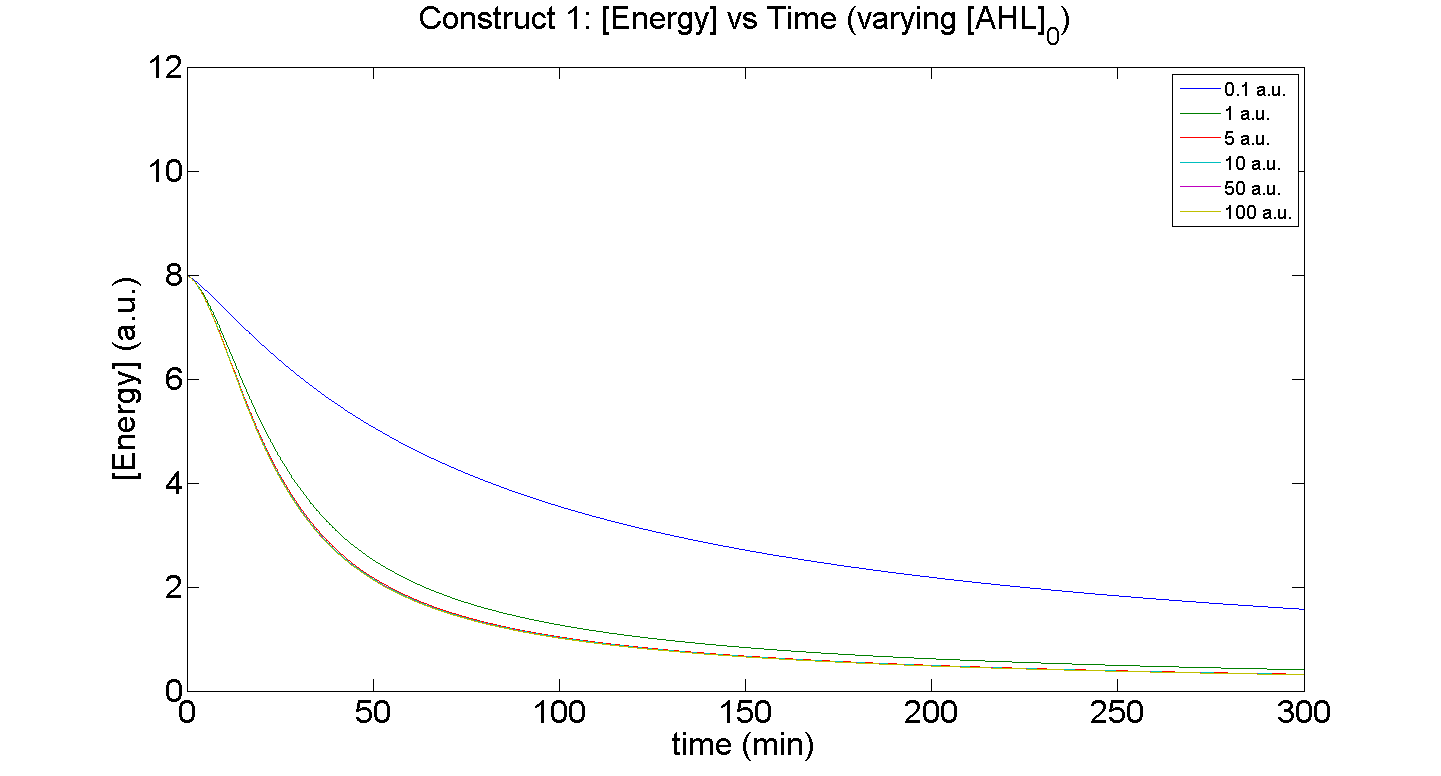
Figures 5 and 6 illustrate GFP expression and Energy depletion of construct 1, at various initial AHL concentrations.
The absolute value of the peak expression is a function of the various rate constants. Here our analysis serves to illustrate the general behaviour offered by construct 1 – a qualitative approach.
As initial [AHL] is increased, the level of expression increases accordingly to a point were there is negligible difference between the maximal outputs between adjacent tested cases of [AHL]. In fact, from this figure, and for this set of parameters, it is suggestive that saturation occurs at approximately 5 a.u.; in fact, the difference in maximal GFP output between when AHL is increased several-fold is less than 10%.
Figure 6, the energy depletion plot, serves to illustrate the effect of increased initial concentrations of AHL on consumption of energy. More resources (promoters) need to be employed to "accommodate" the increasing [AHL]. This obviously increases the rate of energy depletion, but only until a certain point, as saturating behaviour has been attained - promoter saturation. This is the likely explanation for the "saturation curve" obtained from the experimental data, since the protein degradation terms themselves are almost negligible.
2. Construct 1: [GFP] vs [AHL] - transfer function curve
Discussion
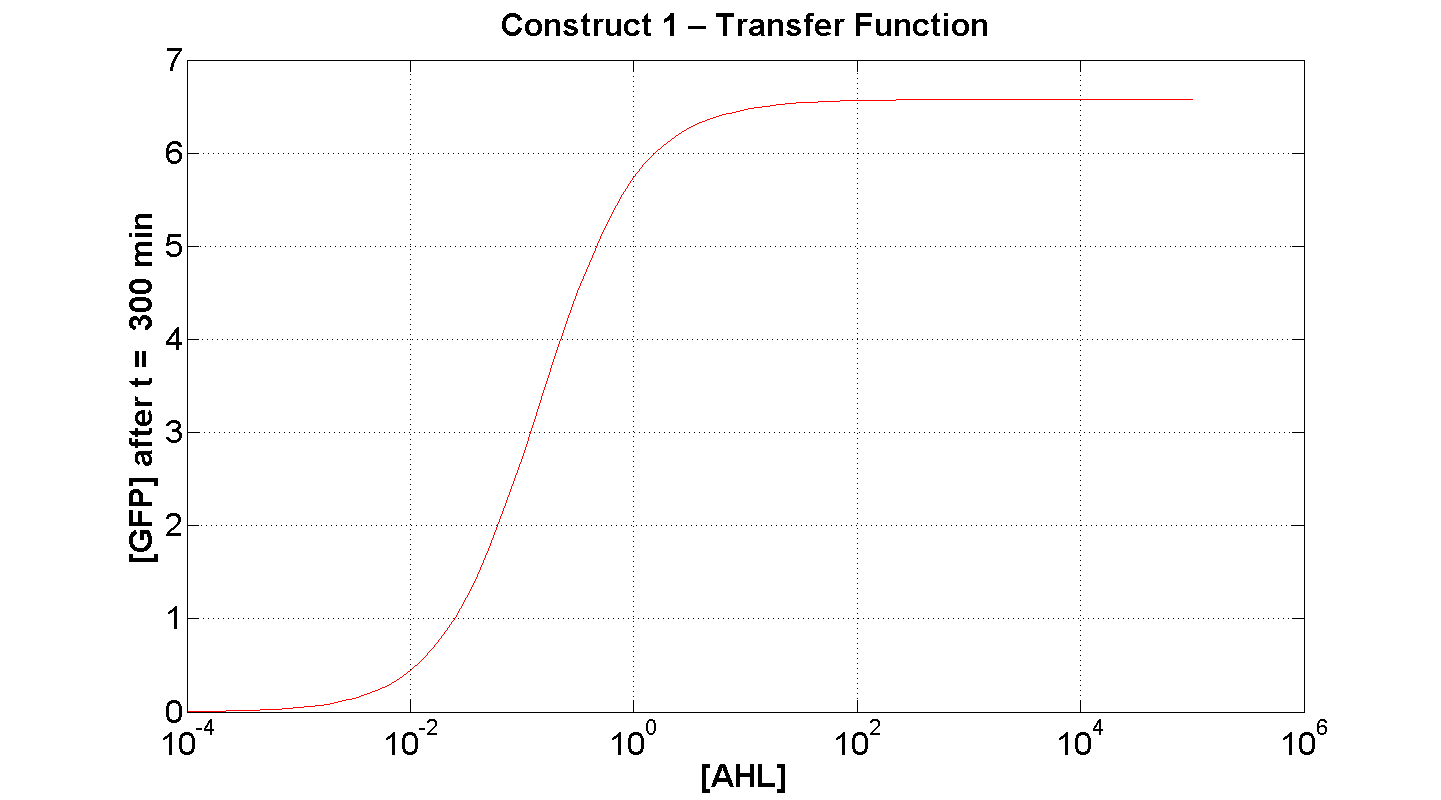
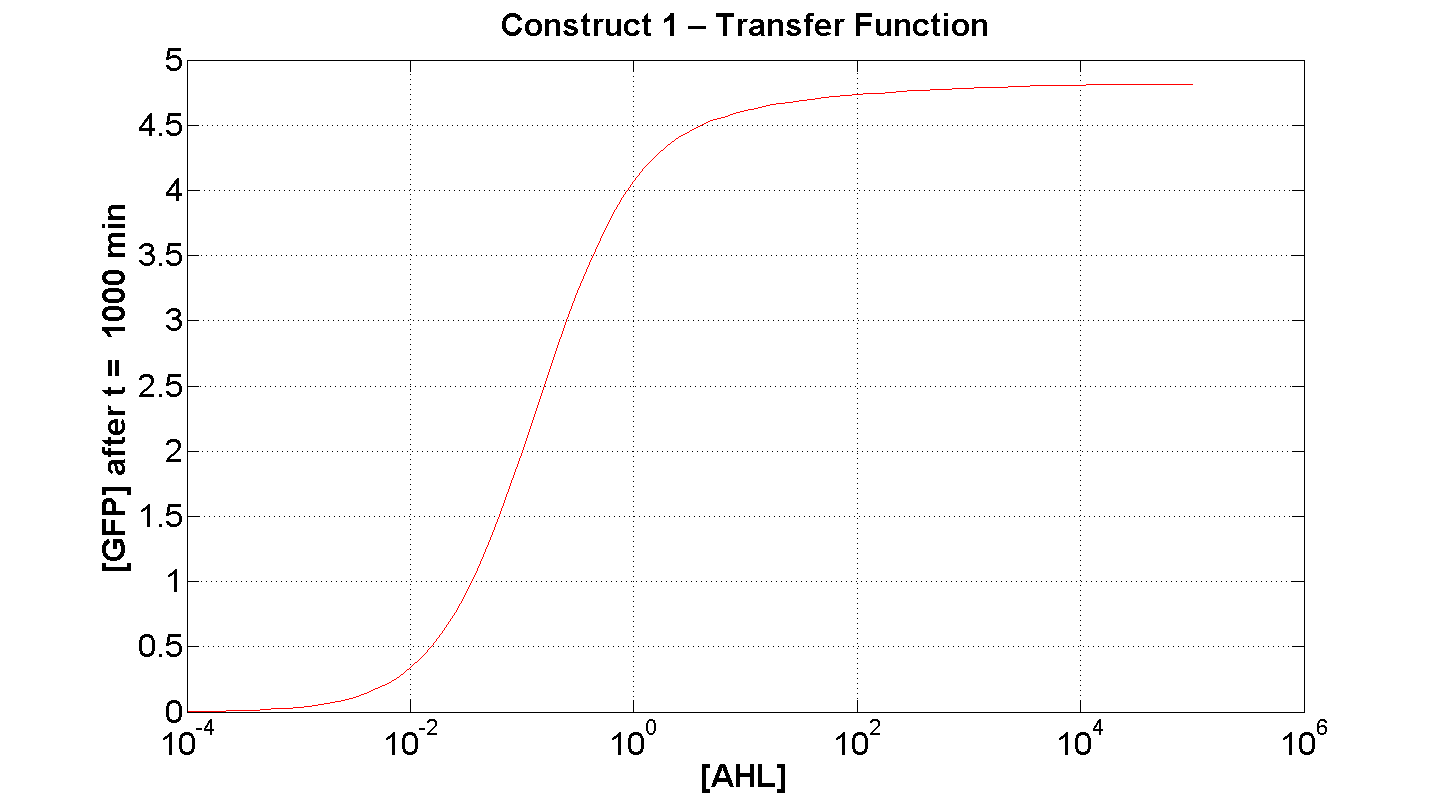
Figure 7 serves to amplify the essential claims from the previous simulation. Saturative behaviour occurs at approximately [AHL] = 5-10 arbitrary units (a.u.). The effect of increasing initial [AHL] beyond this level has negligible effect on [GFP] expression, for initially available resources. This first transfer function is taken at t=300min. We would expect the curve to be considerably reduced at a later instance. This is due to reduced energy resources. This ties in with what is observed in figure 8, at t = 1000: significantly reduced peak expression of GFP.
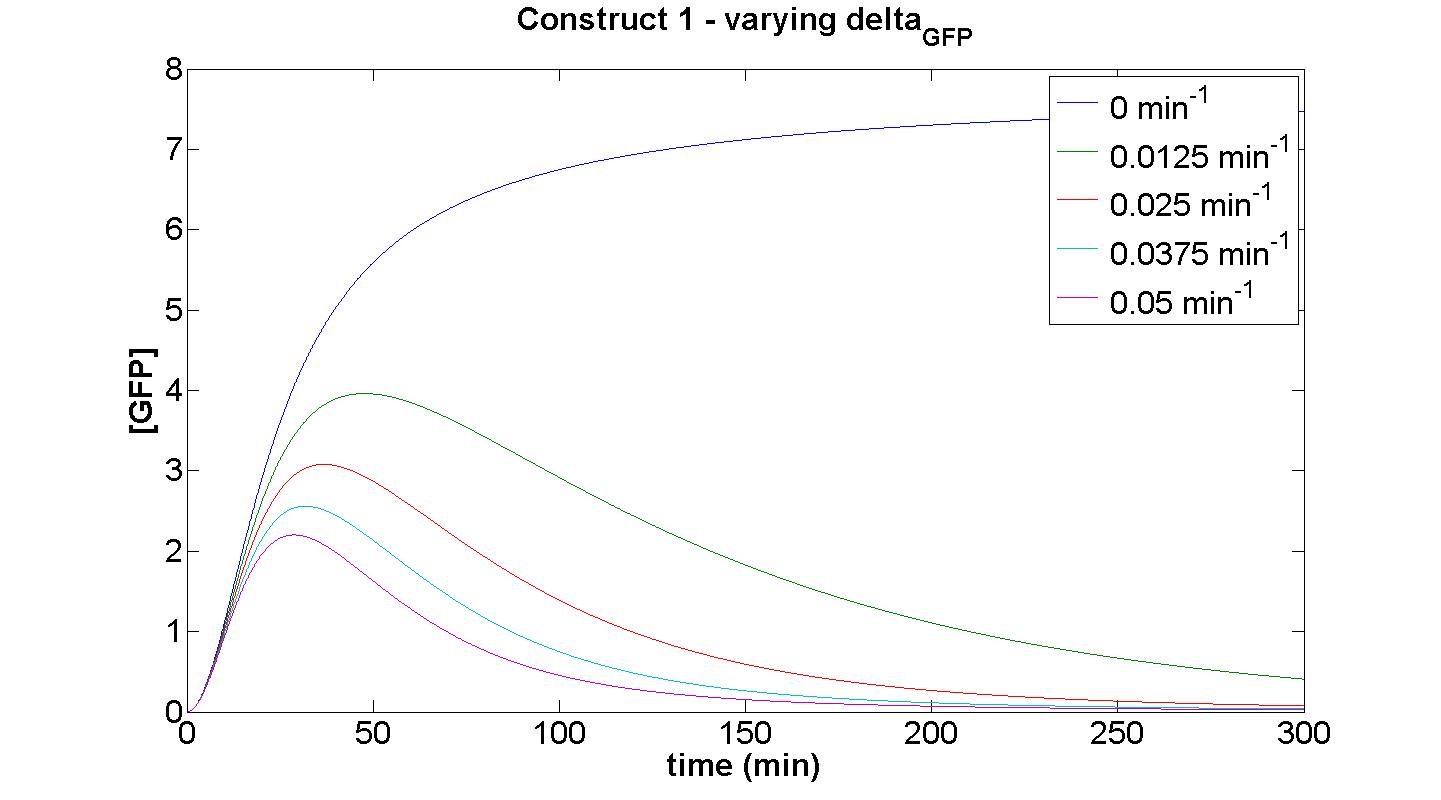
Construct 1 – effect of varying GFP degradation term on the dynamic behaviour
Discussion
This simulation illustrates the effect of δGFP on the expression of GFP by construct 1. At small δGFP, the steady-state approach clearly can be attributed to the considerable rate of energy depletion. When the degradation terms are more significant, their effect is considerably greater than the effect of limited resources. If our model were not energy-dependent, then the simulation for δGFP tending to zero should yield a positively sloped parabolic curve.
Conclusions
From the initial simulations performed, it was suggested that construct 2 was more effective than construct 1 on the basis of sensitivity, response time and maximal output of reporter. Construct 1 was superior in terms of energy-efficiency. Its life-time was far greater than that of its counterpart. Both constructs possessed significant strenghts and their further testing was warranted.
Experimental work was thus performed on both constructs. The notable feature of these endeavours was that construct 2 was eventually aborted due to difficulty in effectively purifying LuxR. Since our initial simulations were promising with regards to this device, it should be investigated more fully in the future.
Despite this occurence, the simulations for construct 1, correlate with the data presented by the experimental team, and are a fullfilment of our specifications.
Data Analysis now attempts to extract biologically realistic (plausible) parameters to render the model more predictive.
Software
All deterministic simulations were performed using Matlab 7 (The MathWorks Inc., Natick, MA).
- m-files of all simulations are available on our Software page.
