The Goal
From 2007.igem.org
| (5 intermediate revisions not shown) | |||
| Line 46: | Line 46: | ||
=== The Theory === | === The Theory === | ||
| - | [[image:loops2.png| | + | [[image:loops2.png|400 px|center|From open loops to closed loops]] |
Open loop: This is a a black box with a parameter knob (blue), an input (yellow) and an output (cyan). Keeping the parameter fixed, we can dial up the input and measure the resulting outputs, giving us the open-loop characteristic (purple curve). | Open loop: This is a a black box with a parameter knob (blue), an input (yellow) and an output (cyan). Keeping the parameter fixed, we can dial up the input and measure the resulting outputs, giving us the open-loop characteristic (purple curve). | ||
| Line 58: | Line 58: | ||
=== The Experiments === | === The Experiments === | ||
| - | [[image:loops3.png| | + | [[image:loops3.png|500 px|center|Genetic implementations of loops]] |
We used three transcriptional regulatory modules to build our loops: the IPTG-inducible lac system, the aTc-inducible tet system, and the lux quorum-sensing system of Vibrio fischeri. The measured response of our constructs can be found in their [[Parts Data Sheets|datasheets]]. The key measurements are the following: | We used three transcriptional regulatory modules to build our loops: the IPTG-inducible lac system, the aTc-inducible tet system, and the lux quorum-sensing system of Vibrio fischeri. The measured response of our constructs can be found in their [[Parts Data Sheets|datasheets]]. The key measurements are the following: | ||
| Line 67: | Line 67: | ||
The open-loop characteristic [Sen-TIC+Rec-LRY.RC] shows the CFP level (output, cyan), as LuxI.CFP (parameter, blue) and LuxR.YFP (input, yellow) are varied. Equivalences, relating the amounts of CFP (cyan) and LuxR.YFP (yellow), can be determined by comparing [Trc-LC] and [Trc-LRY]. We used these measurements to predict the closed-loop response, and compared it against the measured response [Sen-TIC+Rec-RRY]. | The open-loop characteristic [Sen-TIC+Rec-LRY.RC] shows the CFP level (output, cyan), as LuxI.CFP (parameter, blue) and LuxR.YFP (input, yellow) are varied. Equivalences, relating the amounts of CFP (cyan) and LuxR.YFP (yellow), can be determined by comparing [Trc-LC] and [Trc-LRY]. We used these measurements to predict the closed-loop response, and compared it against the measured response [Sen-TIC+Rec-RRY]. | ||
| + | |||
| + | |||
| + | [[image:loops4.png|500 px|center|Predicting the closed loop response]] | ||
| + | |||
=== Did it work? === | === Did it work? === | ||
| Line 72: | Line 76: | ||
Do our predictions really match the observed closed-loop response? | Do our predictions really match the observed closed-loop response? | ||
| - | + | Come find us at the poster session, and come see our iGEM presentation, for the final results! | |
(Or, if you prefer, work it out from the [[Parts Data Sheets|datasheets]]!) | (Or, if you prefer, work it out from the [[Parts Data Sheets|datasheets]]!) | ||
Latest revision as of 09:02, 26 October 2007
| On June 1st 2007, a group of undergraduates of various disciplines and from around the country assembled at NCBS, to attempt a 'proof of principle' demonstration. Their mission: to assemble and test a 'genetically engineered machine', a complex network assembled from simple biological parts. You will be amazed how much they managed to achieve in just six weeks! | |
|
The National Centre for Biological Sciences is a research institute located in Bangalore, India. In 2006, a team of graduate students from NCBS was the first from India to participate in iGEM. This year, we are very excited to compete as an all-undergraduate team of six students, from six different colleges located in four cities around India. Now that the summer is over, we hope to take the excitement of iGEM back to our home institutions, and create new teams across India who will participate in future iGEMs. | |
| [http://www.ncbs.res.in/ National Centre for Biological Sciences, Bangalore] |
| Home | The Team | The Goal | Parts Data Sheets | Mathematical Models | e-Notebook |
|---|
Contents |
Bottom-up biology: A proof of principle
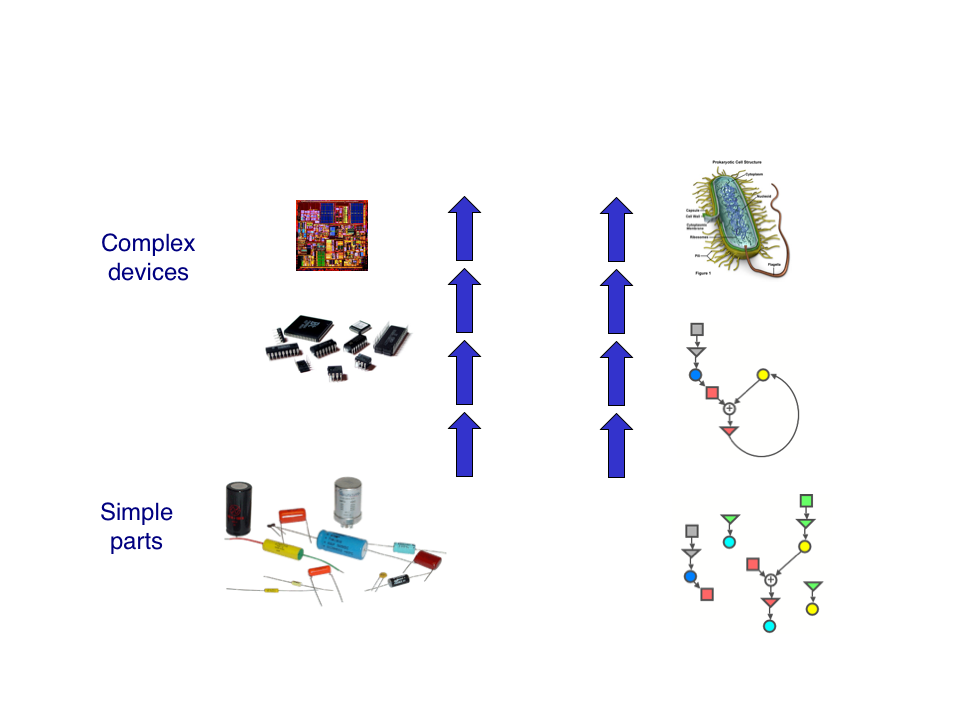
As synthetic biologists, we aim to build biological systems from the bottom-up. The general idea is that, by measuring the behavior of simple parts, we should be able to design and construct complex systems from those parts. But can this be done in practice?
We set out to test this idea rigorously. Our project is designed so that, by measuring the characteristics of relatively simple devices called 'open-loops', we are able to predict the responses of more complex systems called 'closed-loops'. These predictions can be directly tested against the observed responses. If we are successful, it would represent the first experimental validation of this powerful bottom-up design principle.
Scaling up from parts to systems
So how can we best design systems from the bottom-up?
One way is to build a detailed mathematical model. However, even the simplest model will contain many parameters whose values are unknown (for example, we have built a model with three dynamical variables, but 10 dimensionless parameters). We could imagine carefully designing experiments to extract all these parameter values, but once the system becomes moderately large, this becomes impractical. What we need is an approach that scales up easily.
Suppose that we are interested in only certain aspects of system behavior. In this case, it is not necessary to pin down every parameter value -- by making just a few clever measurements, we can extract all the information we need. For example, recent theoretical work [Angeli et al., 2004] has shown that the steady state response of a system involving feedback (closed loop) can be inferred by characterizing its response when feedback is cut (open loop). This technique scales up: it can be applied to arbitrarily complex systems, as long as they satisfy certain simple conditions. Our goal was to test this approach experimentally.
Open-loop characteristics to closed-loop responses
The Theory
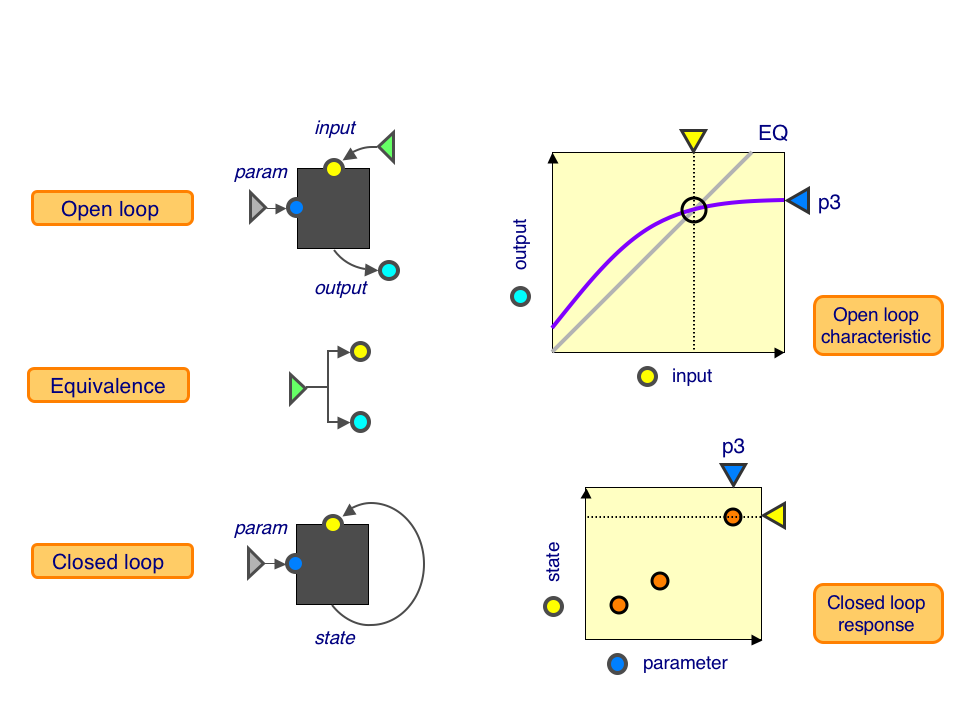
Open loop: This is a a black box with a parameter knob (blue), an input (yellow) and an output (cyan). Keeping the parameter fixed, we can dial up the input and measure the resulting outputs, giving us the open-loop characteristic (purple curve).
Equivalence: This tells us precisely how much output corresponds to a given amount of input, shown as the equivalence line (gray line).
Closed loop: This is a black box with a parameter knob (blue) and a state (yellow). We can vary the parameter values and measure the resulting state, giving us the closed-loop response.
The point where the open-loop characteristic intersects the equivalence line is a self-consistent state: the given output, when fed back through the system, returns precisely the same output. At this point, the open-loop and closed-loop systems look identical, and the input of the open loop matches the state of the closed loop. By measuring these intersections as the parameter is varied, we can predict the closed-loop response from open-loop characteristics.
The Experiments
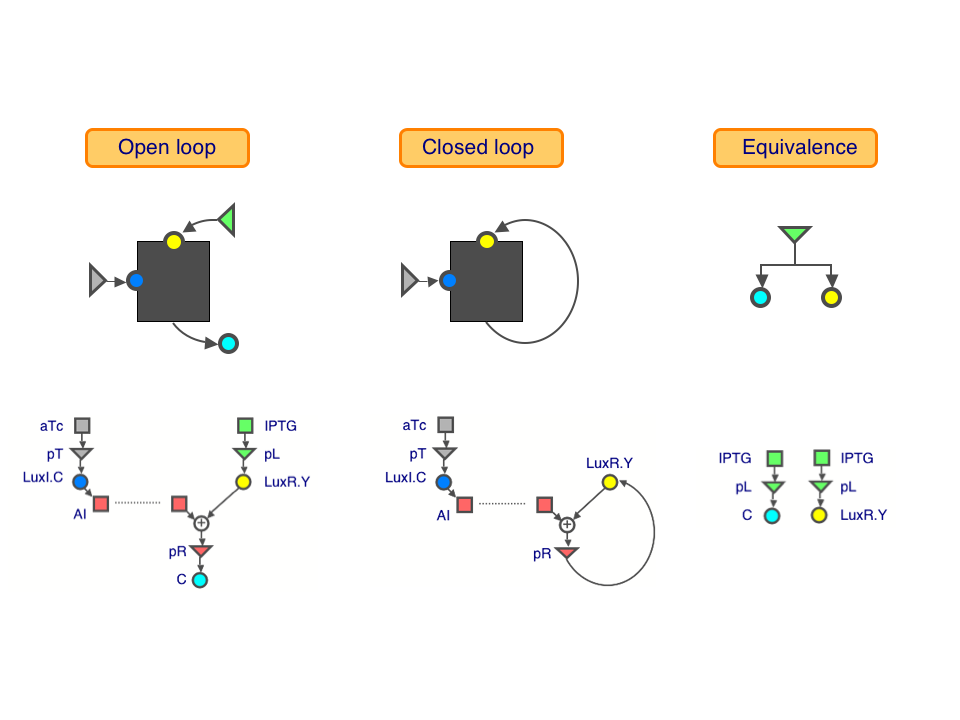
We used three transcriptional regulatory modules to build our loops: the IPTG-inducible lac system, the aTc-inducible tet system, and the lux quorum-sensing system of Vibrio fischeri. The measured response of our constructs can be found in their datasheets. The key measurements are the following:
- Open-loop characteristic: [Sen-TIC+Rec-LRY.RC]
- Equivalences: [Trc-LC], [Trc-LRY]
- Closed-loop response: [Sen-TIC+Rec-RRY]
The open-loop characteristic [Sen-TIC+Rec-LRY.RC] shows the CFP level (output, cyan), as LuxI.CFP (parameter, blue) and LuxR.YFP (input, yellow) are varied. Equivalences, relating the amounts of CFP (cyan) and LuxR.YFP (yellow), can be determined by comparing [Trc-LC] and [Trc-LRY]. We used these measurements to predict the closed-loop response, and compared it against the measured response [Sen-TIC+Rec-RRY].
Did it work?
Do our predictions really match the observed closed-loop response?
Come find us at the poster session, and come see our iGEM presentation, for the final results!
(Or, if you prefer, work it out from the datasheets!)
References
David Angeli, James E. Ferrell, Jr., and Eduardo D. Sontag (2004). Detection of multistability, bifurcations, and hysteresis in a large class of biological positive-feedback systems. PNAS, 101, 1822 – 1827.


