Bologna University/Image Acquisition and Elaboration
From 2007.igem.org
Guido Costa (Talk | contribs) |
|||
| (4 intermediate revisions not shown) | |||
| Line 1: | Line 1: | ||
'''Image Acquisition''' | '''Image Acquisition''' | ||
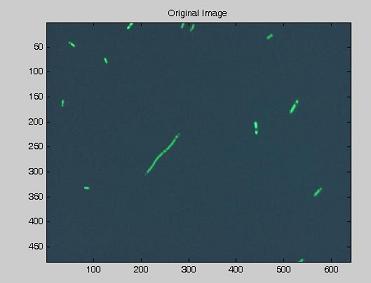
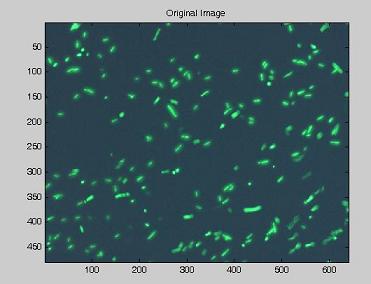
| - | Using the experimental set up illustrated [https://2007.igem.org/Bologna_University/Microscopy:_Experimental_Set_Up here], we obtain short | + | Using the experimental set up illustrated [https://2007.igem.org/Bologna_University/Microscopy:_Experimental_Set_Up here], we obtain short movies of fluorescent bacteria; then we extract several frames from each of them, using a dedicated software. Example images are shown below. |
| Line 65: | Line 65: | ||
| - | |||
| + | For complete results, see [[Bologna University/Fluo Test (Validation) | here]]. | ||
| + | As we expected, the two mean values are close to each other, being the different spots from the same solution. | ||
| - | |||
| - | |||
| - | |||
| - | |||
| - | |||
| - | |||
| - | |||
| - | |||
| - | |||
| - | |||
| - | |||
| - | |||
| - | |||
| - | |||
| - | |||
| - | |||
| - | |||
| - | |||
[[Bologna | Back]] | [[Bologna | Back]] | ||
Latest revision as of 14:12, 25 October 2007
Image Acquisition
Using the experimental set up illustrated here, we obtain short movies of fluorescent bacteria; then we extract several frames from each of them, using a dedicated software. Example images are shown below.
Image Elaboration
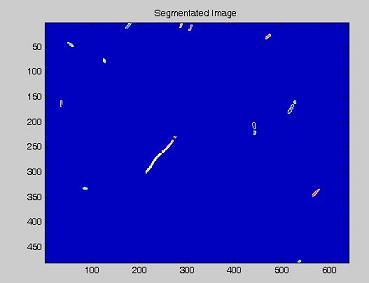
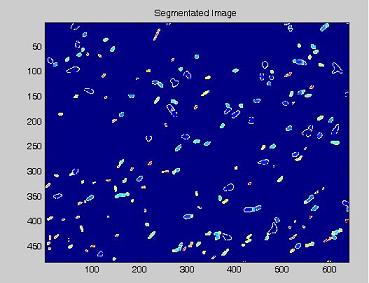
Since we need to know how much of the total image area is occupied by bacteria, we process the images with our segmentation algorithm implemented in Matlab.
Here are the processing phases:
- the RGB image is read and the green channel is extracted;
- a morphological top hat filtering is performed on the grayscale image;
- by means of an adaptive threshold, the image is tranformed in a binary one;
- the distance between every point and the nearest black pixel is calculated;
- on this last image the [http://en.wikipedia.org/wiki/Watershed_%28algorithm%29 watershed] algorithm is applied: every pixel is assigned a label, depending on the segmentated region it belongs; then, every labeled region is represented with a different colour, as in the images shown below;
- the area of every segmented region is calculated, checking that the summation of these areas (including the background) balances the image total area;
- two complementary matrices are created:
-ImageWithOutBackground, containing the intensity positive values corresponding only to pixels recognised as bacteria, with zeros elsewhere; -ImageBackground, which contains the intensity positive values of pixels recognised as background, with zeros as other entries;
- with a summation over all the ImageWithOutBackground matrix' entries, the total intensity is obtained;
- dividing this value by the total bacteria area, the output is the normalized intensity we use to compare the fluorescence of different kinds of bacteria.
Thanks to Camilo Melani for his competence and kindness during the algorithm implementation.
Measures to validate acquisition and elaboration protocol
We use bacteria with [http://partsregistry.org/Part:BBa_I763004 I763004] plasmid, since we know all of them beam fluorescence also when not inducted; we check that the OD value is 1.2. We then execute two different observations:
- ten different spots within the same slide (test A);
- five slides, and two spots each (10 total spots, test B).
For every spot, we take a picture and we elaborate it using the algorithm above, obtaining as output a normalized intensity value. Finally, for each of the two sets of values, we calculate mean and standard deviation; for the B test, we calculate both values either on the 10 intensities indistinctly (B1) and on the five slide means (B2). Here are the results:
| Results | |
|
|
For complete results, see here.
As we expected, the two mean values are close to each other, being the different spots from the same solution.


