Tianjin/FLIP-FLOP/Model3
From 2007.igem.org
Sunlovedie (Talk | contribs) |
|||
| (6 intermediate revisions not shown) | |||
| Line 1: | Line 1: | ||
{| | {| | ||
| - | [[Image:tjumodelff304.jpg| | + | |- |
| - | [[Image:tjumodelff305.jpg| | + | |width="960px" style="padding: 10px; background-color: #FFFF99" | |
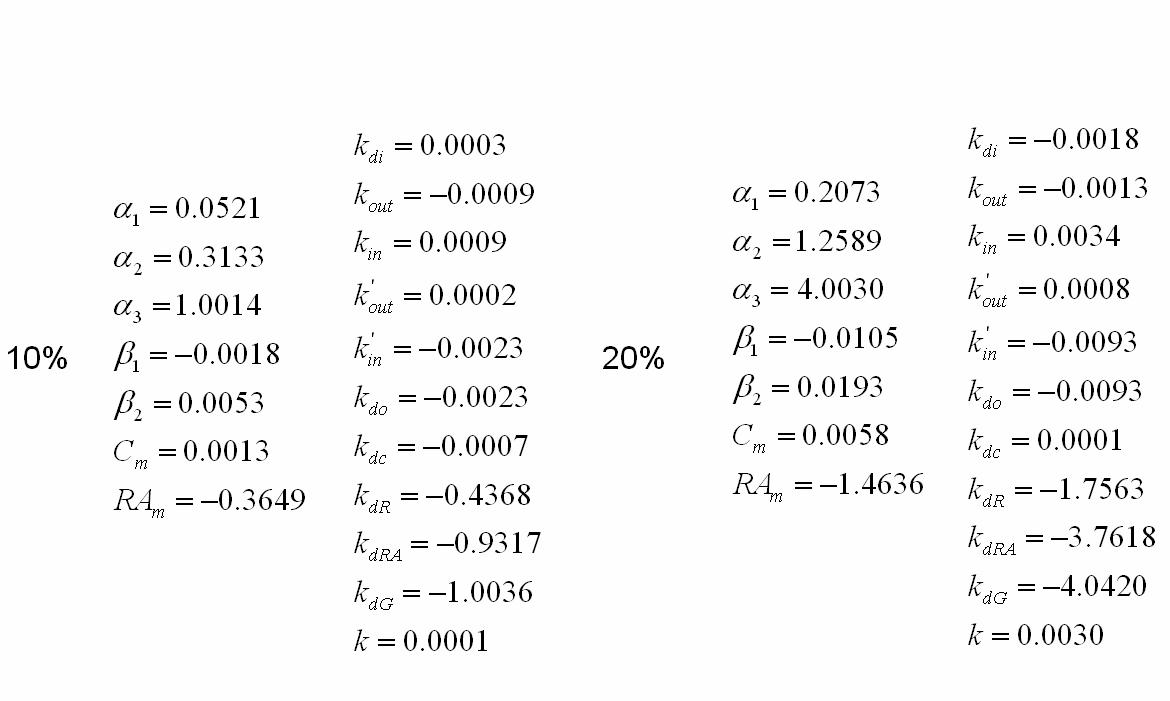
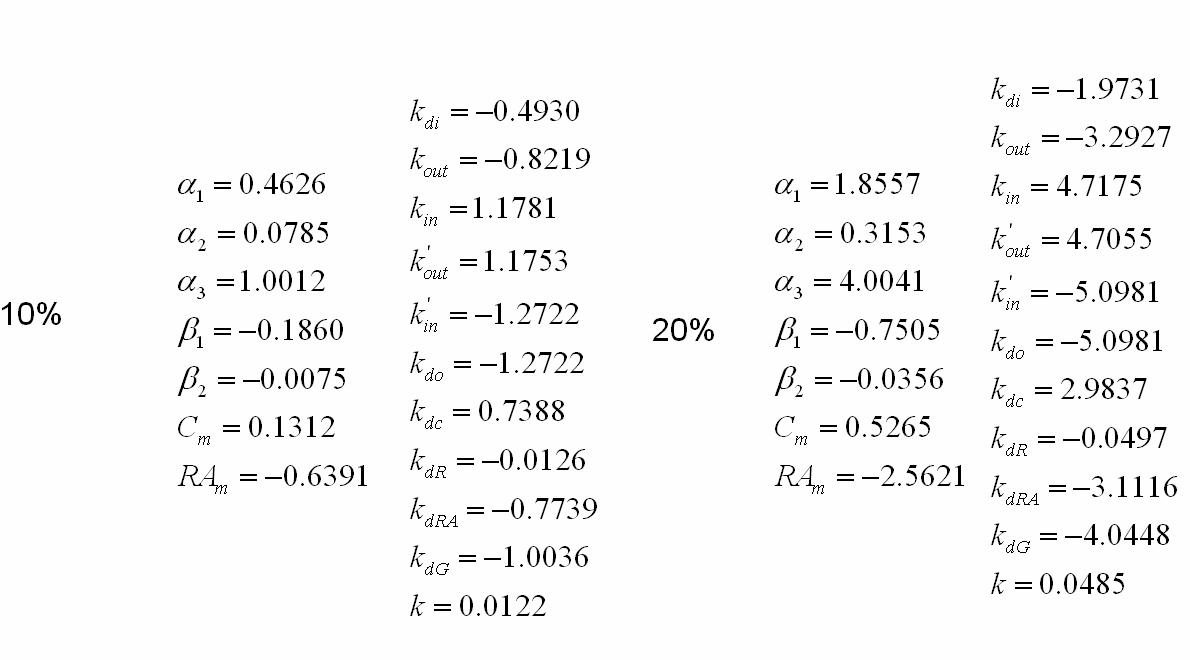
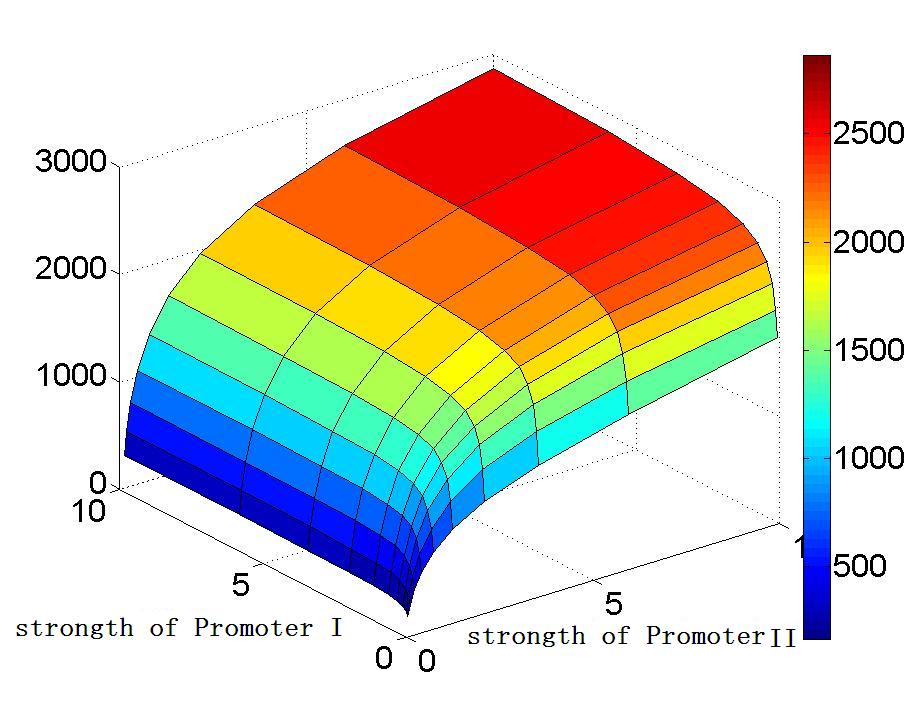
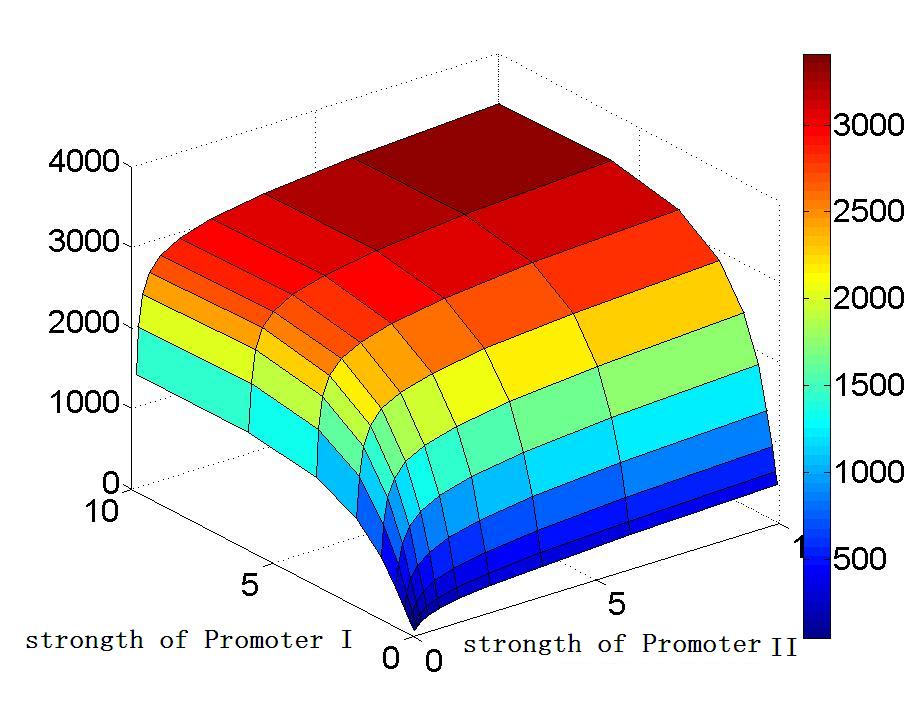
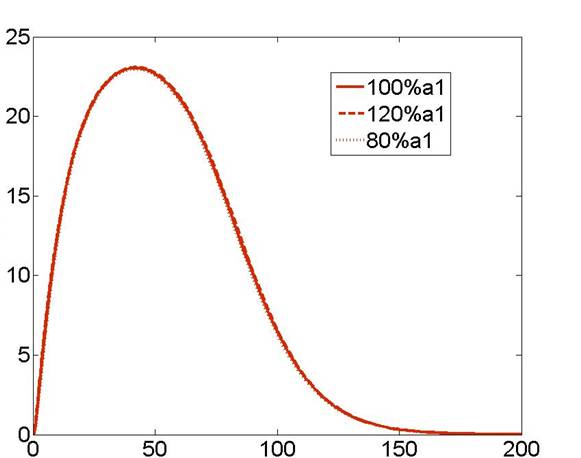
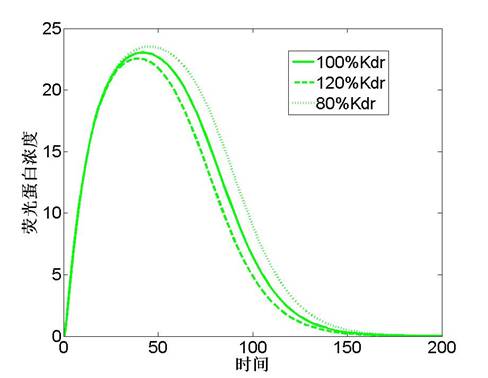
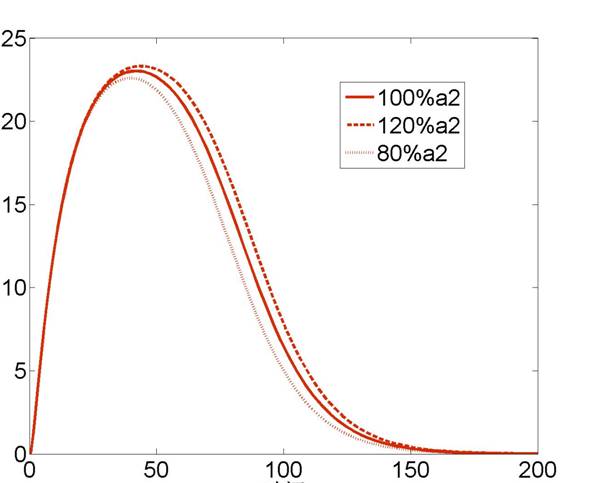
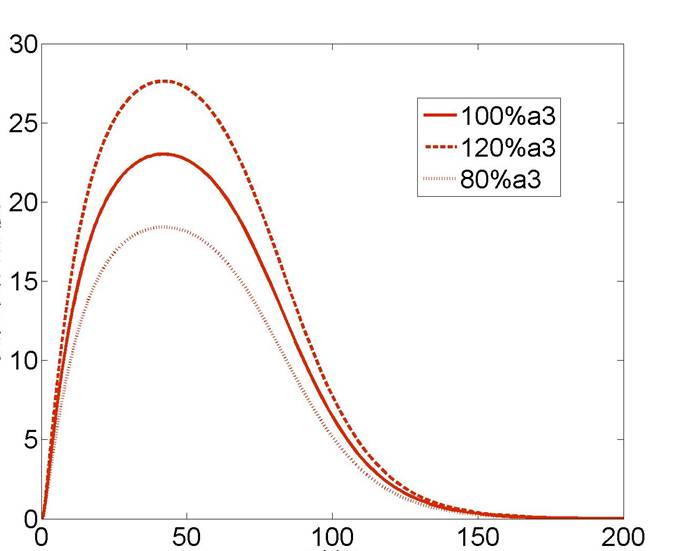
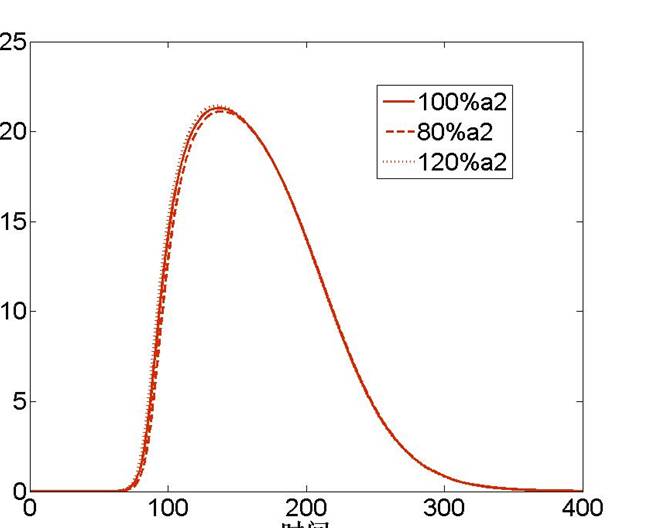
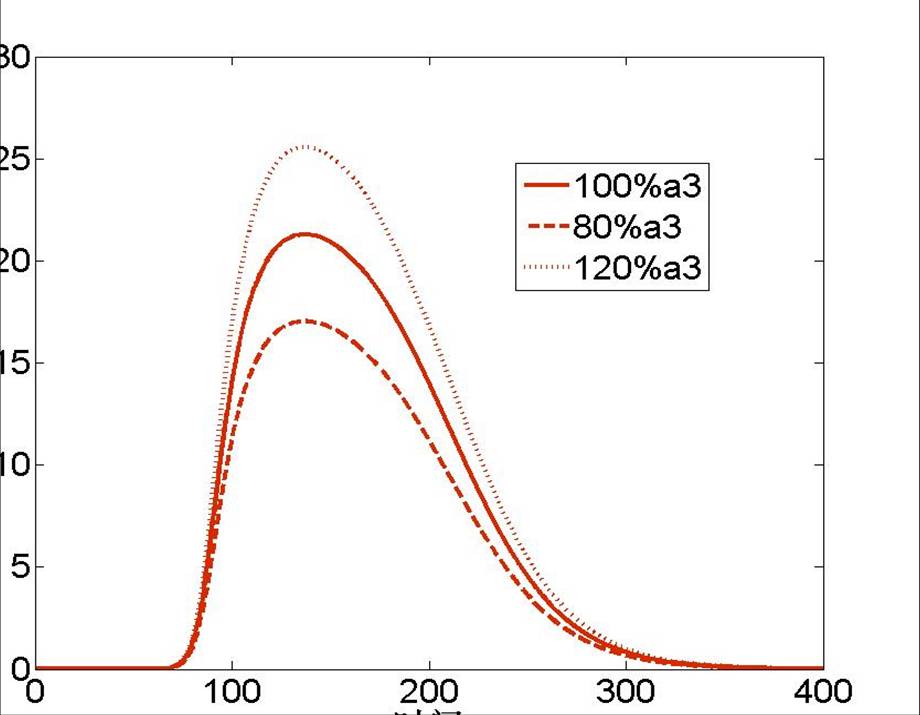
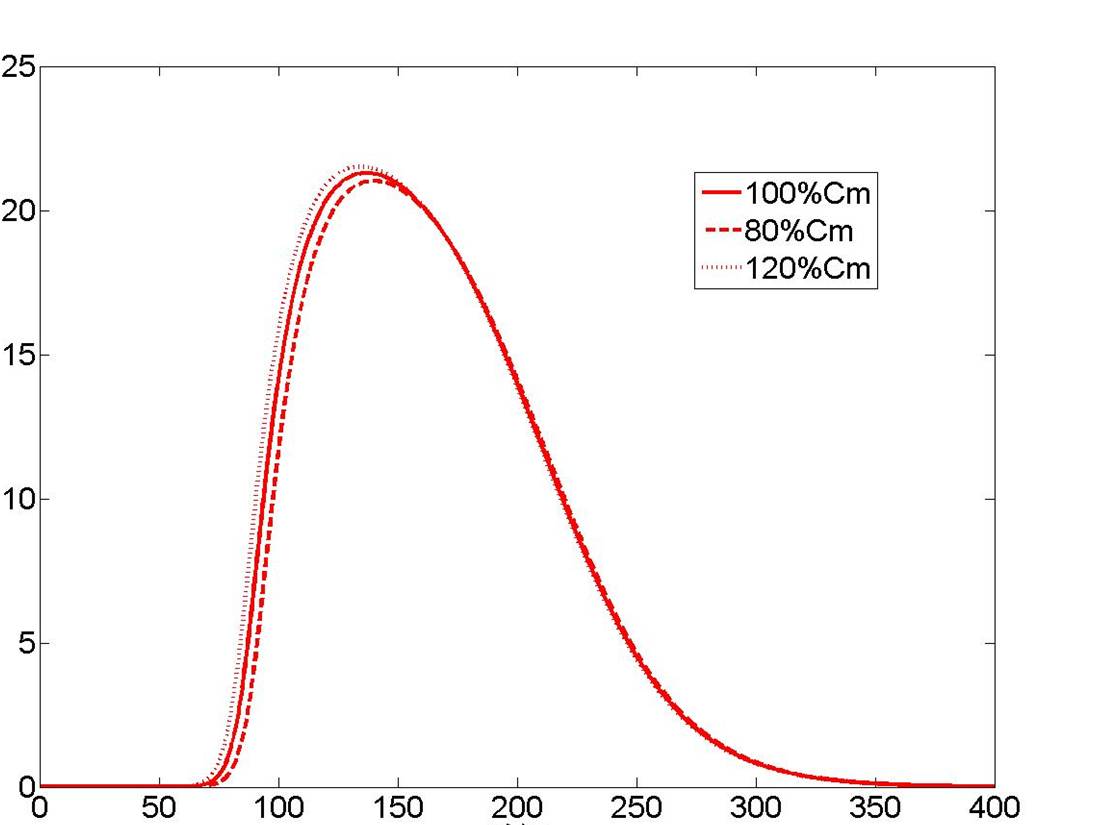
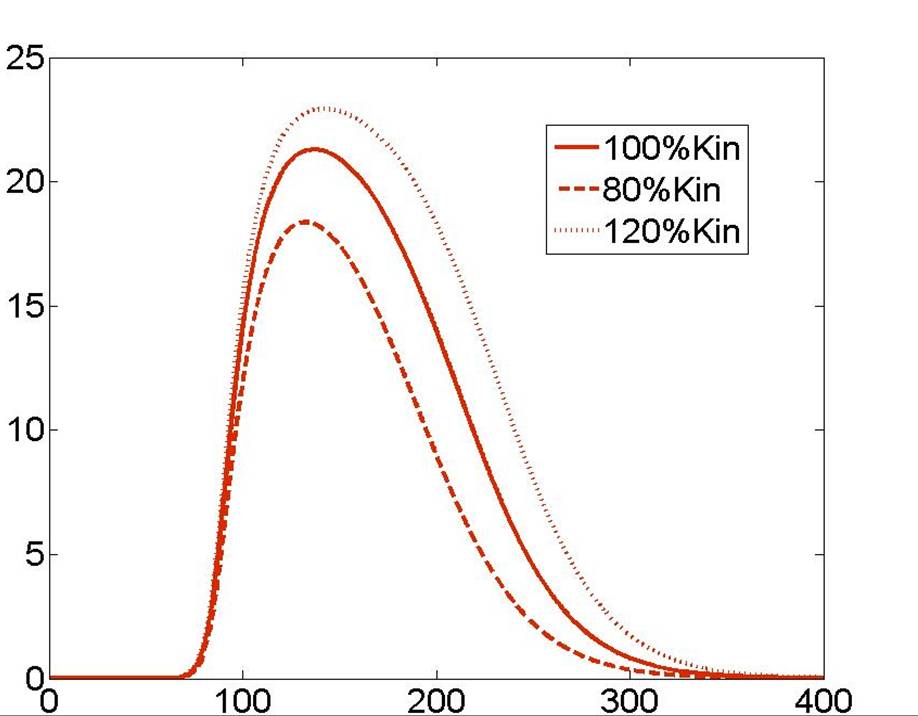
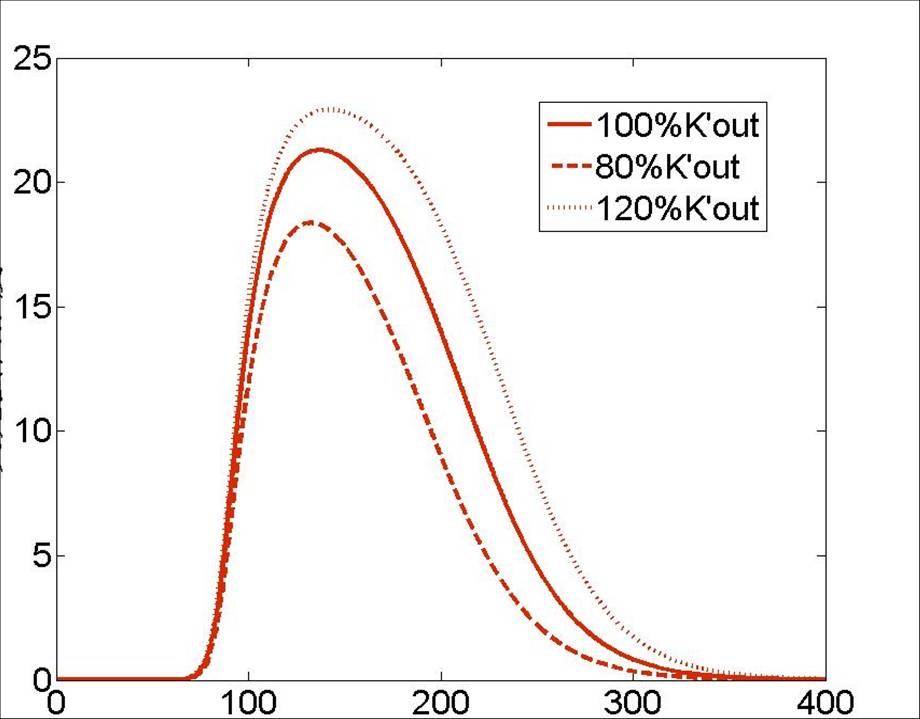
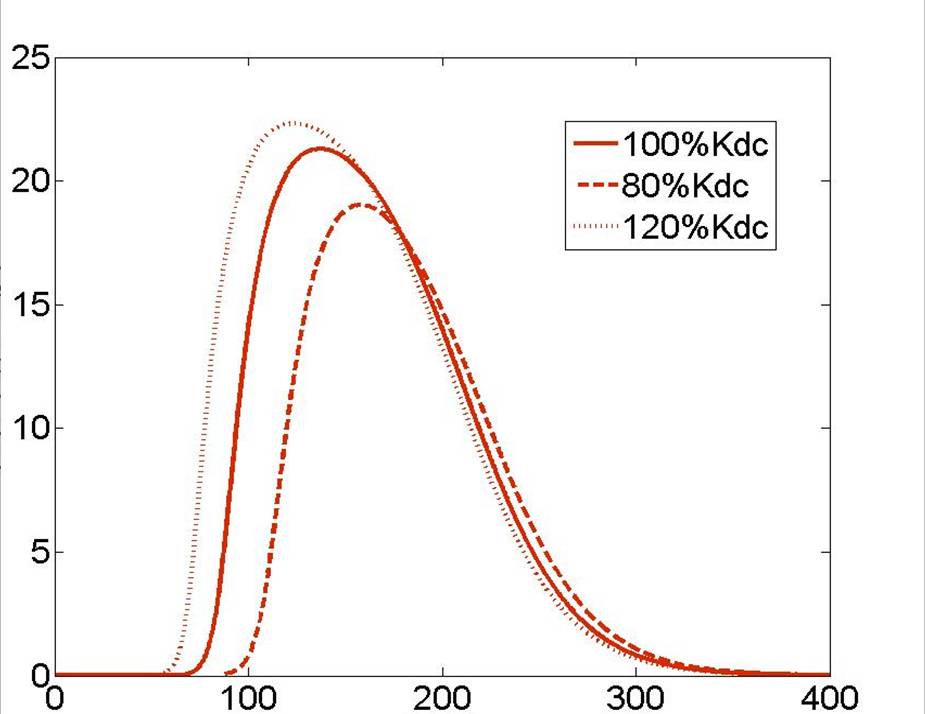
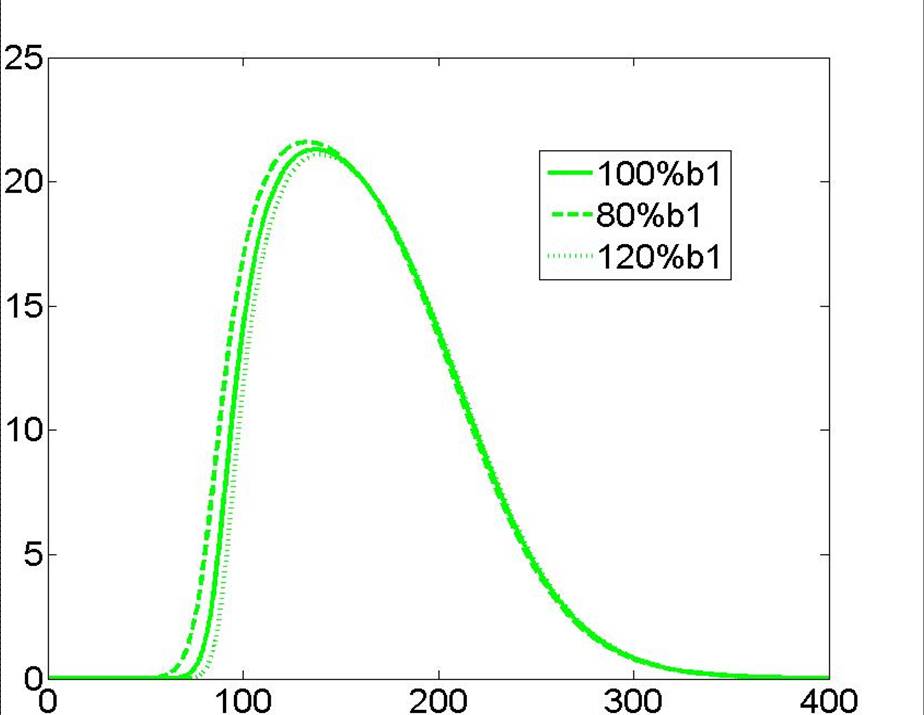
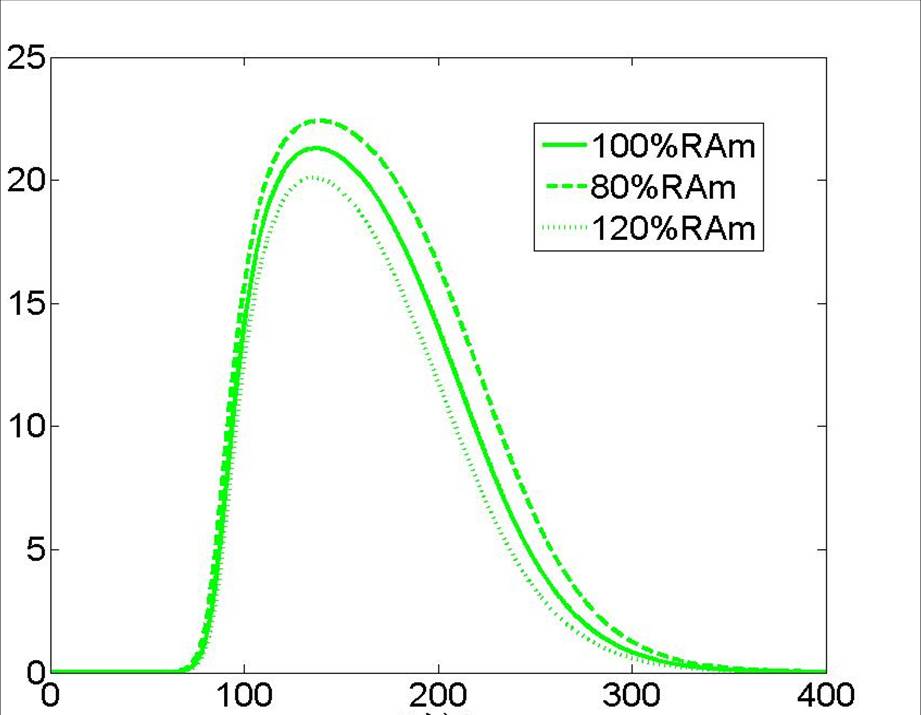
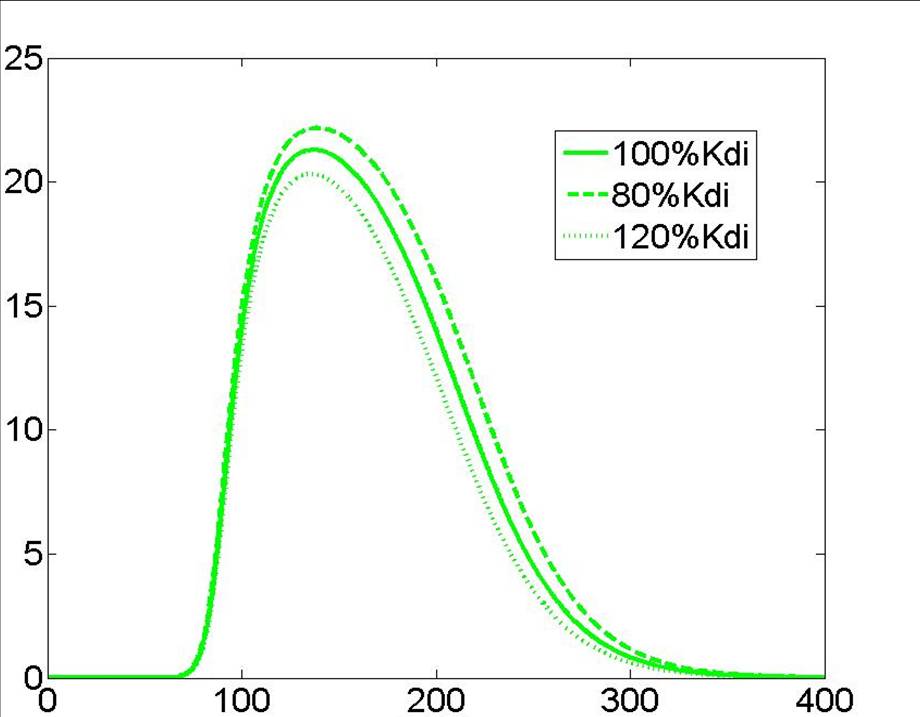
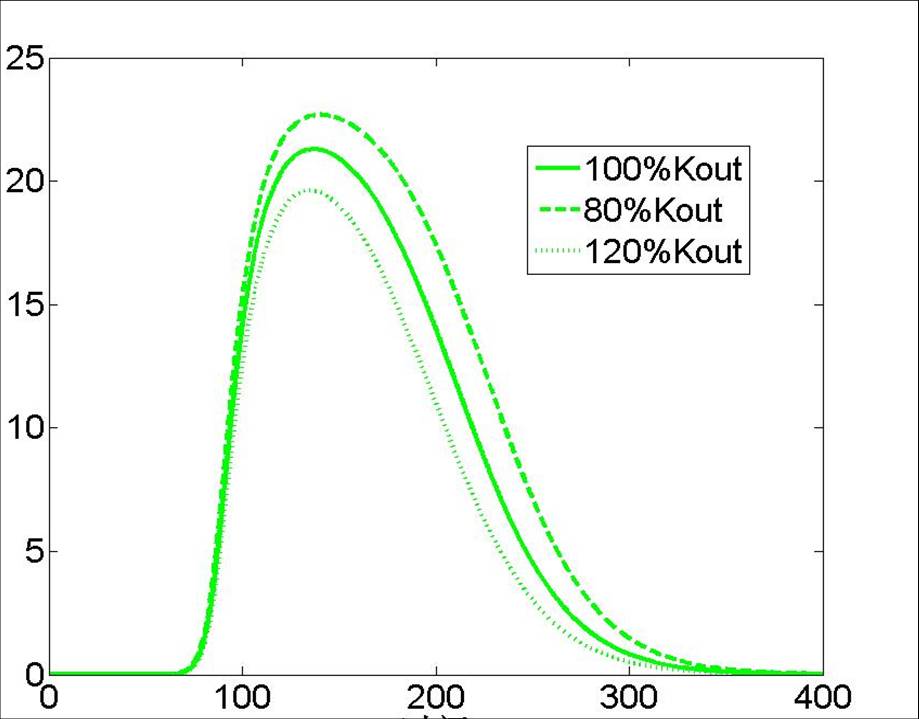
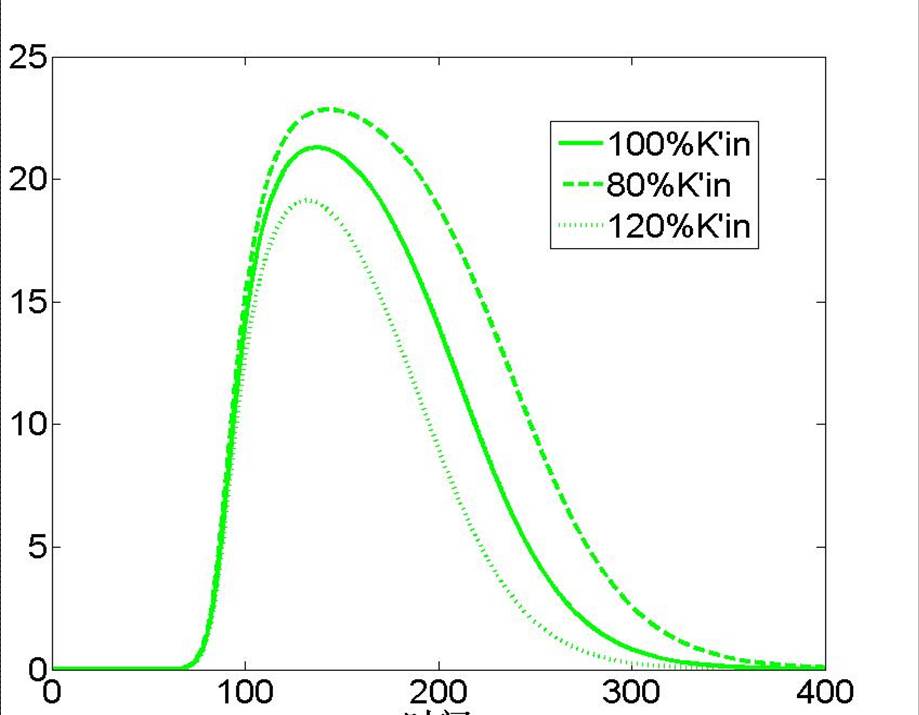
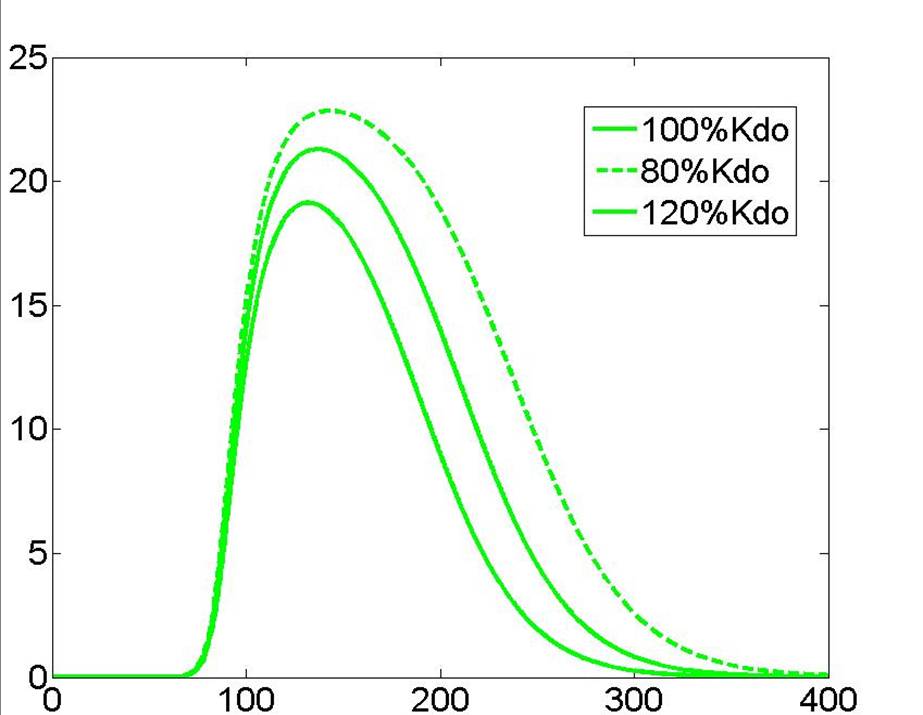
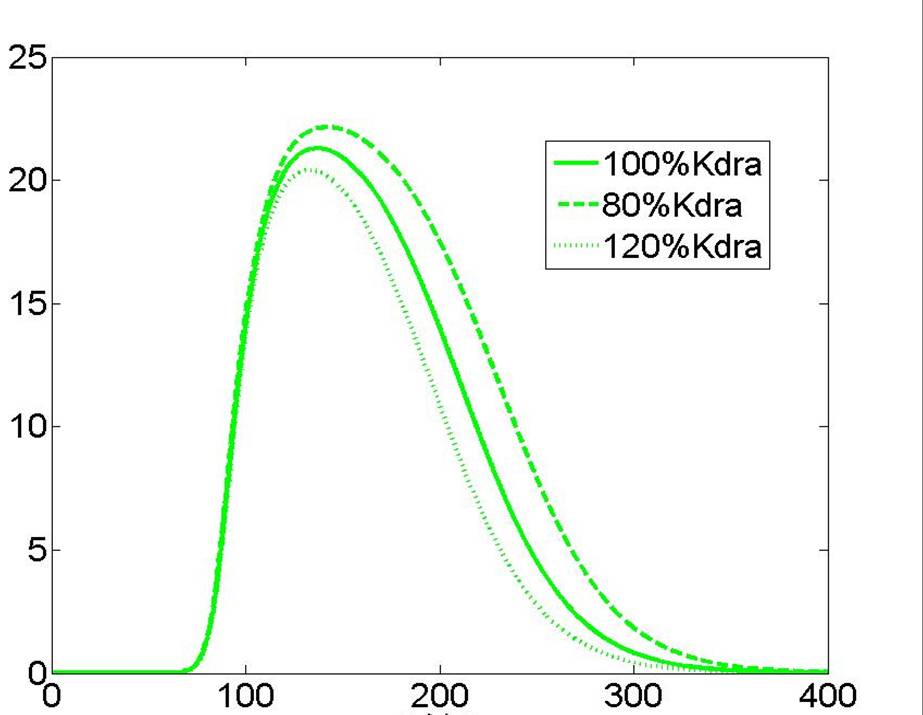
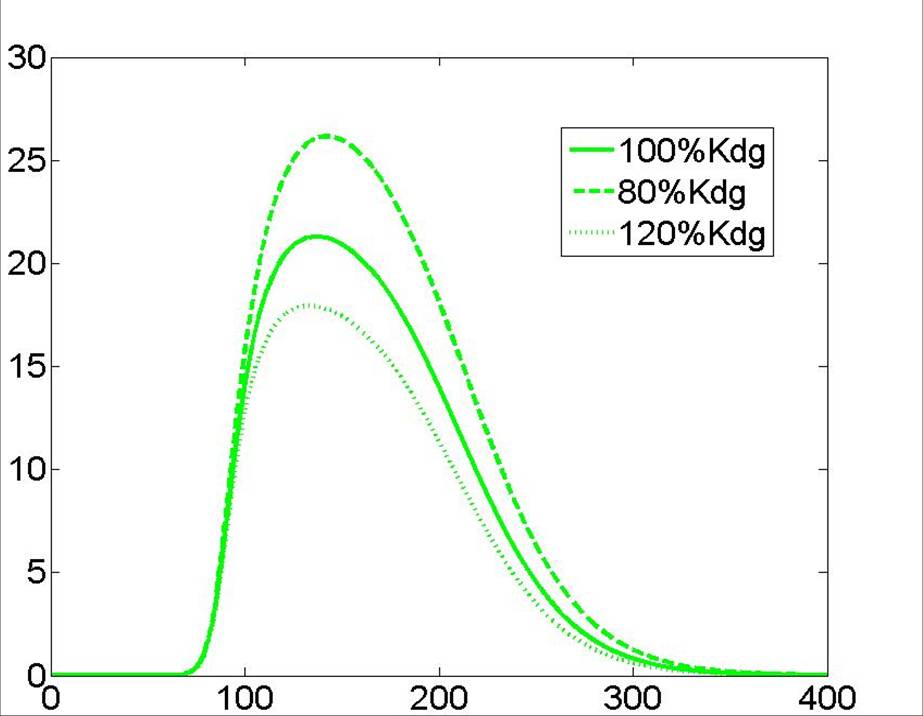
| - | [[Image:tjumodelff301.jpg| | + | The influences of diverse parameters on the output signal represented by the integral peak value of fluorescence have been analyzed. In this sensitivity analysis, values of parameters are adjusted by 10% and 20% both under the conditions of positive-biased as well as negative-biased to test their effects on the output signals. |
| - | [[Image:tjumodelff302.jpg| | + | <table width="99%" cellpadding="0" cellspacing="5" style="padding: 10px; background-color: #FFFF99"> |
| + | <tr> | ||
| + | <td>[[Image:tjumodelff304.jpg|400px]]<br></td> | ||
| + | <td>[[Image:tjumodelff305.jpg|435px]]<br></td> | ||
| + | </tr></table> | ||
| + | The promoter I controlling the production of AHL and promoter II controlling the production of LuxR protein tend to have most important roles in the whole system. The first graph depicts the condition of positive-biased and the second is the condition of negative-biased. | ||
| + | <table width="99%" cellpadding="0" cellspacing="5" style="padding: 10px; background-color: #FFFF99"> | ||
| + | <tr> | ||
| + | <td>[[Image:tjumodelff301.jpg|400px]]<br></td> | ||
| + | <td>[[Image:tjumodelff302.jpg|400px]]<br></td> | ||
| + | </tr></table> | ||
| + | |||
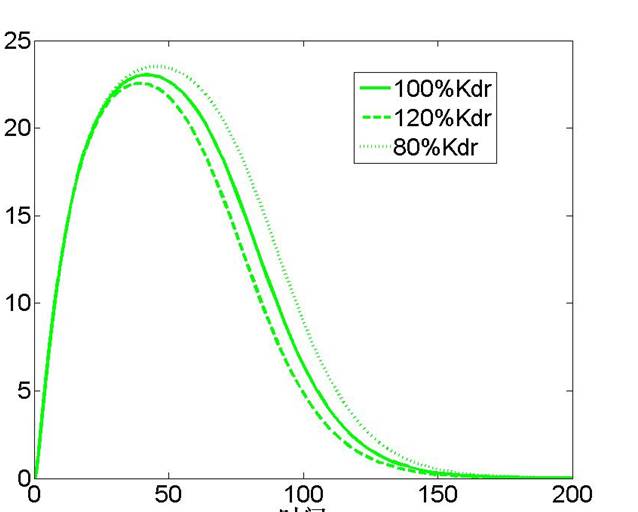
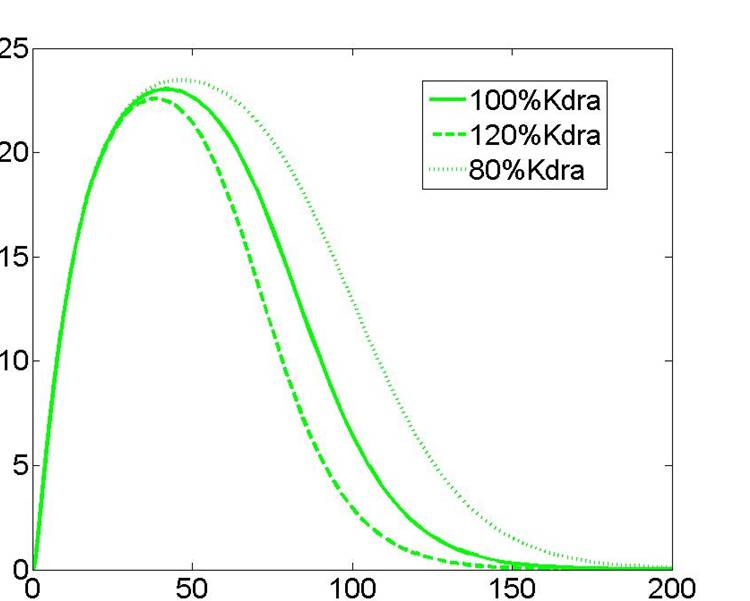
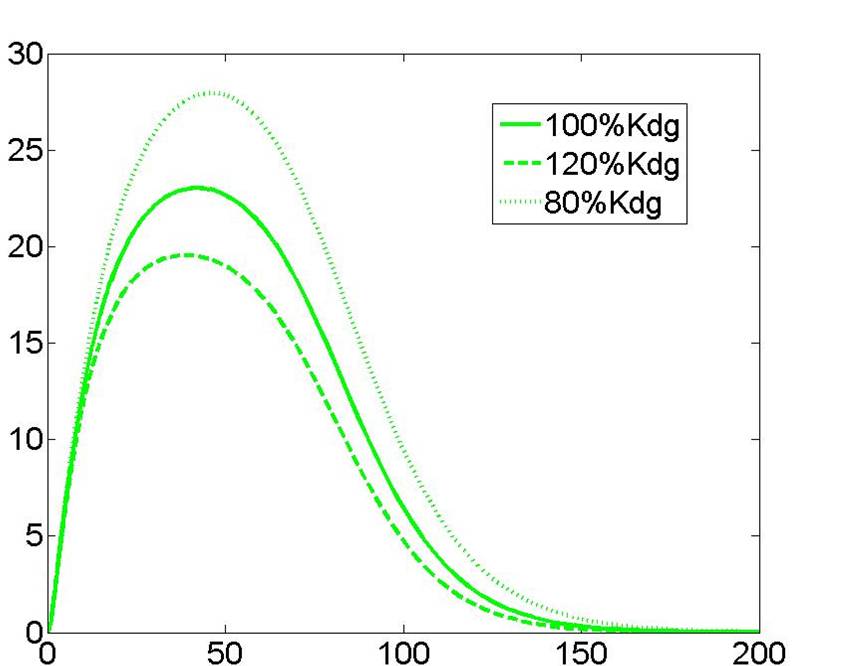
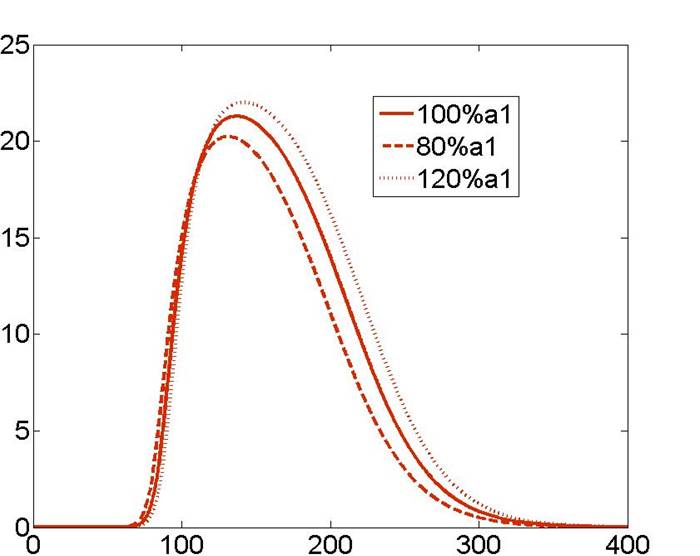
| + | The following images describe the influences of other possible parameters on the Flip-Flop system. The first seven images are the condition of positive-biased in which green curves means the negative effects and red curves means positive effects. The rest images are the condition of negative-biased. | ||
<gallery> | <gallery> | ||
Image:tjumodelff306.jpg | Image:tjumodelff306.jpg | ||
| Line 12: | Line 24: | ||
Image:tjumodelff311.jpg | Image:tjumodelff311.jpg | ||
Image:tjumodelff312.jpg | Image:tjumodelff312.jpg | ||
| - | + | ||
</gallery> | </gallery> | ||
| + | <br> | ||
<gallery> | <gallery> | ||
Image:tjumodelff314.jpg | Image:tjumodelff314.jpg | ||
| Line 29: | Line 42: | ||
Image:tjumodelff326.jpg | Image:tjumodelff326.jpg | ||
Image:tjumodelff327.jpg | Image:tjumodelff327.jpg | ||
| - | + | Image:tjumodelff328.jpg | |
| - | + | ||
</gallery> | </gallery> | ||
|} | |} | ||
| + | |||
| + | == Headline text == | ||
