July 6
From 2007.igem.org
(→Experiments) |
(→Analysis) |
||
| (2 intermediate revisions not shown) | |||
| Line 6: | Line 6: | ||
| - | * Open Loop [ | + | * Open Loop [Ee] |
i) Cells were transferred to 50 mL Glu M9 in 250 mL flask with [aTc]=50 ng/mL and inoculum=1,0.1 uL/mL | i) Cells were transferred to 50 mL Glu M9 in 250 mL flask with [aTc]=50 ng/mL and inoculum=1,0.1 uL/mL | ||
| Line 42: | Line 42: | ||
'''Microscopy''' | '''Microscopy''' | ||
| - | * The open loop samples [ | + | * The open loop samples [Ee] were imaged and FACS was done. |
* The open loop samples [Cc] were imaged and FACS was done. | * The open loop samples [Cc] were imaged and FACS was done. | ||
| Line 206: | Line 206: | ||
| | | | ||
|} | |} | ||
| - | {|align="center" width=" | + | {|align="center" width="37%" |
|- | |- | ||
|align="justify"|These values, obtained from the microscopy experiments, give us a clear idea of the equivalence between luxI.CFP and luxI.YFP. | |align="justify"|These values, obtained from the microscopy experiments, give us a clear idea of the equivalence between luxI.CFP and luxI.YFP. | ||
Latest revision as of 15:22, 18 August 2007
Back to Bangalore
Back to e-Notebook
Experiments
- Open Loop [Ee]
i) Cells were transferred to 50 mL Glu M9 in 250 mL flask with [aTc]=50 ng/mL and inoculum=1,0.1 uL/mL
ii) K12Z1 was inoculated in 5 mL Glu M9 in 50 mL tube with [aTc]=50 ng/mL and inoculum=1,0.1 uL/mL
iii) pL.LuxR.Y.pR.C, K12z1, pL.Y were inoculated in LB
iv) The contents of the flask with OD=0.217 were filtered out.
v) 7 dilutions were made (full range of IPTG conc) for pL.LuxR.Y.pR.C with AI from 50 ng/mL aTc and new 2xM9 in 1:1 ratio.
- Open Loop [Cc]
i) Cells were transferred to 50 mL Glu M9 in 250 mL flask with [aTc]=5 ng/mL and inoculum=1,0.1 uL/mL
ii) K12z1 was inoculated in 5 mL Glu M9 in 50 mL tube with [aTc]=5 ng/mL and inoculum=1,0.1 uL/mL
iii) pL.LuxR.Y.pR.C, K12z1, pL.Y were inoculated in LB.
iv) The contents of the flask with OD=0.103 were filtered out.
v) 7 dilutions over the full range of IPTG were made for pL.LuxR.Y.pR.C with AI from 5 ng/mL aTc and new 2xM9 in 1:1 ratio
- Control experiments:
- -ve control: K12z1
- Inoculated positive control:
- pL.YFP; 1xGlu M9; 500 uM IPTG
- I726081; K12Z1 in aTc (50 ng/mL) medium and new 2xGlu M9 in 1:1 ratio; 500 uM IPTG
- I726081; only new 1xGlu M9; 500 uM IPTG
Microscopy
- The open loop samples [Ee] were imaged and FACS was done.
- The open loop samples [Cc] were imaged and FACS was done.
- The open loop samples [Dd] were imaged and FACS was done.
Analysis
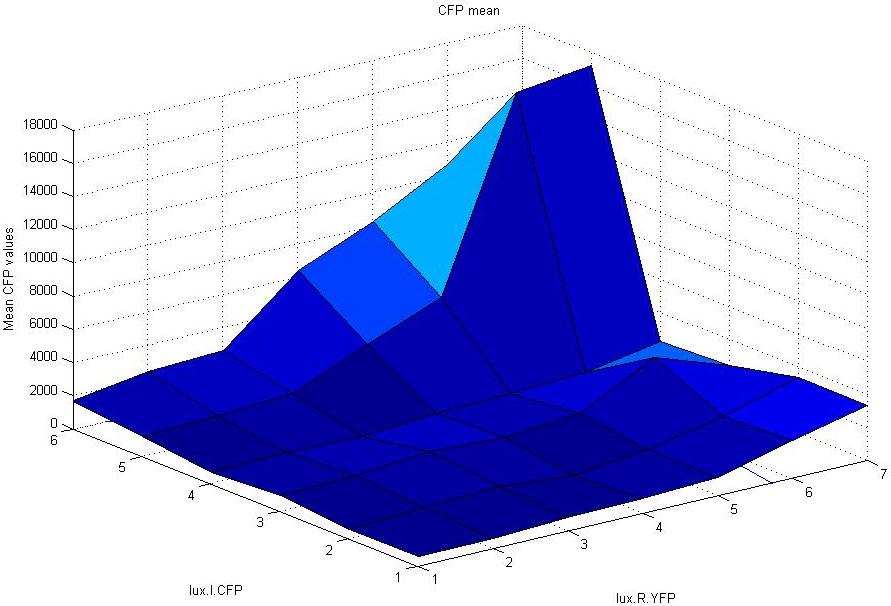
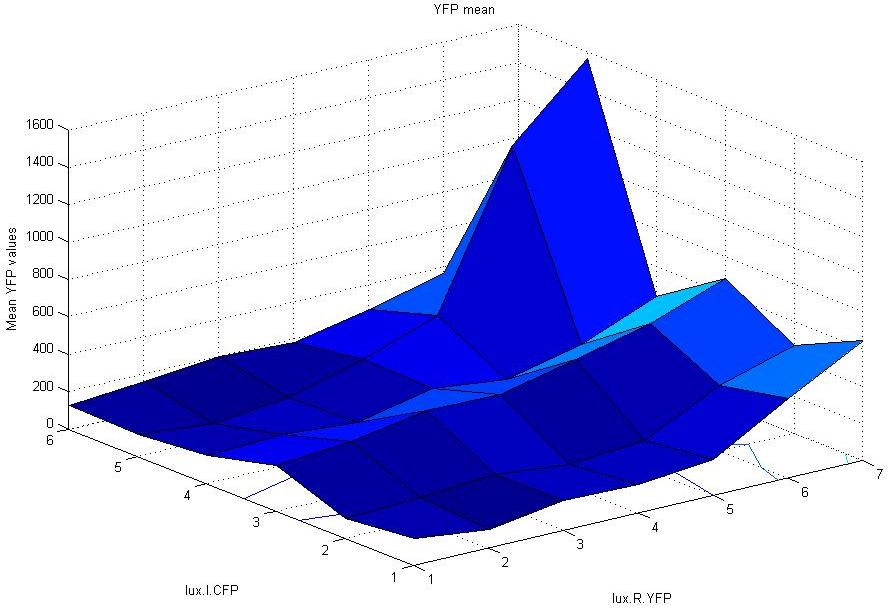
Today we compiled the data collected from all our open-loop experiments performed at various concentrations of aTc (ng/ml). The following matrix of information was obtained:
|
CFP mean values |
IPTG (uM) or luxR.YFP | |||||||
|---|---|---|---|---|---|---|---|---|
| 0 | 5 | 10 | 50 | 100 | 500 | 1000 | ||
|
aTc (ng/ml) or luxI.CFP | 0 | |||||||
| 1 | ||||||||
| 5 | ||||||||
| 10 | ||||||||
| 20 | ||||||||
| 50 | ||||||||
|
YFP mean values |
IPTG (uM) or luxR.YFP | |||||||
|---|---|---|---|---|---|---|---|---|
| 0 | 5 | 10 | 50 | 100 | 500 | 1000 | ||
|
aTc (ng/ml) or luxI.CFP | 0 | |||||||
| 1 | ||||||||
| 5 | ||||||||
| 10 | ||||||||
| 20 | ||||||||
| 50 | ||||||||
| These values, obtained from the microscopy experiments, give us a clear idea of the equivalence between luxI.CFP and luxI.YFP.
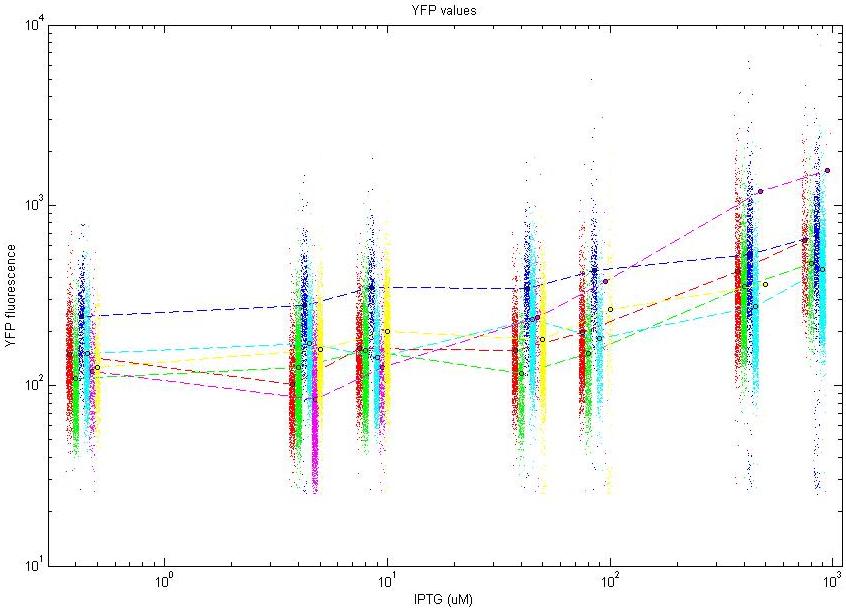
A scatter plot with each dot representing a cell was also plotted to see the variation of fluorescence with the change in aTc and IPTG concentrations.
|
| CFP Fluorescence | YFP Fluorescence |
|---|---|
|
Surface plots : The increasing values along the luxI.CFP axis are the increasing concentrations of aTc whereas the increasing values along the luxR.YFP axis are the increasing concentrations of IPTG. | |


