ETHZ/Simulations
From 2007.igem.org
m (→Model Parameters: aTc,TetR) |
(→Model Parameters) |
||
| Line 109: | Line 109: | ||
|- | |- | ||
| d<sub>L</sub> | | d<sub>L</sub> | ||
| - | | | + | | 1e-3 - 1e-4 [per sec] |
| degradation of luxR | | degradation of luxR | ||
| + | | Ref: A.B. Goryachev et al. (2006) BioSystems 83:178-187 | ||
|- | |- | ||
| d<sub>Q<sub>1</sub></sub> | | d<sub>Q<sub>1</sub></sub> | ||
| - | | 7e-4 [ | + | | 7e-4 [per sec] |
| degradation of cI | | degradation of cI | ||
| Ref arm1998 Genetics 149:1633-1648 | | Ref arm1998 Genetics 149:1633-1648 | ||
Revision as of 12:29, 27 September 2007
Contents |
Basic Model
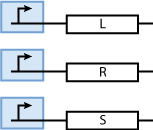
Constitutively produced proteins
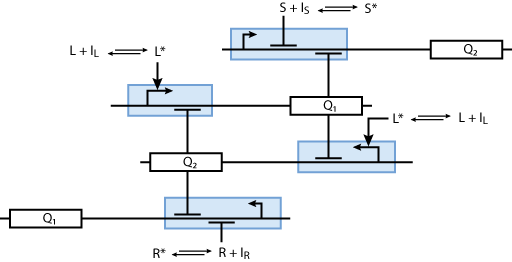
Learning system
Reporter system
System Equations
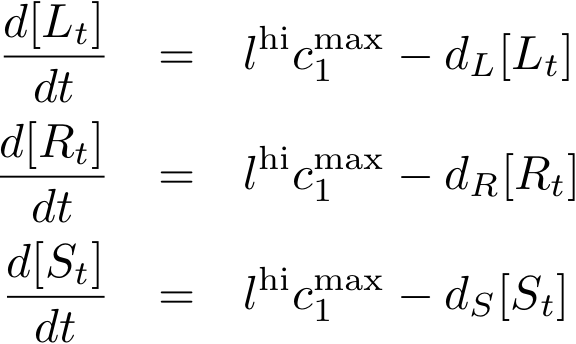
Constitutively produced proteins
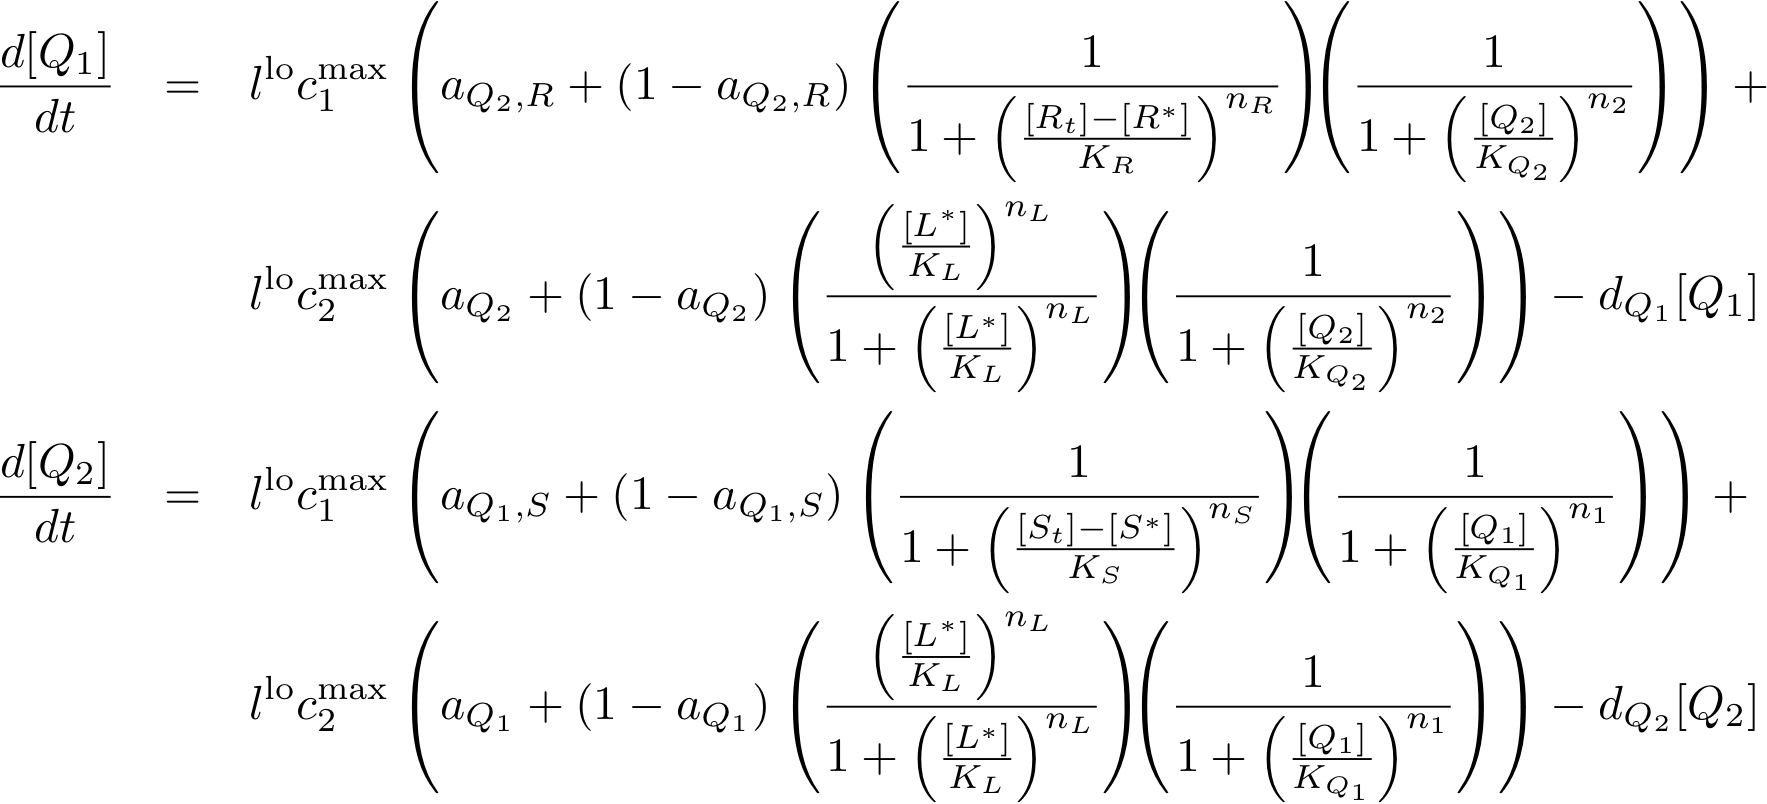
Learning system
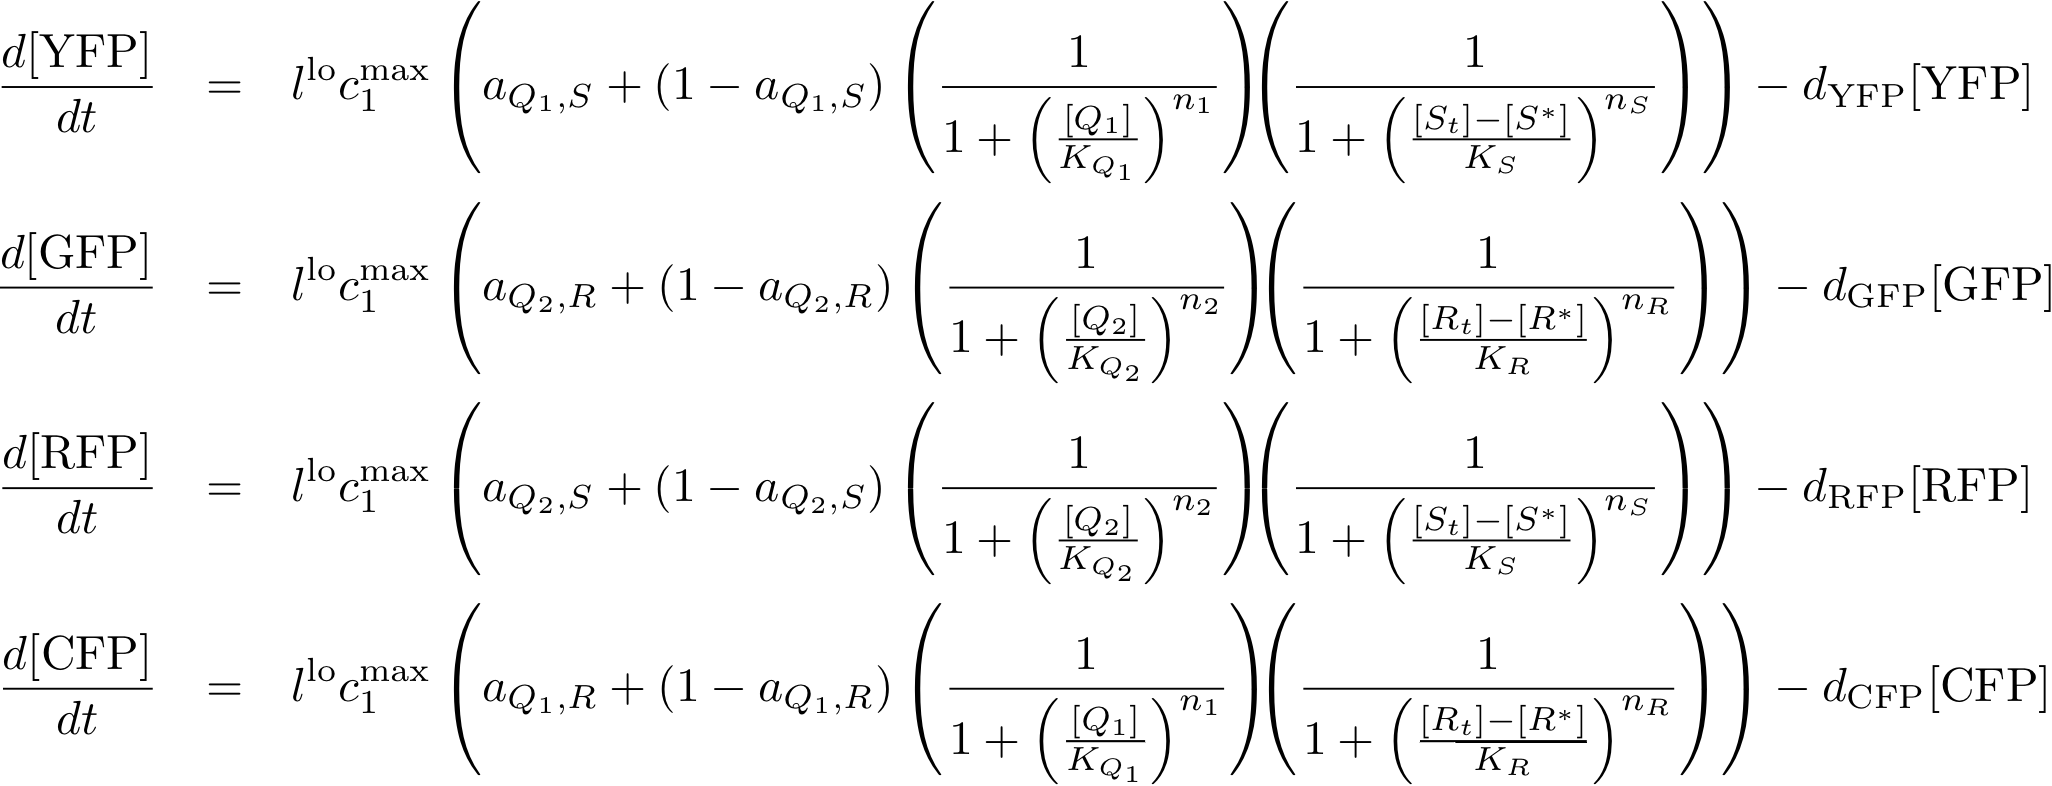
Reporter system
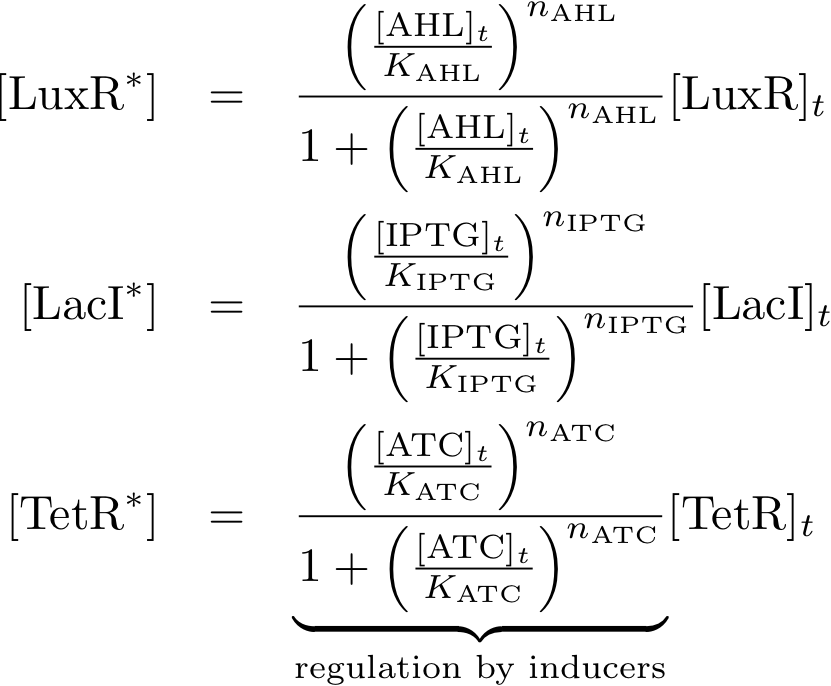
Allosteric regulation
Comments
Note that the three constitutively produced proteins R, S and L exist in two different forms: as free proteins and in complexes they build with IR, IS and IL, respectively. The total amount of protein is denoted with a subscript t (e.g. Rt) in the above formulas. The amount of protein existing as complex is denoted with a superscript * (e.g. R*). The difference is the amount of free protein (e.g. Rt - R*).
In this new formulation of the model equations, the characterization is more amenable to human interpretation (although equivalent to the previous formuation). The promoters are now characterized by their maximum transcription rate (cimax) and the basic production (aX), which gives the 'leakage' if the gene is fully inhibited. Note that in the given mathematical formulation the basic production is specified as a percentage of the max. transcription rate and is therefore unitless.
The max. transcription rate is given per gene (as agreed with Sven during the meeting at Sep 20.). This means that to get the total transcription rate we need to multiply with the number of gene copies per cell which is represented as llo/lhi in the model equations.
Model Parameters
| Parameter | Value | Description | Comments |
|---|---|---|---|
| c1max | max. transcription rate of constitutive promoter (per gene) | promoter no. J23105 | |
| c2max | max. transcription rate of luxR-activated promoter (per gene) | ||
| lhi | 25 | high-copy plasmid number | Reference: Svens estimate ;-) |
| llo | 5 | low-copy plasmid number | Reference: Svens estimate ;-) |
| aQ2,R | 0.1 - 0.2 | basic production of Q2/R-inhibited genes | Reference: discussion with Jörg and Sven |
| aQ2 | 0.1 - 0.2 | basic production of Q2-inhibited genes | Reference: discussion with Jörg and Sven |
| aQ1,S | 0.1 - 0.2 | basic production of Q1/S-inhibited genes | Reference: discussion with Jörg and Sven |
| aQ1 | 0.1 - 0.2 | basic production of Q1-inhibited genes | Reference: discussion with Jörg and Sven |
| aQ2,S | 0.1 - 0.2 | basic production of Q2/S-inhibited genes | Reference: discussion with Jörg and Sven |
| aQ1,R | 0.1 - 0.2 | basic production of Q1/R-inhibited genes | Reference: discussion with Jörg and Sven |
| dR | 2.31e-3 [pro sec] | degradation of lacI | Tuttle et al. (2005) Biophys J 89(6):3873 |
| dS | 1e-5 [pro sec]/2.31e-3 [pro sec] | degradation of tetR | Ref bs2000 Nature 405:590-593/Tuttle et al. (2005) Biophys J 89(6):3873 |
| dL | 1e-3 - 1e-4 [per sec] | degradation of luxR | Ref: A.B. Goryachev et al. (2006) BioSystems 83:178-187 |
| dQ1 | 7e-4 [per sec] | degradation of cI | Ref arm1998 Genetics 149:1633-1648 |
| dQ2 | degradation of p22cII | ||
| dYFP | 6.3e-3 [per min] | degradation of YFP | suppl. mat. to Colman-Lerner et al. (2001) Cell 107:739-759 cooresponding to a half life of 110min |
| dGFP | 6.3e-3 [per min] | degradation of GFP | in analogy to YFP |
| dRFP | 6.3e-3 [per min] | degradation of RFP | in analogy to YFP |
| dCFP | 6.3e-3 [per min] | degradation of CFP | in analogy to YFP |
| KR | 1.3e-3 - 2e-3 [mM/h] | lacI repressor dissociation constant | lower value is from Ref. [2], higher value is from Ref. [5] |
| KIR | 1.5e-10 [mM/h] | IPTG-lacI repressor dissociation constant | Ref. [5] |
| KS | 5.6 (+-2) [nM-1] | tetR repressor dissociation constant | Ref. [1] Note: This is for heptameric operator. Check if this is what we have. |
| KIS | 1120 (+-400) [nM-1] | aTc-tetR repressor dissociation constant | Ref. [1] and Ref. [3]. According to Ref. [3], ratio between tetR repressor dissociation constant and aTc-tetR repressor dissociation constant is 0.4/80. |
| KL | luxR activator dissociation constant | ||
| KIL | AHL-luxR activator dissociation constant | ||
| KQ1 | 2e-3 [mM/h] | cI repressor dissociation constant | Ref. [5] |
| KQ2 | p22cII repressor dissociation constant | ||
| nR | 1 | lacI repressor Hill cooperativity | Ref. [5] |
| nIR | 2 | IPTG-lacI repressor Hill cooperativity | Ref. [5] |
| nS | 3 | tetR repressor Hill cooperativity | Ref. [3] |
| nIS | 2 (1.5-2.5) | aTc-tetR repressor Hill cooperativity | Ref. [3] |
| nL | 1 | luxR activator Hill cooperativity | Ref. [3] |
| nIL | 1 | AHL-luxR activator Hill cooperativity | Ref. [3] |
| nQ1 | 1.9 | cI repressor Hill cooperativity | Ref. [5] |
| nQ2 | p22cII repressor Hill cooperativity |
References
- A synthetic time-delay circuit in mammalian cells and mice (http://www.pnas.org/cgi/content/abstract/104/8/2643)
- Detailed map of a cis-regulatory input function (http://www.pnas.org/cgi/content/full/100/13/7702?ck=nck)
- Parameter Estimation for two synthetic gene networks (http://ieeexplore.ieee.org/iel5/9711/30654/01416417.pdf)
- Supplementary on-line information for "A Synthetic gene-metabolic oscillator" (no link)
- Genetic network driven control of PHBV copolymer composition (http://doi:10.1016/j.jbiotec.2005.08.030)
Variable Mapping
| Variable | Compound |
|---|---|
| R | lacI |
| IR | IPTG |
| S | tetR |
| IS | aTc |
| L | luxR |
| IL | AHL |
| Q1 | cI |
| Q2 | p22cII |
