ETHZ/Simulation
From 2007.igem.org
(Difference between revisions)
| Line 1: | Line 1: | ||
| - | + | == Protocol == | |
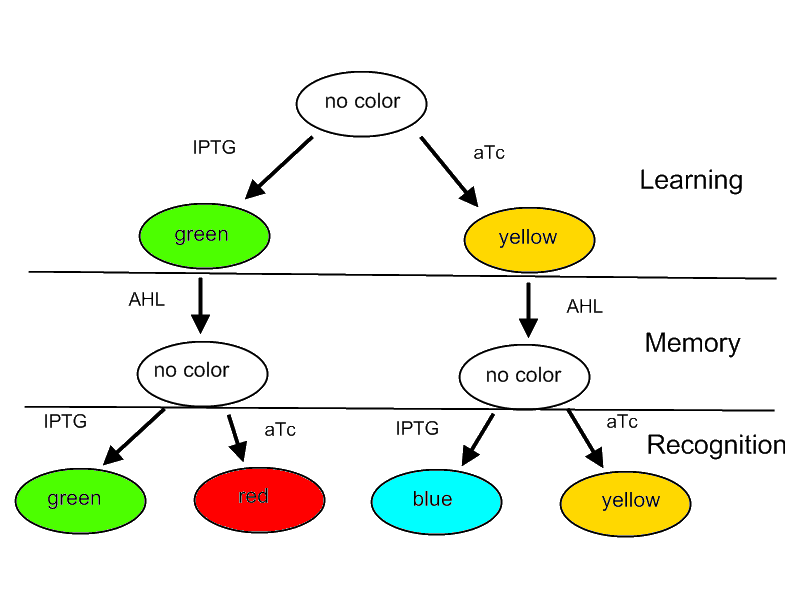
[[Image:ETHZFlowdiagram.png|center|thumb|Fig. 1: Flow diagram |480px]] | [[Image:ETHZFlowdiagram.png|center|thumb|Fig. 1: Flow diagram |480px]] | ||
| + | |||
| + | == Simulation of Test Cases == | ||
==== Test 1 ==== | ==== Test 1 ==== | ||
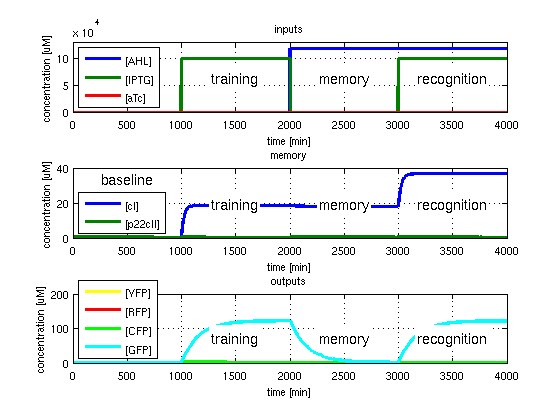
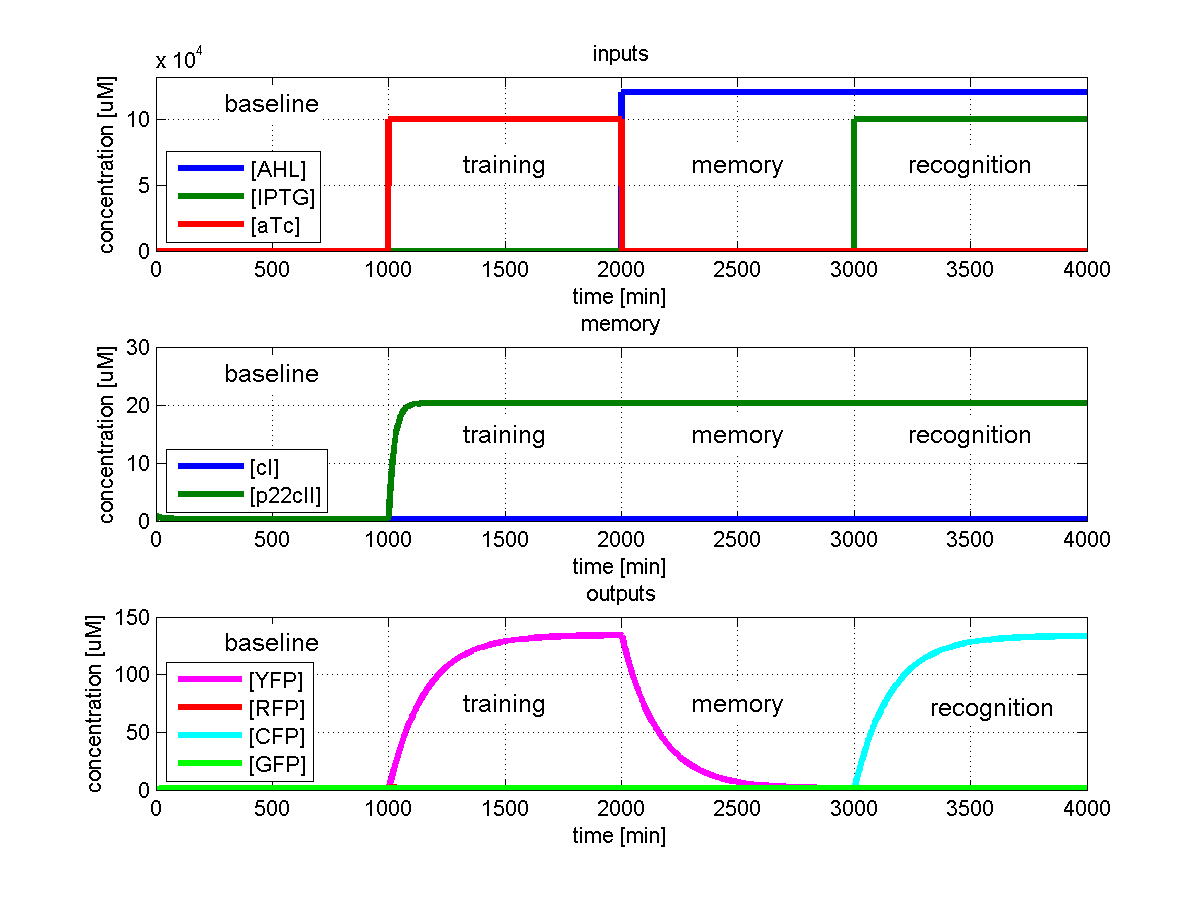
| - | [[Image:ETHZTest1.png|center|thumb|Test 1: learn and recognize IPTG |720px]] | + | [[Image:ETHZTest1.png|center|thumb|Fig 1: Test 1: learn and recognize IPTG |720px]] |
==== Test 2 ==== | ==== Test 2 ==== | ||
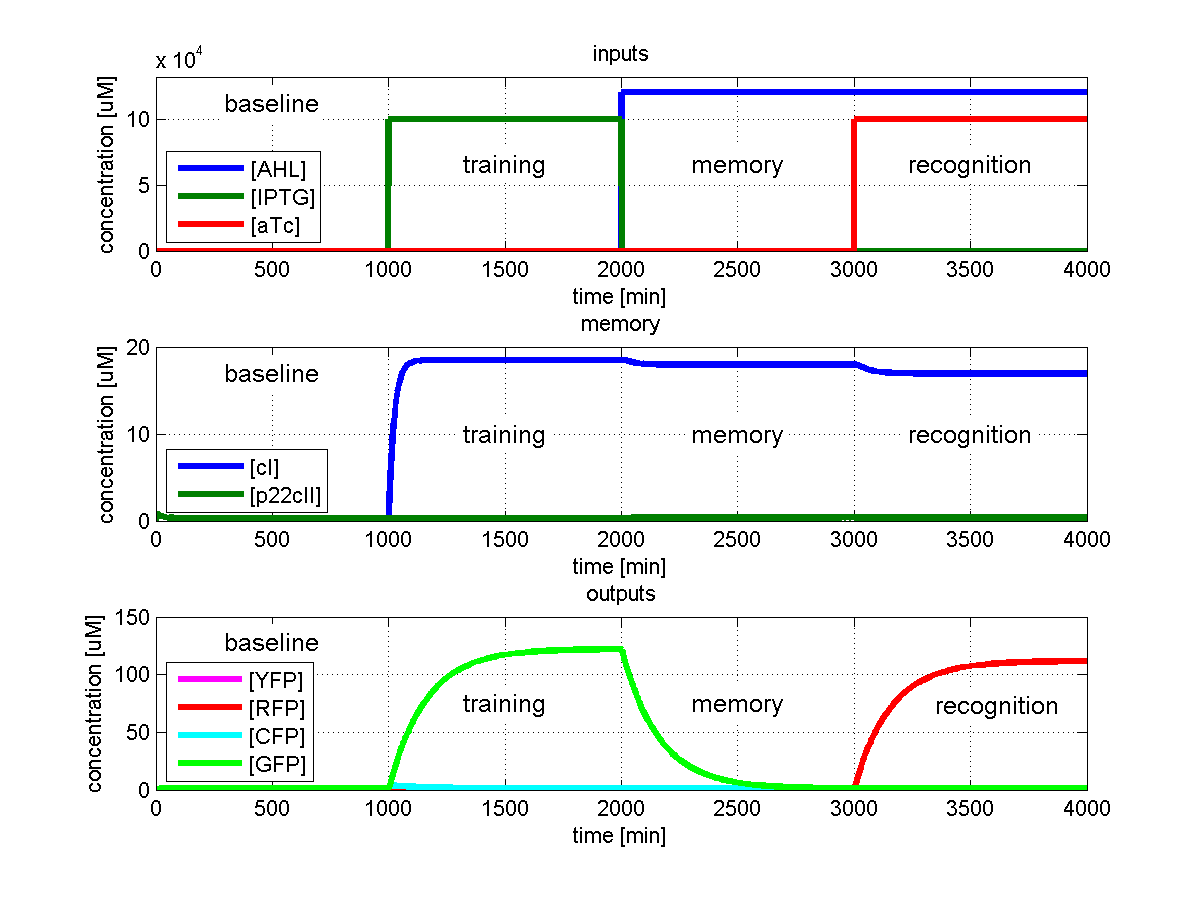
| - | [[Image:ETHZTest2.png|center|thumb|Test 1: learn IPTG and get tested for aTc |720px]] | + | [[Image:ETHZTest2.png|center|thumb|Fig 2: Test 1: learn IPTG and get tested for aTc |720px]] |
==== Test 3 ==== | ==== Test 3 ==== | ||
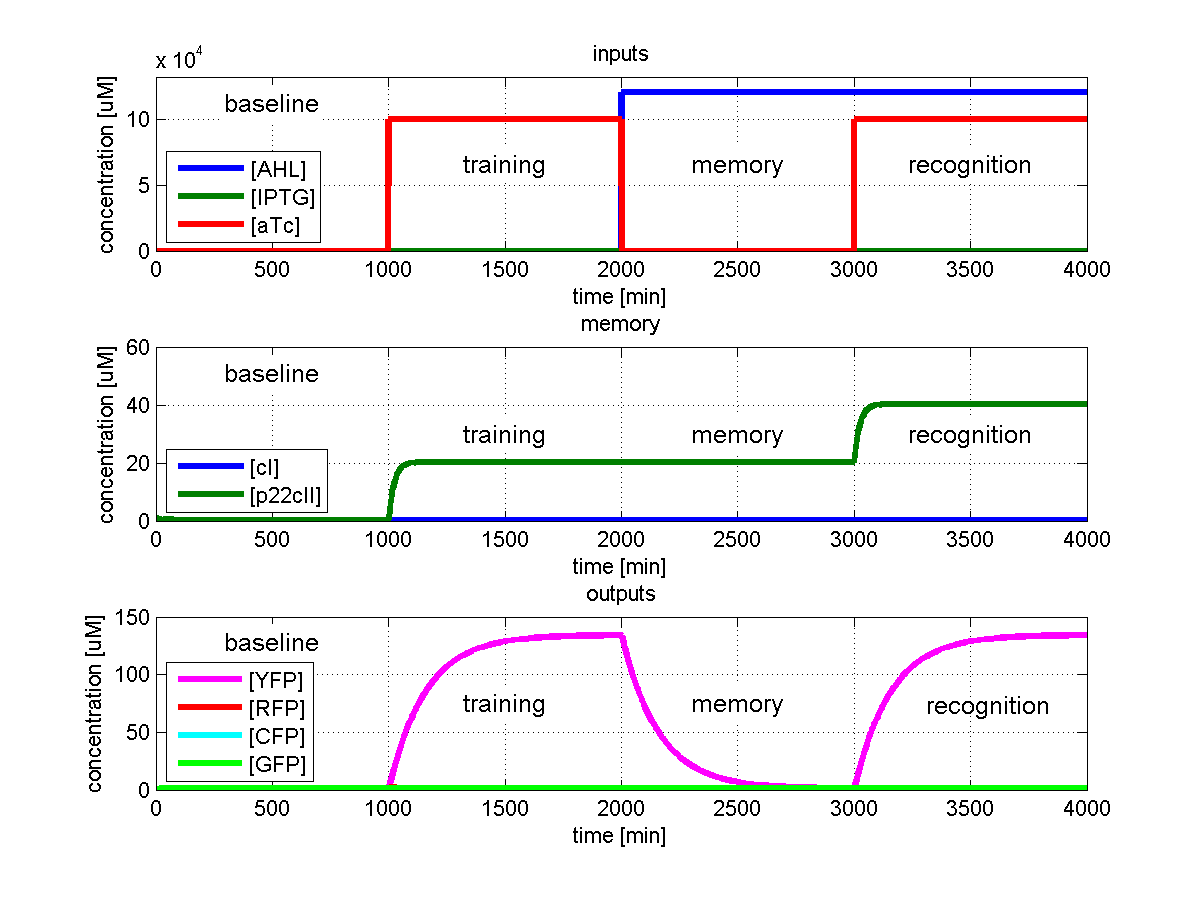
| - | [[Image:ETHZTest3.png|center|thumb|Test 1: learn and recognize aTc |720px]] | + | [[Image:ETHZTest3.png|center|thumb|Fig 3: Test 1: learn and recognize aTc |720px]] |
==== Test 4 ==== | ==== Test 4 ==== | ||
| - | [[Image:ETHZTest4.png|center|thumb|Test 1: learn aTc and get tested for IPTG |720px]] | + | [[Image:ETHZTest4.png|center|thumb|Fig 4: Test 1: learn aTc and get tested for IPTG |720px]] |
| + | |||
| + | == Sensitivity Analysis == | ||
| + | |||
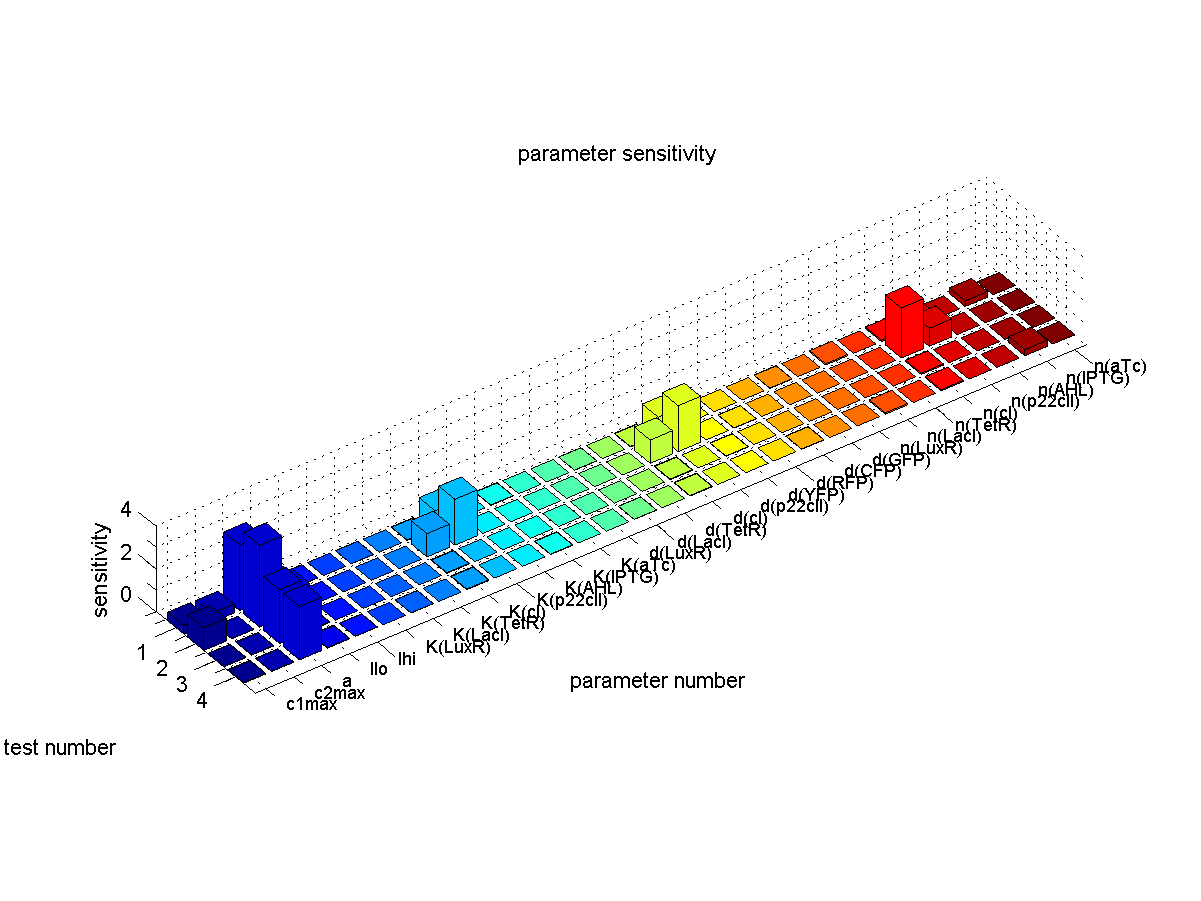
| + | For a system like our is is not enough to find a set of parameters for which it is working. To provide a stable performance also in the presence of noise and parameter missmatch we were interested in analysing the sensitivity of the system. | ||
| - | + | The results are plotted in Figure 5. | |
| - | [[Image:ETHZSensitivity.png|center|thumb|Sensitivity analysis |720px]] | + | [[Image:ETHZSensitivity.png|center|thumb|Fig. 5: Sensitivity analysis |720px]] |
Revision as of 11:25, 15 October 2007
Contents |
Protocol
Simulation of Test Cases
Test 1
Test 2
Test 3
Test 4
Sensitivity Analysis
For a system like our is is not enough to find a set of parameters for which it is working. To provide a stable performance also in the presence of noise and parameter missmatch we were interested in analysing the sensitivity of the system.
The results are plotted in Figure 5.
