Imperial/Wet Lab/Results/Res1.4
From 2007.igem.org
m (→Materials and methods) |
m (→Results) |
||
| Line 10: | Line 10: | ||
==Results== | ==Results== | ||
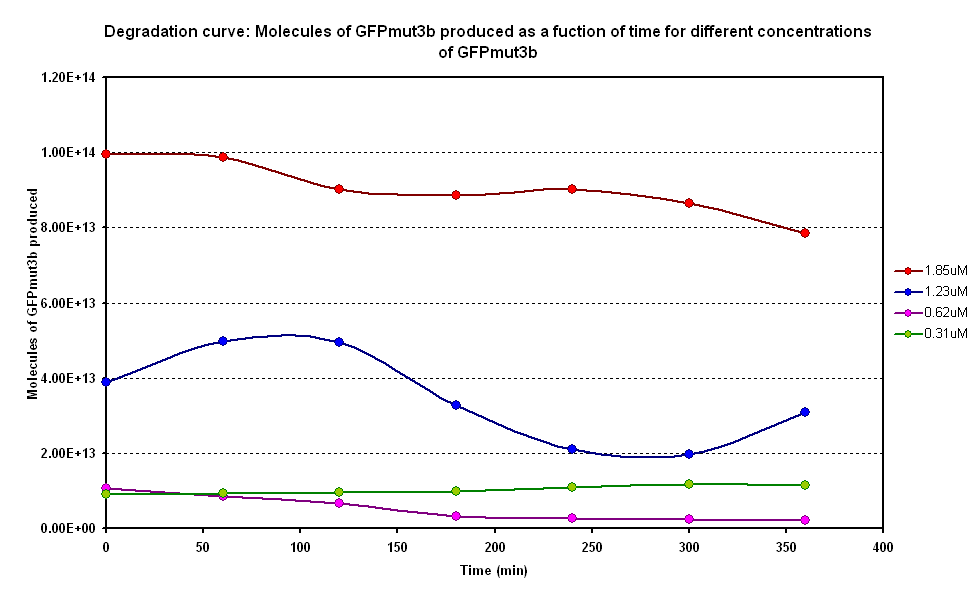
| - | [[Image:IC 2007 Degradation.PNG|left|thumb| | + | [[Image:IC 2007 Degradation.PNG|left|thumb|400px|Figure 1.1 Fluorescence vs time]] |
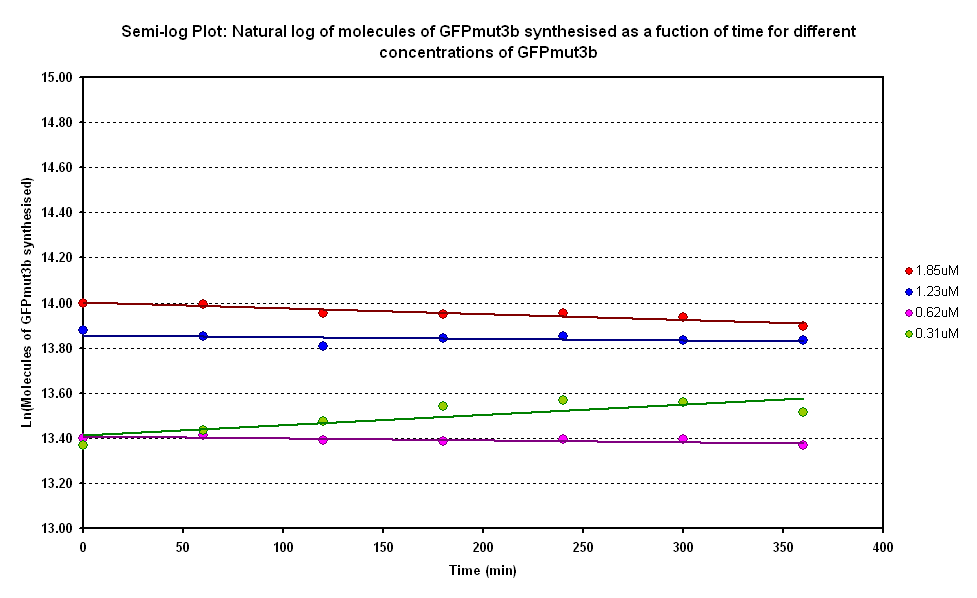
| - | [[Image:IC 2007 Degradation log.png|right|thumb| | + | [[Image:IC 2007 Degradation log.png|right|thumb|400px|Figure 1.2 Semi-log plot of fluorescence vs time]] |
| - | <br clear="all"> | + | <br clear="all"> |
==Conclusion== | ==Conclusion== | ||
Revision as of 22:32, 24 October 2007
Degradation Curve: Fluroescence of GFPmut3b as a function of time
Aims
To construct a degradation curve of GFPmut3b in the in vitro chassis. This will verify whether the degradation of the system would be a limiting factor to the expression of the system.
Materials and methods
Link to the Protocol
Results
Conclusion
The degradation constant was calculated from the semi-log plot. The average gradients of all the semi-log plots was -0.0003501. This is equivalent to a decay-constant of 0.0003501. Using the equation ln2/k = t1/2, the half-life of GFP was calculated to 1980 minutes, or approximately 33 hours. This agrees with the literature value of ~24 hours. So for our experimental timescale of 6 hours, we would only observe 12% of our GFP to be degraded. This supports our assumption that the degradation of GFP is very small within the timescale of our experiments.
Raw Data

