Tianjin/FLIP-FLOP/Model11

From 2007.igem.org

(Difference between revisions)
Line 5: Line 5:
[[Image:tjumodel11a.jpg|500px]]<br>
[[Image:tjumodel11a.jpg|500px]]<br>
<br>
<br>
-
Figure 1: This figer shows the concentration variation of chemical moleculars when the input signal is at negative edge when t=0.
+
Figure 2: This figer shows the concentration variation of chemical moleculars when the input signal is at negative edge when t=0.
[[Image:tjumodel11b.jpg|500px]]<br>
[[Image:tjumodel11b.jpg|500px]]<br>
|}
|}

Revision as of 10:52, 25 October 2007

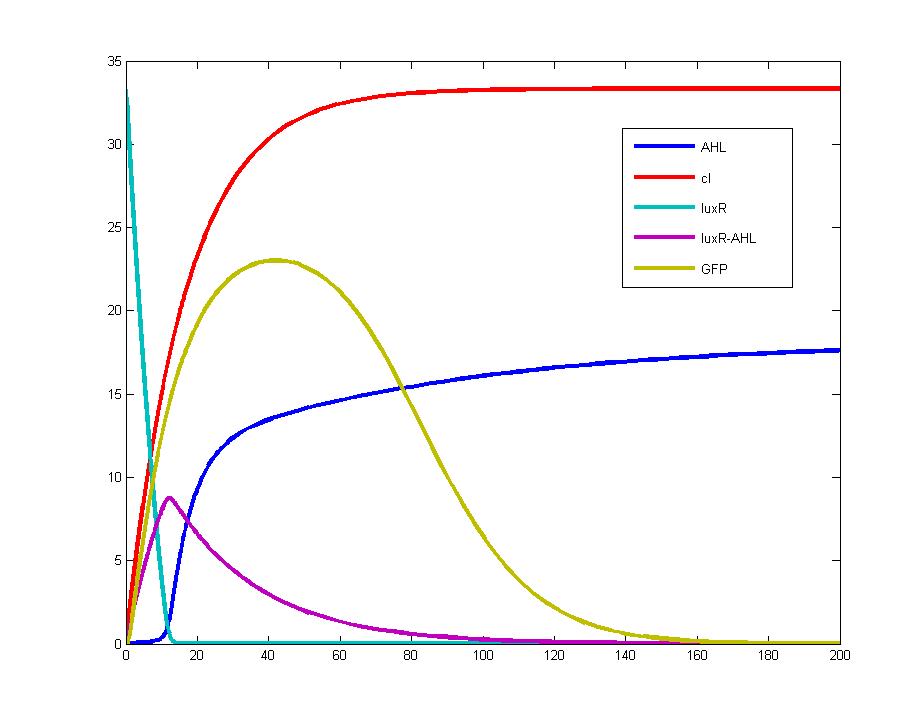
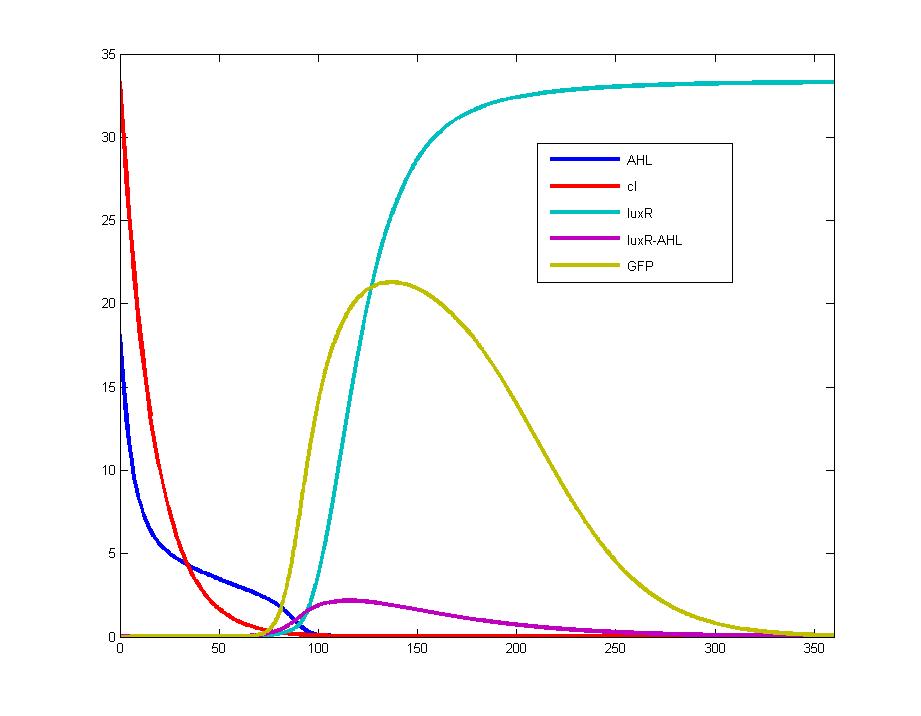
These two pictures are drew with the same parameters coming from related literature.Both figers point out that the output signal(GFP,yellow line) will form a pulse immediately after the input signal alters.
Figure 1: This figer shows the concentration variation of chemical moleculars when the input signal is at positive edge when t=0. Tjumodel11a.jpg

Figure 2: This figer shows the concentration variation of chemical moleculars when the input signal is at negative edge when t=0. Tjumodel11b.jpg