Tianjin/DIODE/Experiment1
From 2007.igem.org
Lovecarrot (Talk | contribs) (→Introduction) |
Lovecarrot (Talk | contribs) (→Test result) |
||
| Line 29: | Line 29: | ||
<center><font size="5" color="#0000CC">3.</font><font size="5" color="#0000CC">Function of Amplifier cells</font></center><br> | <center><font size="5" color="#0000CC">3.</font><font size="5" color="#0000CC">Function of Amplifier cells</font></center><br> | ||
| - | Figure 1: Following two figures are selected from five parallel experiments aiming at verifying the function of immobilized amplified cells. The function curves of generator cells and block cells are also displayed in the same figure to emphasize the effects of amplified cells. Actually, the curves of amplified cell( marked as 8P) is identical with that of generator cells, a | + | Figure 1: Following two figures are selected from five parallel experiments aiming at verifying the function of immobilized amplified cells. The function curves of generator cells and block cells are also displayed in the same figure to emphasize the effects of amplified cells. Actually, the curves of amplified cell( marked as 8P) is identical with that of generator cells, a phenomena which could be attribute to self-induction of amplified cells because of its own leakage expression of AHL . Since the threshold of Quorum Sensing is far below than our expectation, further adjustment need to make to eliminate the leakage expression of AHL to a reasonal level to avoid such a condition. |
<br> | <br> | ||
[[Image:TJUQ1.jpg|400px]][[Image:TJUQ2.jpg|400px]] | [[Image:TJUQ1.jpg|400px]][[Image:TJUQ2.jpg|400px]] | ||
<br><br><br><br> | <br><br><br><br> | ||
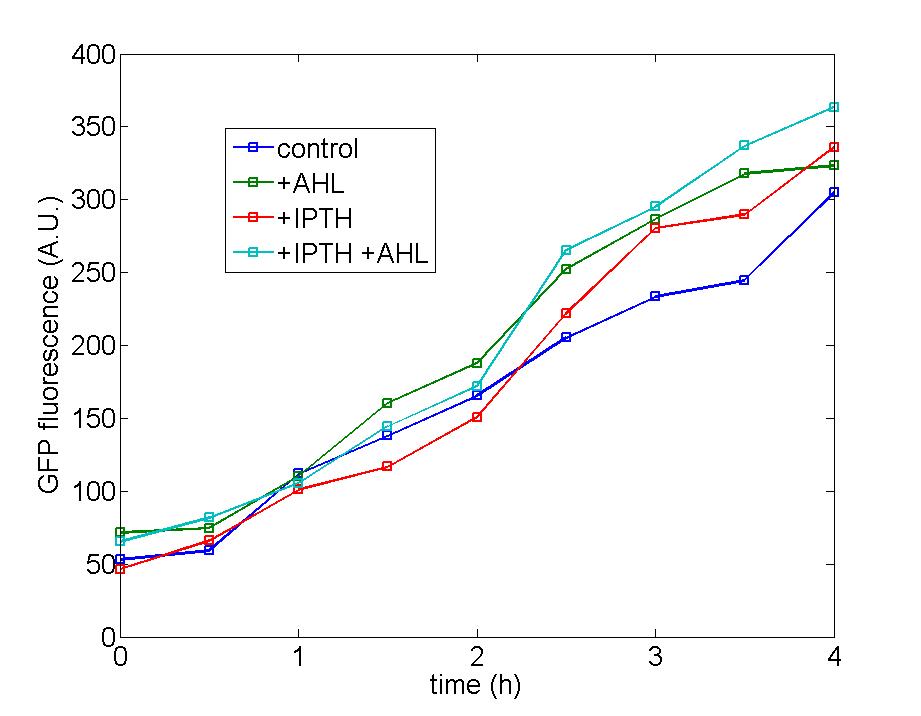
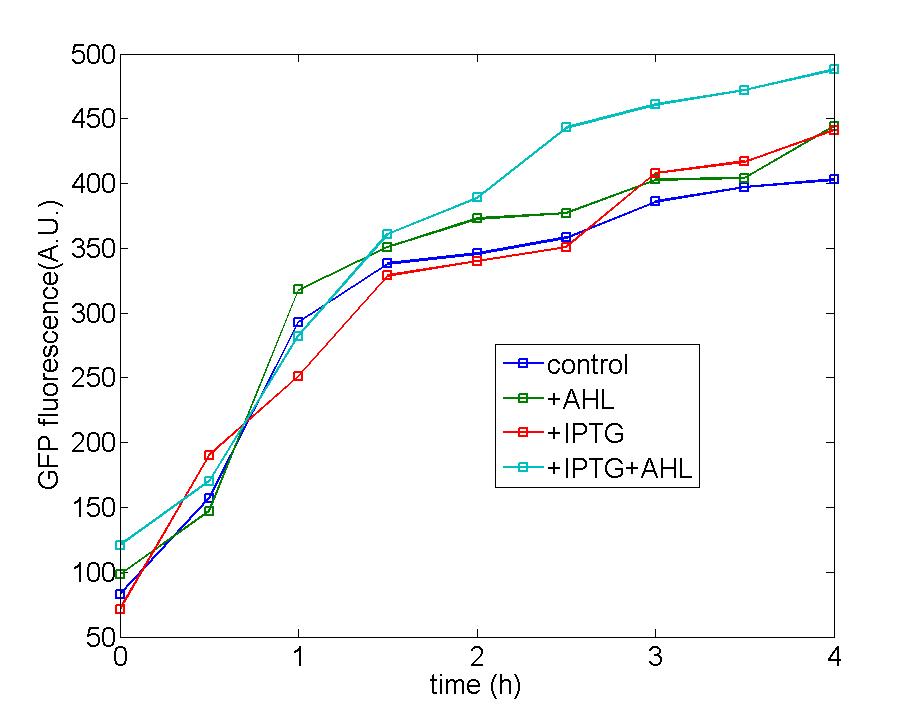
| - | Figure 2: One of our strategy is to cut down the functional part from original plasmid and transfer into a plasmid with a copy number less than 10 without the addition of IPTG (pSB2K3). With the addition of IPTG,the copy number of this plasmid could rise to as much as more than 100, so enhancement of the amplification could be achieved. Although the result is not ideal as that of other types of cells, the graph equally shows AHL signal could be slightly magnified after the addition of IPTG and AHL. The background expression of AHL still stays at a high level which makes the curve of control identical to those added with IPTG and AHL. However, compareing the sapphirine curve with the blue curve, we can see after two hours, the AHL signal is remarkablly magnified after the addition of IPTG and AHL. The right graph | + | Figure 2: One of our strategy is to cut down the functional part from original plasmid and transfer into a plasmid with a copy number less than 10 without the addition of IPTG (pSB2K3). With the addition of IPTG,the copy number of this plasmid could rise to as much as more than 100, so enhancement of the amplification could be achieved. Although the result is not ideal as that of other types of cells, the graph equally shows AHL signal could be slightly magnified after the addition of IPTG and AHL. The background expression of AHL still stays at a high level which makes the curve of control identical to those added with IPTG and AHL. However, compareing the sapphirine curve with the blue curve, we can see after two hours, the AHL signal is remarkablly magnified after the addition of IPTG and AHL. The right graph equally substantiates our hypothesis where the green and blue curve represent the cells with and without induction of IPTG respectively. |
[[Image:TJU501.jpg|300px]] [[Image:TJU502.jpg|300px]] [[Image:TJU503.jpg|300px]] | [[Image:TJU501.jpg|300px]] [[Image:TJU502.jpg|300px]] [[Image:TJU503.jpg|300px]] | ||
<br> | <br> | ||
[[Image:TJU504.jpg|300px]] | [[Image:TJU504.jpg|300px]] | ||
Revision as of 07:23, 26 October 2007
Introduction
Because the AHL signal has to be transfered between different kinds of cell which must be separately cultured according to the principles of our design,we decide to immobilize the generator cell(BBa_I13202),amplifier cells(BBa_I15030),block cells(BBa_I13208) using alginate sodium.
Another advantage of immobilizing the amplifier cell is that we want to control the positive feedback which acted as Quorum Sensing in nature by input AHL molecular to cause an input decided system from a time decided QS system.
After immobilizing these cells ,we test them by samplling the culture medium of the tested cells at different time and mixing it together with detector cell for 1.5h to measure the fluorescence intensity.All the fluorescence intensity is quantitively measured by Virian Cary Eclipse fluorescence spectrophotometer using the 3ml cup at following condition : Excitation wavelength-501nm(5nm),Emission wavelength-511nm(5nm),Average time 0.5s.
The function of the generator and block cell is the same as we expect but the function of the amplifier cells is still waiting to be improved. As our experiment discovered, the amplifier cells can produce a lot of AHL because of the induction of leakage expression of AHL by themselves, so the positive feedback permanently exists because there is no difference between the AHL generating rate of the amplifiers with or without AHL added at the beginning.So we speculate that we have immobilized the cells whose expression of LuxI gene is persistent and can not be inhibited because of the abundant AHL in the culture and in the alginate sodium beads which is hard to eliminate. Then we tried to treat these alginate sodium beads with sodium hydroxide in which the AHL will decompose more quickly .We tested it under various conditions but only to find that the addtion of sodium hydroxide is toxic to cells and severely damages its metabolic activies ,so we have to abondan this method to improve the performance of amplifier cells.
Then we cut off the function part BBa_I13202 to ligate it with another vector pSB2K3 whose copy number is controlled by IPTG hoping that after induction of IPTG simultaneously with AHL could boost the duplication of functional part and thus to produce far more AHL than self-induced cells. The experimental results indicate that the performance of amplifier cells has been ameliorated a little bit.
Test result
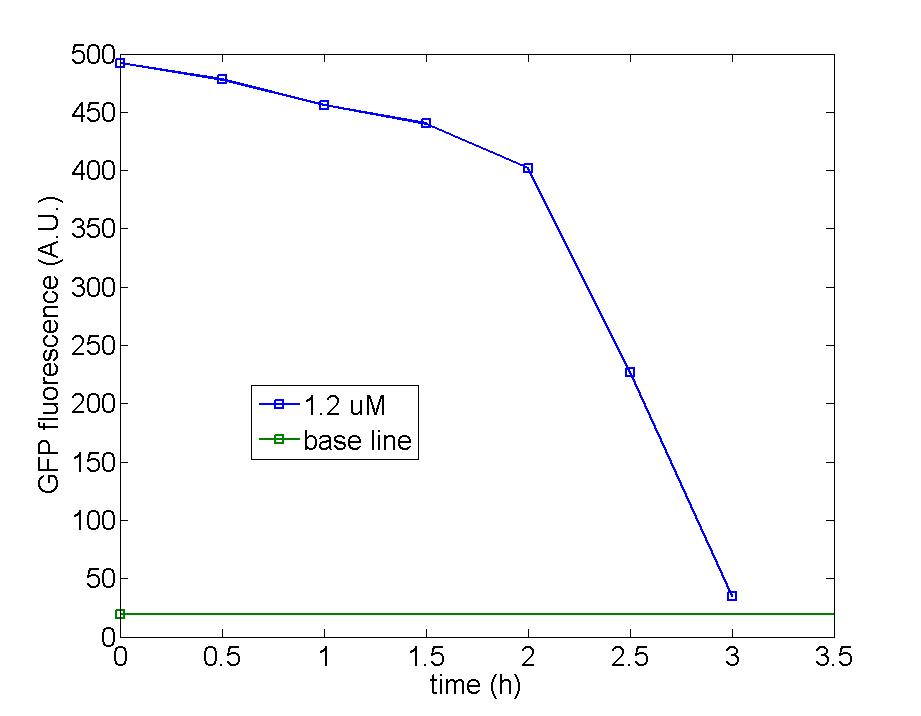
Figure 1: AHL tends to be degrated gradually by immobilized block cells as both figure indicated, after 7 hours, the concentration of AHL has dropped down to less than half of the original value. The difference between the time needed to observe dramatical decline is because the number of immobilized beads on the left figure overnumbered that on the right. Therefore, block cells still work well after being immobilized.
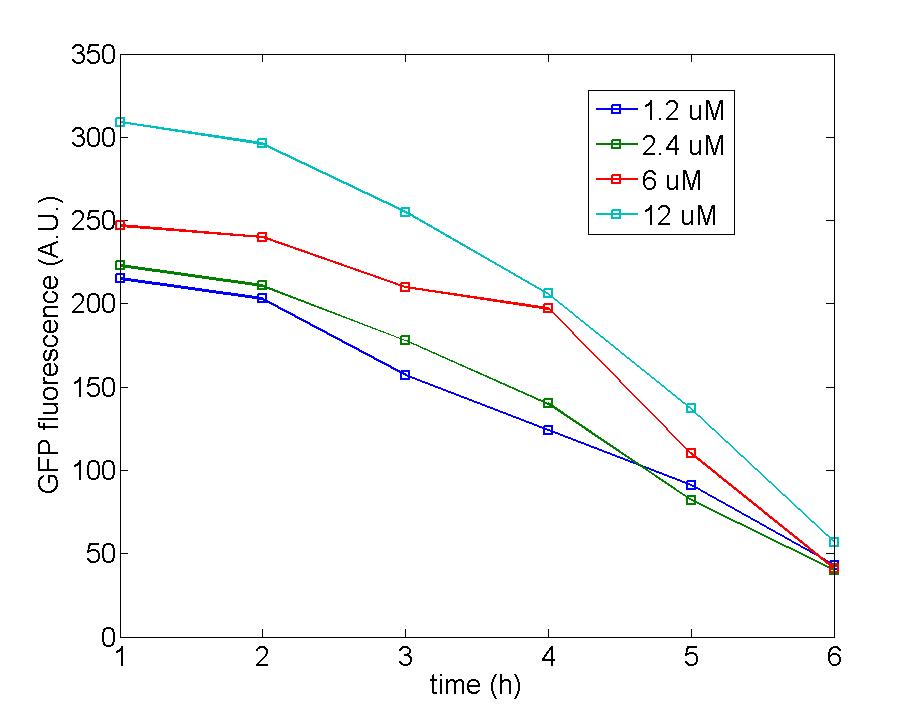
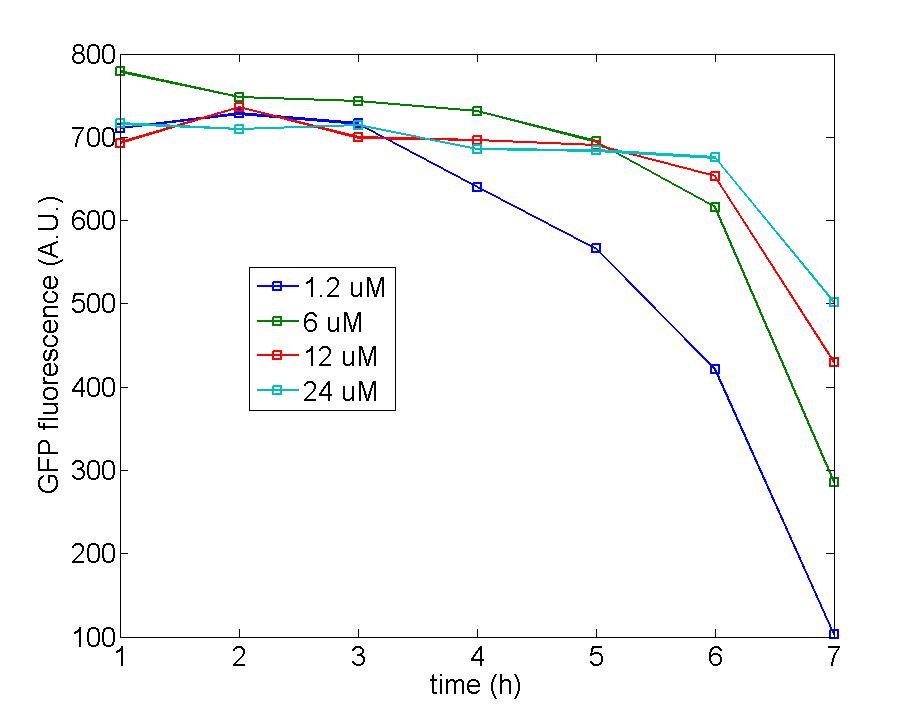
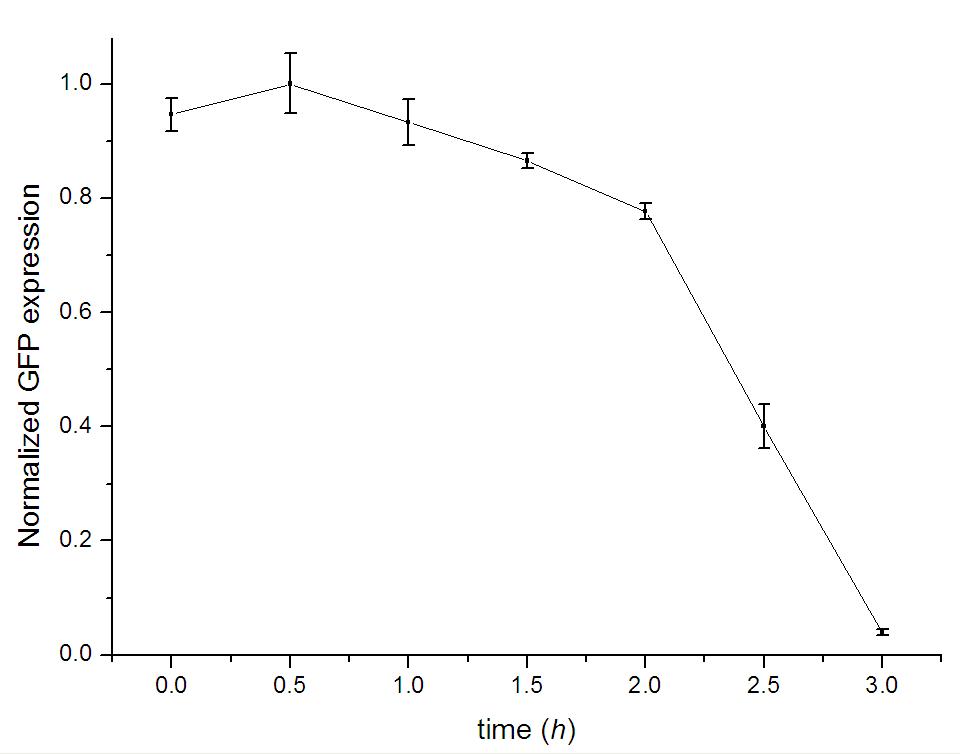
Figure 2: To test the validity of our data, the background expression of detector cells and standard deviation of our data are also considered. As the figures show, the leakage expression of GFP is far below the level of activated expression and influent a little on final curves and the tendency of curves would not change within the range of standard deviation.
Figure 1: The remarkable increasement of AHL prove the function of immobilized generator cells which secrete AHL continually to the culture flux.
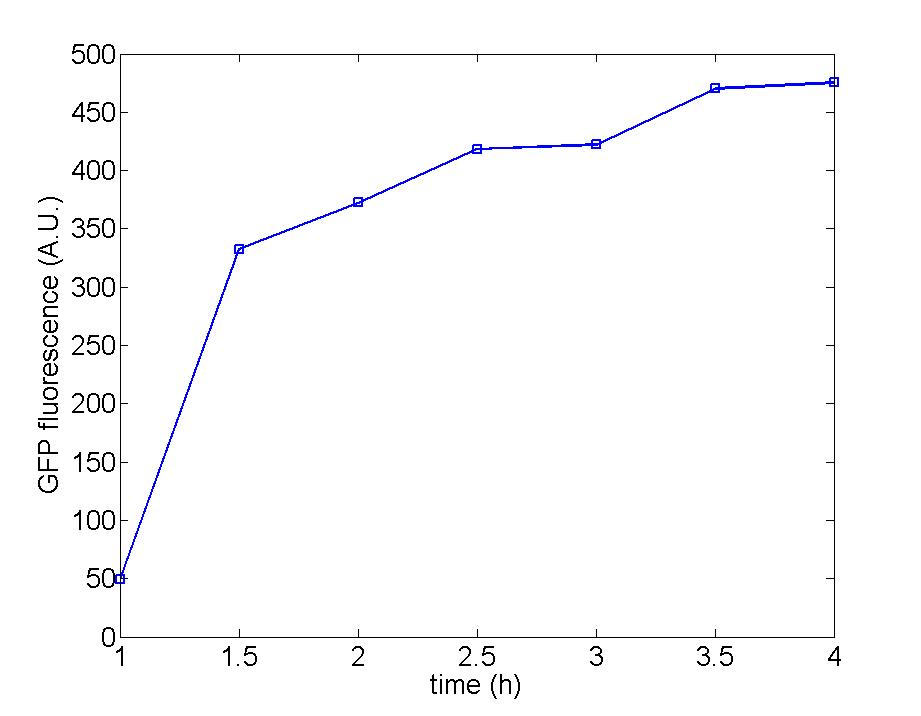
Figure 1: Following two figures are selected from five parallel experiments aiming at verifying the function of immobilized amplified cells. The function curves of generator cells and block cells are also displayed in the same figure to emphasize the effects of amplified cells. Actually, the curves of amplified cell( marked as 8P) is identical with that of generator cells, a phenomena which could be attribute to self-induction of amplified cells because of its own leakage expression of AHL . Since the threshold of Quorum Sensing is far below than our expectation, further adjustment need to make to eliminate the leakage expression of AHL to a reasonal level to avoid such a condition.
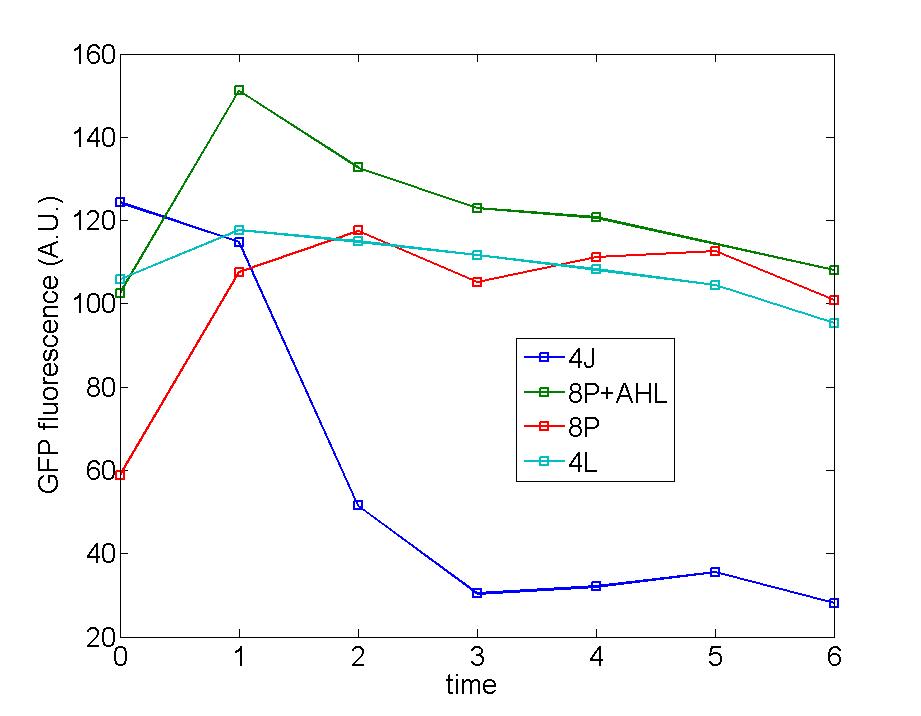
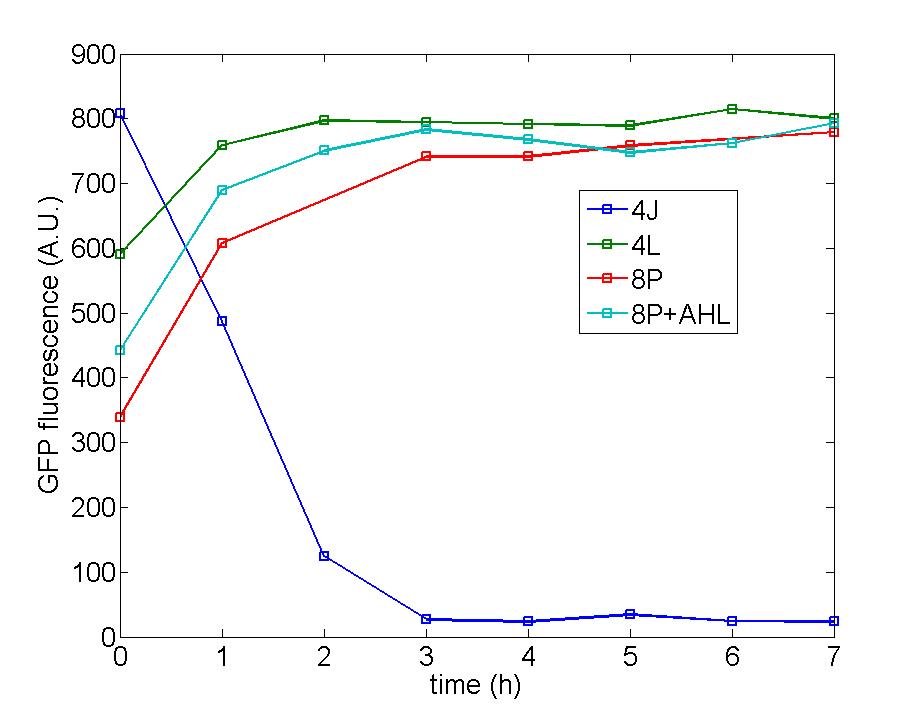
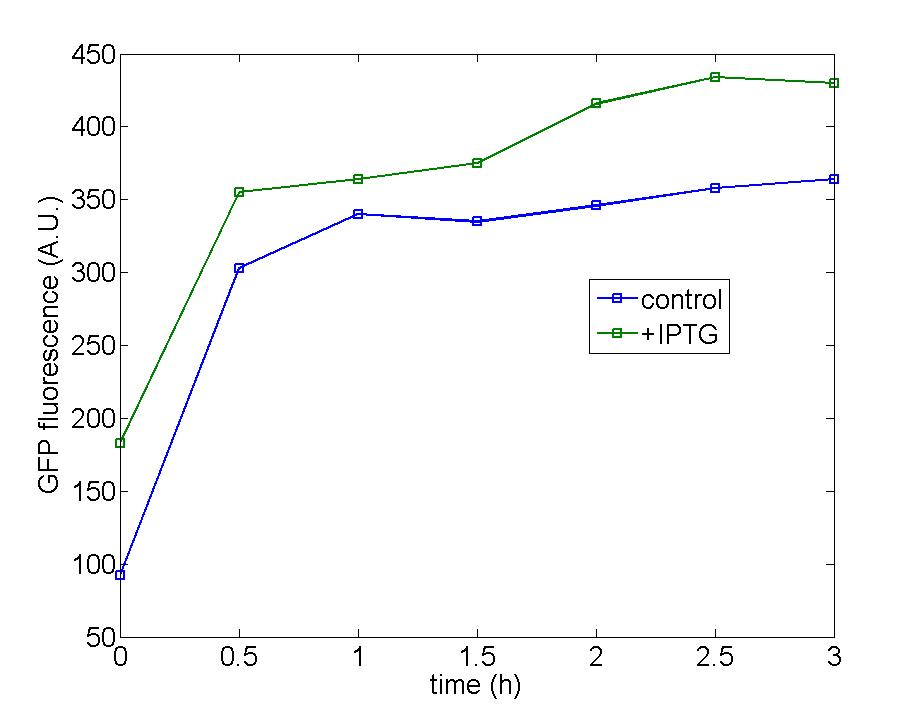
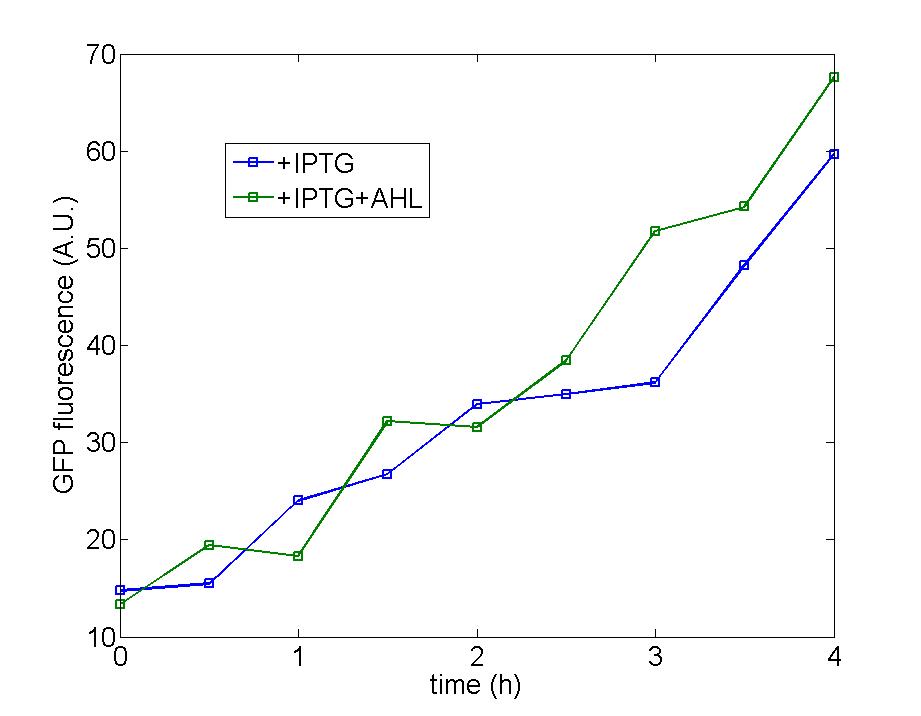
Figure 2: One of our strategy is to cut down the functional part from original plasmid and transfer into a plasmid with a copy number less than 10 without the addition of IPTG (pSB2K3). With the addition of IPTG,the copy number of this plasmid could rise to as much as more than 100, so enhancement of the amplification could be achieved. Although the result is not ideal as that of other types of cells, the graph equally shows AHL signal could be slightly magnified after the addition of IPTG and AHL. The background expression of AHL still stays at a high level which makes the curve of control identical to those added with IPTG and AHL. However, compareing the sapphirine curve with the blue curve, we can see after two hours, the AHL signal is remarkablly magnified after the addition of IPTG and AHL. The right graph equally substantiates our hypothesis where the green and blue curve represent the cells with and without induction of IPTG respectively.
