Imperial/Infector Detector/Testing
From 2007.igem.org
m (→DNA Concentrations) |
m (→DNA Concentrations) |
||
| Line 32: | Line 32: | ||
{|align="center" | {|align="center" | ||
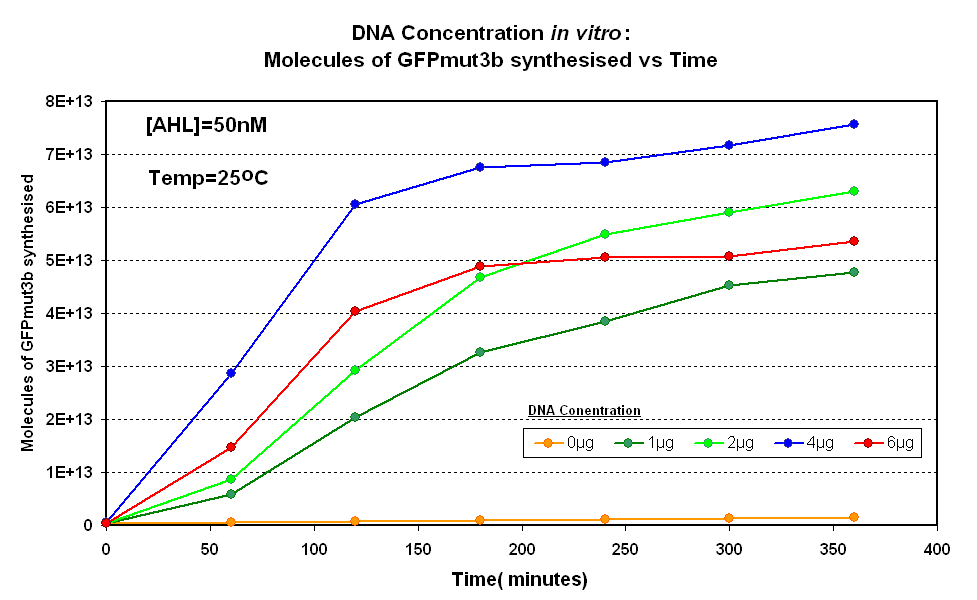
| width="50%"|<br>[[Image:IC 2007 DNA Concentration.PNG|thumb|400px|Fig.1.1:Molecules of GFPmut3b synthesised over time, for each DNA Concentration ''in vitro'' - The fluorescence was measured over time for each experiment and converted into molecules of GFPmut3b ''in vitro'' | | width="50%"|<br>[[Image:IC 2007 DNA Concentration.PNG|thumb|400px|Fig.1.1:Molecules of GFPmut3b synthesised over time, for each DNA Concentration ''in vitro'' - The fluorescence was measured over time for each experiment and converted into molecules of GFPmut3b ''in vitro'' | ||
| - | [[Imperial/Wet Lab/Results/Res1.3/Converting_Units| using our calibration curve]].]] | + | [[Imperial/Wet Lab/Results/Res1.3/Converting_Units| using our calibration curve]] Click here for [[Imperial/Wet_Lab/Results/ID2.1| results]] and [[/Imperial/Wet_Lab/Protocols/ID2.1|protocol]].]] |
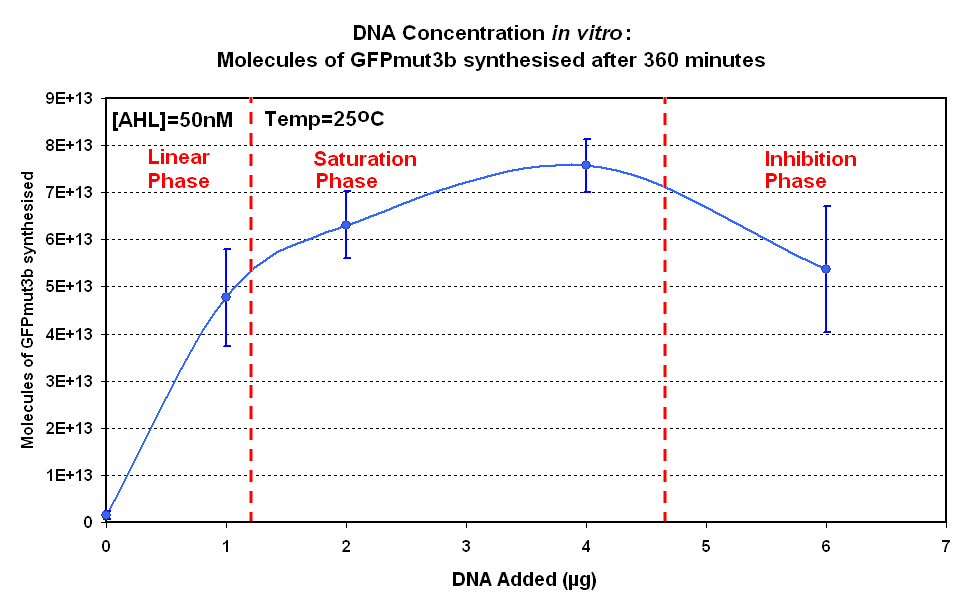
| - | | width="50%"|<br>[[image:IC 2007 DNA Concentration 360mins.PNG|thumb| | + | | width="50%"|<br>[[image:IC 2007 DNA Concentration 360mins.PNG|thumb|490px|Fig.1.2:Molecules of GFPmut3b synthesised for each DNA Concentration ''in vitro'', after 360 minutes.]] |
|} | |} | ||
Revision as of 13:41, 26 October 2007

Infector Detector: Testing
Aims
The aims of the testing were as follows:
- To test and obtain the optimal DNA concentration for construct 1 in vitro
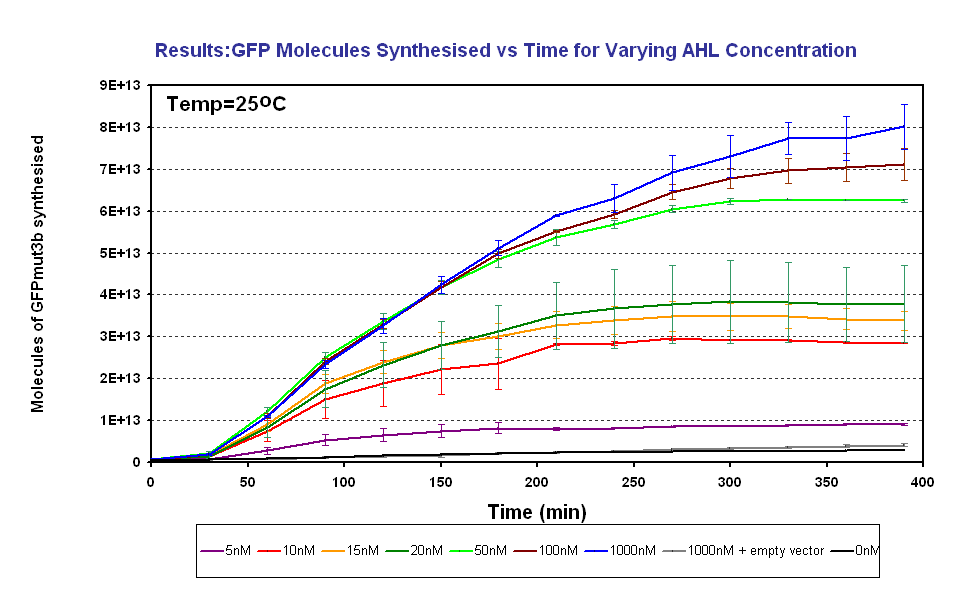
- To characterise the output of GFPmut3b for a range of AHL inputs. From this obtain the AHL sensitivity of our system.
In addition the fluorescence measurements were converted to number of GFPmut3b molecules synthesised using a calibration curve constructed using purified GFPmut3b.
Results
DNA Concentrations
 Fig.1.1:Molecules of GFPmut3b synthesised over time, for each DNA Concentration in vitro - The fluorescence was measured over time for each experiment and converted into molecules of GFPmut3b in vitro using our calibration curve Click here for results and protocol. |
The Results above show that the optimum DNA concentration for in vitro is 4µg. From figure 1.1. and 1.2 it can be seen that as DNA concentration increases above 4µg the GFPmut3b molecules synthesised decrease. Interestingly for figure 1.2 the graph can be split into several regions of how the DNA concentration changes the GFPmut3b synthesis. Initially there is a linear phase, followed by a saturation stage where we found 4µg to be the peak, this is followed by a inhibition stage where increasing the DNA concentration actually inhibits the rate of protein synthesis.
Testing AHL Range
The results show us the following:
|

