June 20
From 2007.igem.org
(→Analysis) |
(→Analysis) |
||
| Line 28: | Line 28: | ||
{|style="bordercolor=brown" border="1" cellspacing="2" cellpadding="2" | {|style="bordercolor=brown" border="1" cellspacing="2" cellpadding="2" | ||
|- | |- | ||
| - | |[[Image:CFPlin.jpg|thumb|200px|CFP v/s aTc concentration (linear)]] | + | | |
| + | [[Image:CFPlin.jpg|thumb|200px|CFP v/s aTc concentration (linear)]] | ||
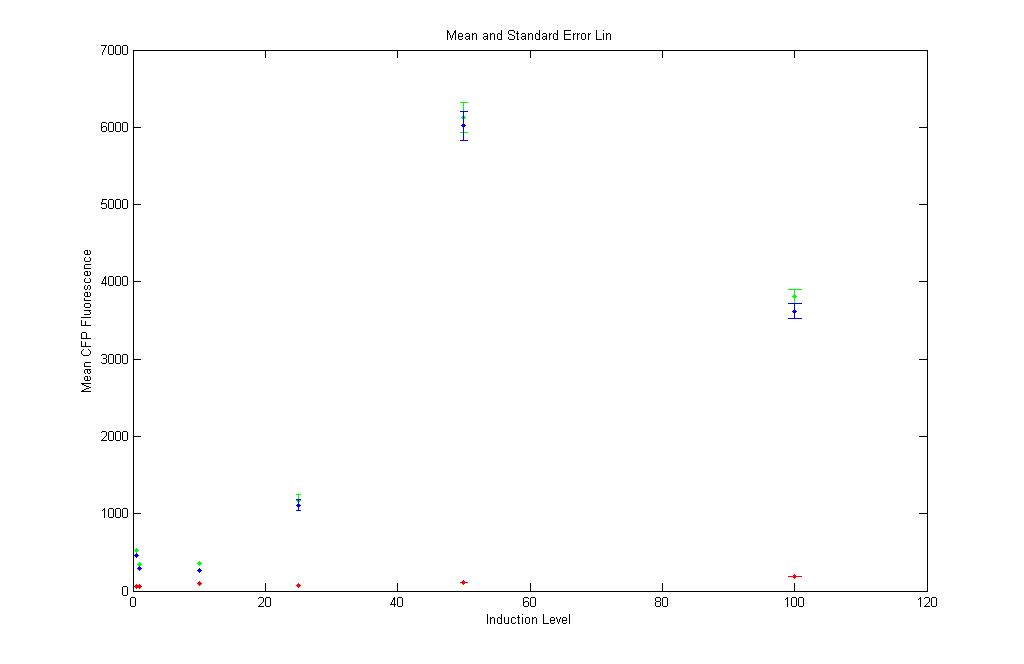
The low values of the red points show that aTc causes no CFP fluorescence in the absence of pT.luxI.C as is in K12Z1. Also, the blue and green points almost form a sigmoid, except for the value at 100 aTc(???). | The low values of the red points show that aTc causes no CFP fluorescence in the absence of pT.luxI.C as is in K12Z1. Also, the blue and green points almost form a sigmoid, except for the value at 100 aTc(???). | ||
Revision as of 16:59, 25 June 2007
Experiments
Microscopy:
- pT luxI Cfp imaging done at various induction levels but OD was too high
- K12Z1 imaging done at various induction levels
- 1st Open loop trial Experiment DONE (Auto fluorescence, pT.luxI.C (at AI OD 2 and 0.2))
FACS:
- Auto fluorescence at inductions [0,1,10,25,50,100] done in triplets
- pT.luxI.C fluorescence at inductions [0,1,10,25,50,100] done in triplets
- Fluorescence due to M9 solution (Control)
Analysis
Microscopy:
pT LuxI.C: Subtract K12Z1 and plot CFP,YFP,RFP vs aTC concn
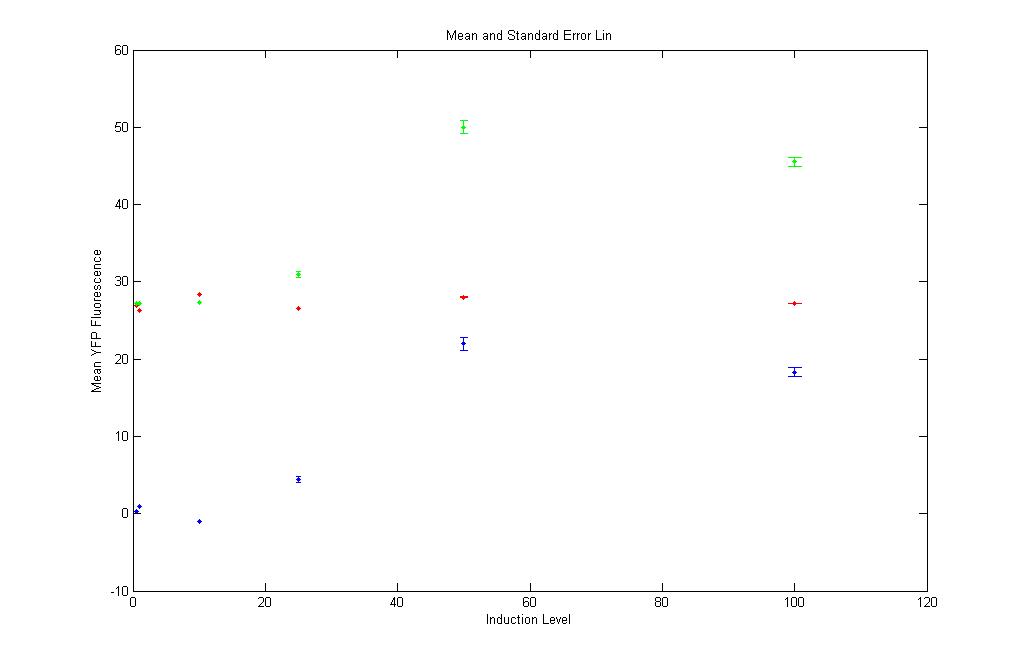
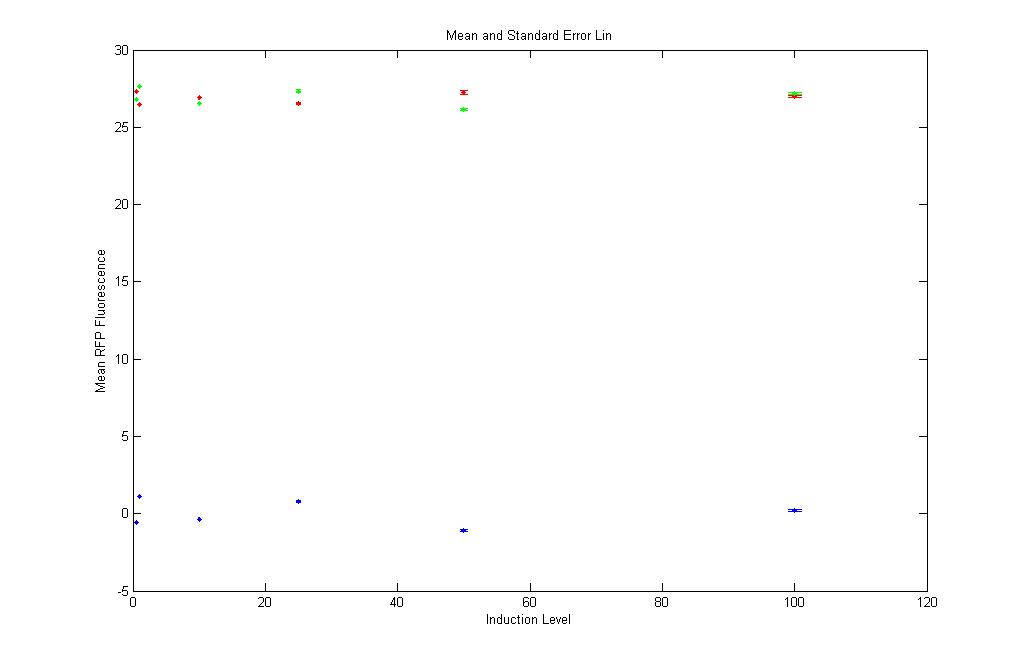
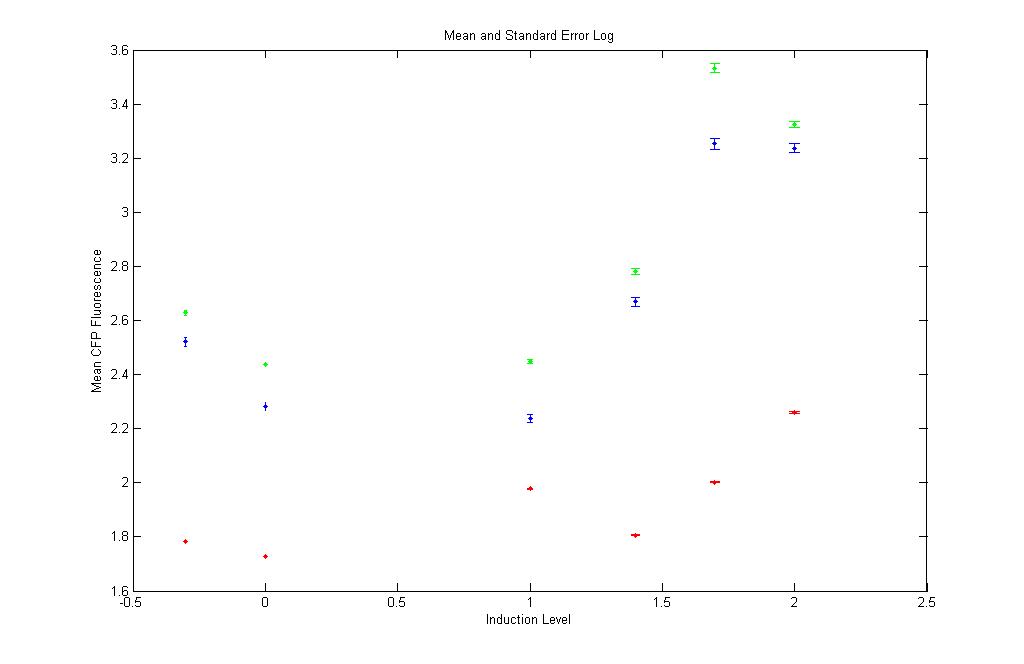
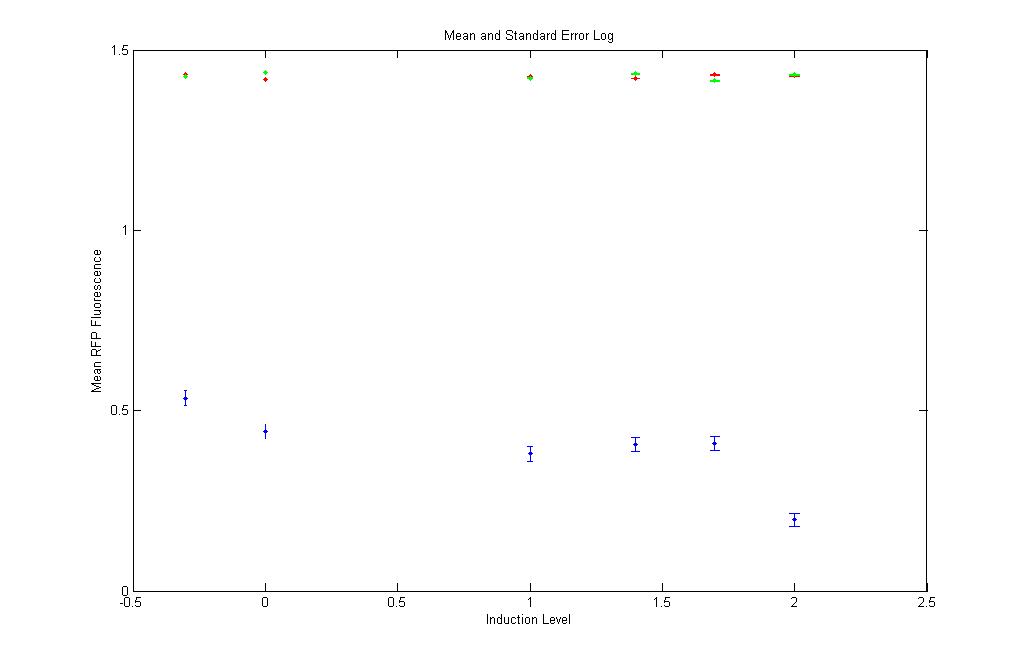
Red : K12Z1 Fluorescence values at different aTc induction levels
Green : pT.luxI.C Fluorescence values at different aTc induction levels
Blue : pT.luxI.C - K12Z1 Fluorescence values at different aTc induction levels
Linear and log space
Mean and Standard Error Plots at all induction levels
|
The low values of the red points show that aTc causes no CFP fluorescence in the absence of pT.luxI.C as is in K12Z1. Also, the blue and green points almost form a sigmoid, except for the value at 100 aTc(???). |
Look at the scale on the Y-axis. The YFP Fluorescence is far lower(almost negligible) than the CFP Fluorescence. |
Even here the RFP Fluorescence values are too low and are safely neglected. |
|
Somewhat sigmoidal curve obtained (but not convinced)! |
The red and green points are close to each other. This shows that the YFP expression in pT.luxI.C is almost the same as is in K12Z1. Again safely neglected!!! |
Same as in YFP log. Even here the red and green points are close to each other. Shows that the RFP expression in pT.luxI.C is almost the same as is in K12Z1. Again safely neglected!!! |
