July 6
From 2007.igem.org
(Difference between revisions)
(→Analysis) |
(→Analysis) |
||
| Line 14: | Line 14: | ||
|-align="center" | |-align="center" | ||
!colspan="2" rowspan="2"| | !colspan="2" rowspan="2"| | ||
| - | CFP mean values | + | CFP |
| + | |||
| + | mean | ||
| + | |||
| + | values | ||
|colspan="7"| | |colspan="7"| | ||
IPTG (uM) or luxR.YFP | IPTG (uM) or luxR.YFP | ||
| Line 89: | Line 93: | ||
|-align="center" | |-align="center" | ||
!colspan="2" rowspan="2"| | !colspan="2" rowspan="2"| | ||
| - | YFP mean values | + | YFP |
| + | |||
| + | mean | ||
| + | |||
| + | values | ||
|colspan="7"| | |colspan="7"| | ||
IPTG (uM) or luxR.YFP | IPTG (uM) or luxR.YFP | ||
Revision as of 06:33, 7 July 2007
Back to Bangalore
Back to e-Notebook
Experiments
Analysis
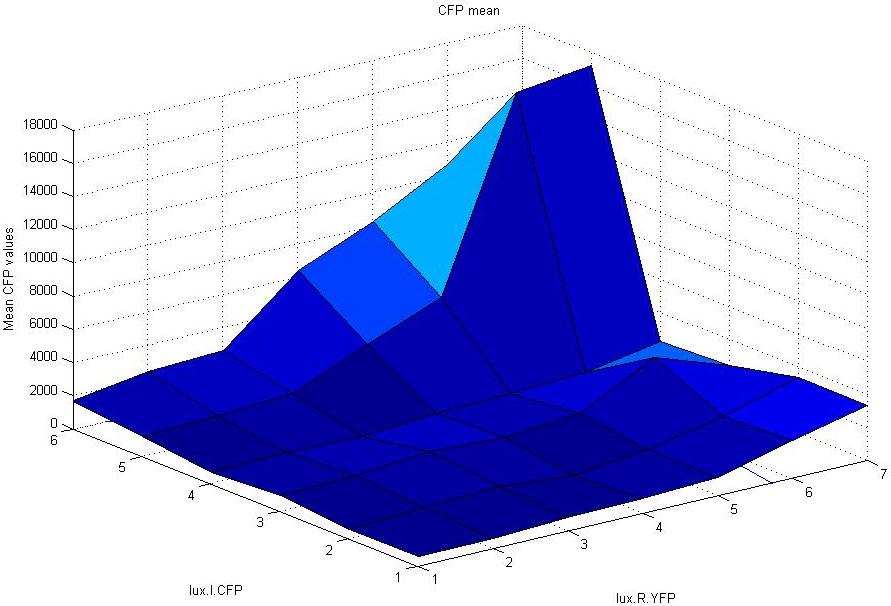
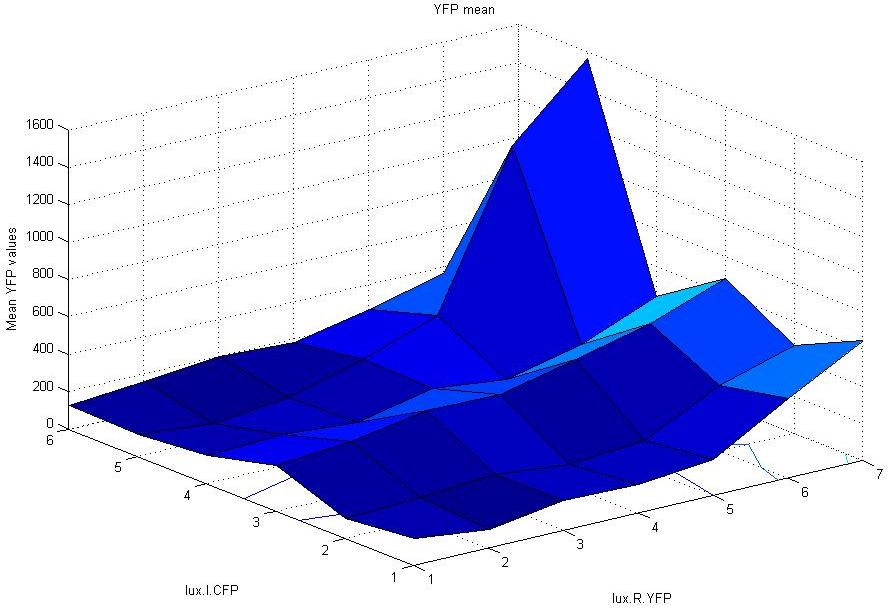
Today we compiled the data collected from all our open-loop experiments performed at various concentrations of aTc (ng/ml). The following matrix of information was obtained:
|
CFP mean values |
IPTG (uM) or luxR.YFP | |||||||
|---|---|---|---|---|---|---|---|---|
| 0 | 5 | 10 | 50 | 100 | 500 | 1000 | ||
|
aTc (ng/ml) or luxI.CFP | 0 | |||||||
| 1 | ||||||||
| 5 | ||||||||
| 10 | ||||||||
| 20 | ||||||||
| 50 | ||||||||
|
YFP mean values |
IPTG (uM) or luxR.YFP | |||||||
|---|---|---|---|---|---|---|---|---|
| 0 | 5 | 10 | 50 | 100 | 500 | 1000 | ||
|
aTc (ng/ml) or luxI.CFP | 0 | |||||||
| 1 | ||||||||
| 5 | ||||||||
| 10 | ||||||||
| 20 | ||||||||
| 50 | ||||||||
| These values, obtained from the microscopy experiments, give us a clear idea of the equivalence between luxI.CFP and luxI.YFP.
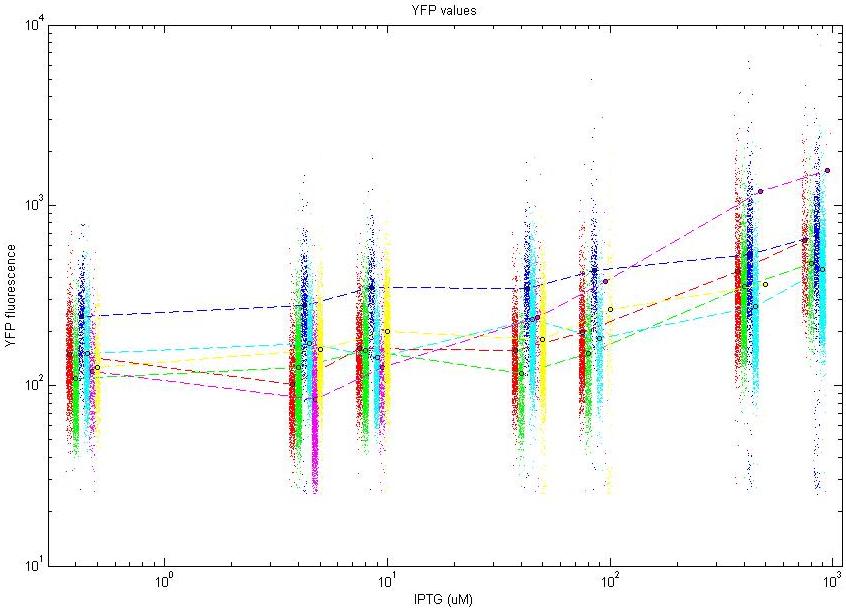
A scatter plot with each dot representing a cell was also plotted to see the variation of fluorescence with the change in aTc and IPTG concentrations.
|


