Naples
From 2007.igem.org
(→Materials & Methods) |
(→Materials & Methods) |
||
| Line 145: | Line 145: | ||
**Primers Design | **Primers Design | ||
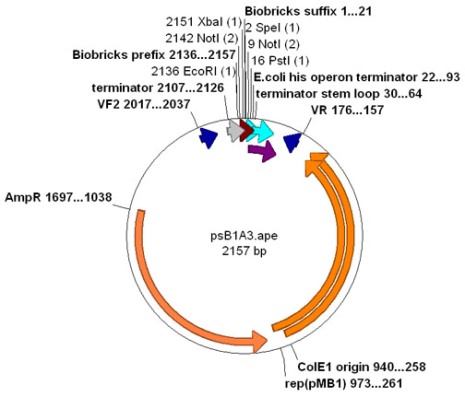
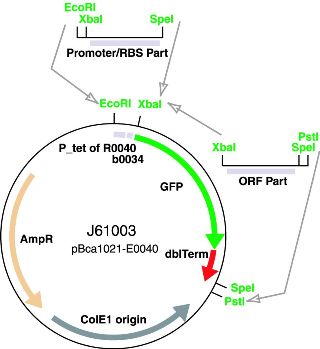
| - | [[Image:Psb1A3map.jpg]] [[Image: | + | [[Image:Psb1A3map.jpg]] [[Image:Gfp-report2.jpg]] |
* Cloning Strategies in S.cerevisiae | * Cloning Strategies in S.cerevisiae | ||
Revision as of 13:52, 8 September 2007
Contents |
University of Naples "Federico II"
Tigem
The Telethon Institute of Genetics and Medicine (TIGEM) was created by the Italian Telethon Foundation in 1994. TIGEM mission is the understanding of the pathogenic mechanisms of genetic diseases with the aim of developing preventive and therapeutic strategies.TIGEM currently hosts 17 research groups, and a total of more than 120 persons, including students, postdoctoral fellows, staff scientists, technicians, and administrators and offers training programs in medical human genetics and Synthetic Biology in cooperation with the University of Naples Federico II.
- Students:
- Giovanni Russo
- Lucia Marucci
- Velia Siciliano
- Irene Cantone
- Roberta Bergamasco
- Maria Aurelia Ricci
- Mafalda Graziano
- Instructors
- Diego di Bernardo
- Maria Pia Cosma
- Mario di Bernardo
- Advisor
- Giulia Cuccato
Our Project
The aim of our project is to engineer a synthetic biological network in yeast able to detect the quality of olive of oil, one of the most famouse product of Italy, now possible only through expensive and not-portable machines. In order to achieve this, we will modify Saccharomyces cerevisiae cells so that they will be able to change colour at differents oleate concentrations.
Oleate is the principal olive oil element and acidity indicator. The olive oil is defined "extra vergine" if it has an acidity lower than 0.8 %,"vergine" with an acidity lower than 2% and not edible if has an acidity higher than 3%. Oleate induces the transcription of genes involved in peroxisome biogenesis and stimulates the proliferation of these organelles in Saccharomyces cerevisiae. Fatty acid-mediated induction is based on a dramatic increase in transcription of several genes encoding peroxisomal functions due to the presence of an oleate response element (ORE) in their promoters.This upstream activating sequence is minimally defined by an inverted repeat of CGG triplets separated by a 15-18-nucleotide spacer. It constitutes the binding target for the transcription factors Oaf1p and Pip2p.
Modeling
Introduction
Over the past decades progress in measurement of rates and interactions of molecular and cellular processes has initiated a revolution in understanding of dynamical phenomena in cells. Generally speaking a dynamical phenomenon is a process that changes over time. Living cells are inherently dynamic! Indeed, to sustain the characteristic features of life (growth, cell division...) they need to extract and transform energy from their surroundings. This implies that cells function thermodinamically as open systems. So, we have encountered a new keyword: system. The most general definition for system is the following: a set of functional elements joint together to perform a specific task. Cells are astoundingly complex systems: they contain networks of thousands of biochemical interactions. System-level understanding, the approach of systems biology, requires a shift in the notion of what to look for. An understanding of genes and proteins is very important, but now the focus is on understanding system' structure and dynamics. Biologists use cartoons to capture the complexity of the networks, but because a system is not just an assembly of genes and proteins, its properties cannot be fully understood by drawing these diagrams. They, of course, represent a first step in our modeling, but can be compared to static roadmap, whereas what we really seek to know are the traffic patterns, why they emerge, how to control them. So, we will use a typical approach from systems and control theory.
Basic assumptions
We realized a reaction network as a system of ODEs. Clearly we need to guess working hypothesis:
- Component concentrations don't vary with respect to time
Whether it is a good assumption depends on time and space scales. In a yeast cell molecular diffution is sufficiently fast to mix proteins in less than one minute
- Component concentrations are continuous functions of time
This is true if the number of molecules of each species in the reaction volume is sufficiently large
Other important assumptions are the following:
- Transcription factor timescales are much larger than protein-protein interactions timescales
- Input changes are very rapid
We will use this assumptions to simplify our modeling
ODEs are very useful to represent molecular interaction. Indeed, applying a simple set of rules we can represent arbitrarily complex reaction networks as a set of coupled ODEs!
Our model
[INTERNAL COMMENT: GUYS CAN YOU PLEASE DO A FIGURE THAT SHOWS ALSO THE INPUTS AND THE PROMOTERS? ]
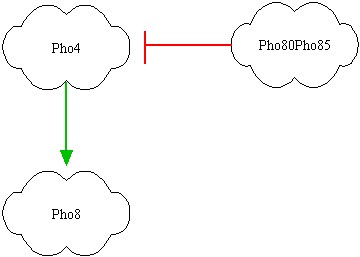
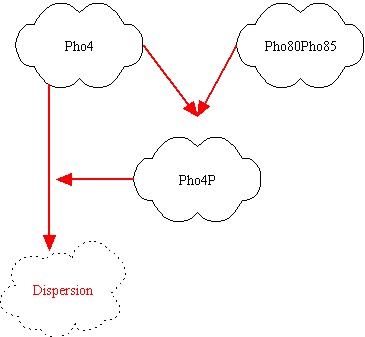
After some brainstorming we found the best parts for our project. They are showed above:
In the left picture the genes are represented; red link indicates a protein-protein interactions, while green link indicates a transcription factor interaction. It's clear that Pho80Pho85 inhibits Pho4, so if Pho80Pho85 is active then Pho8 is low even if Pho4 is active (design task). If Pho80Pho85 is inactive and Pho4 is active, then Pho8 becomes active. If Pho80Pho85 and Pho4 are inactive, than Pho8 is inactive. The inhibition of Pho4 by Pho80Pho85 is at protein-protein level: if Pho80Pho85 is active, Pho4 is phosphorylated and its concentration becomes rapidly small.
The input to the system will be the level of oleic acid that will drive expression from appropriate promoters responsive to oleic acid cloned upstream of Pho80Pho85 and Pho4.
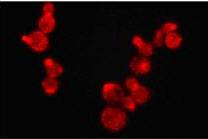
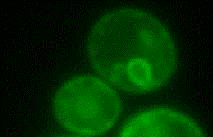
The outputs of the system will be Pho80Pho85 and Pho8 and we will associate them red or green lights! We recall that, for 100 gr of the oil, it will be:
- extra virgin, if the oleic acid conentration will be less than 0.8 gr
- virgin, if oleic the acid concentration will be less than 2 gr
- not edible, if the oleic acid concentration will be greater than 3-4 gr
Now, we need to convert gr in mol and we found that:
- the oil is extra virgin if the oleic acid concentration is less than 2.8 mM
- the oil is virgin if the oleic acid concentration is less than 7.1 mM
- the oil is not edible if the oleic acid concentration is greater than 7.1 mM
therefore we need two promoters able to activate Pho80Pho85 expression when the oleic acid concentration is greater than 7.1mM and sensitive to concentration greater than 2.8mM.
Mathematical model
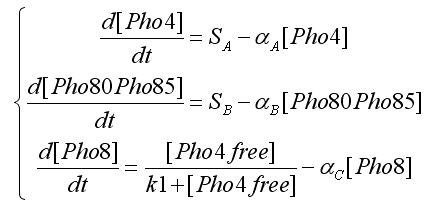
We modeled the transcriptions factor interactions as Hill-like functions, while the protein-protein interactions are represented through a typical prey-predator model. All the hypotesis were used to get the ODE model. For the transcription factor level we have the following equations:
In the equations SA and SB indicates the inputs, i.e. if an oleate level is passed. Notice that the second assumption is used to obtain this equations form. [Pho4free]is the Pho4 concentration (the output from protein-protein interaction) that participates to transcription factor interaction. To get this value we write the equation for protein-protein interaction:
Using the first assumption we can obtain an expression for [Pho4free] in terms of [Pho80Pho85] and [PhO4] using steady state solution. The third equation in the ODEs system will become:
System analysis and simulations
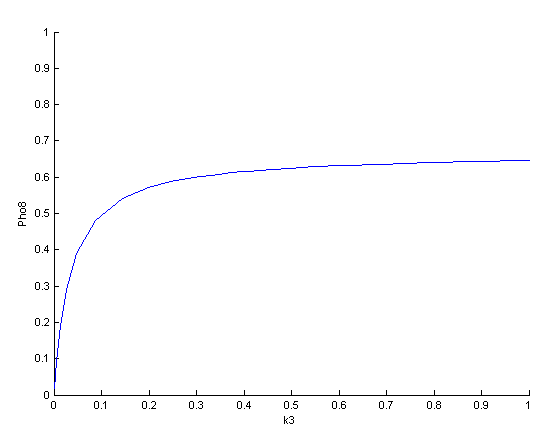
The system was studied analytically and numerically. Both studies showed an unexpected structural stability property in the parameter range of physical interest. Indeed, we get an analytic expression for the Jacobian matrix (a diagonal matrix) whose determinant becomes 0 only if almost one of basical diluition factor becomes 0. After a careful study we found the reason of this behavior in the modeling process, particularly in the use of the second assumption. Matlab, Mathematica and Matcont were used to complete the study with simulations and bifurcation diagrams that confirmed the previous analytic study. The following pictures shows the bifurcation diagram of [PHO8], an output of the system. This diagram shows the property of structural stability, i.e. non bifurcations are found:
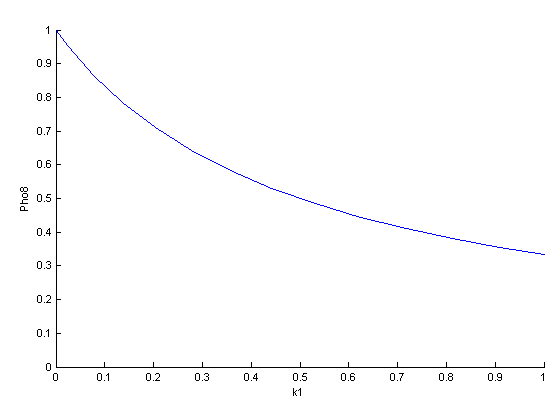
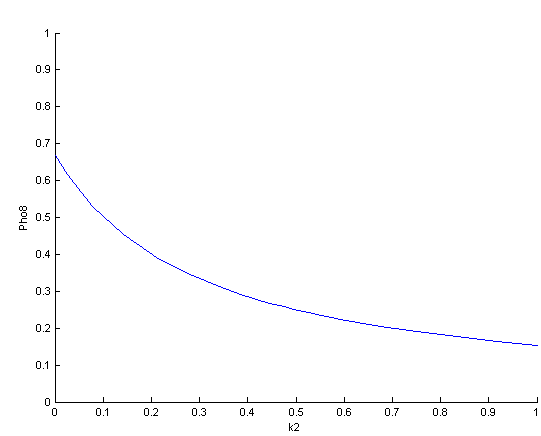
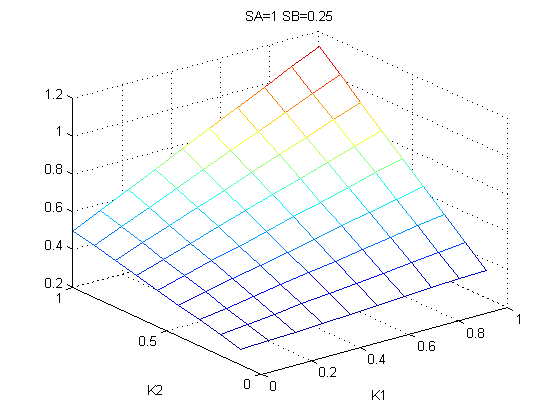
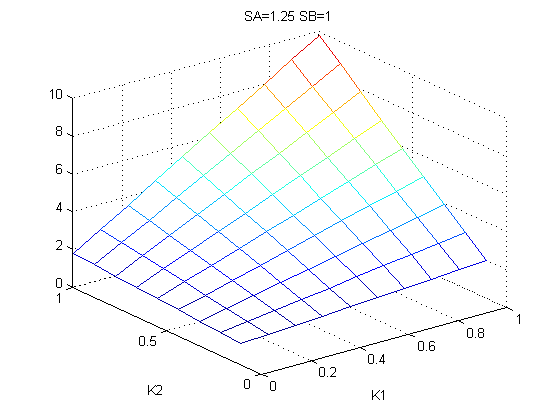
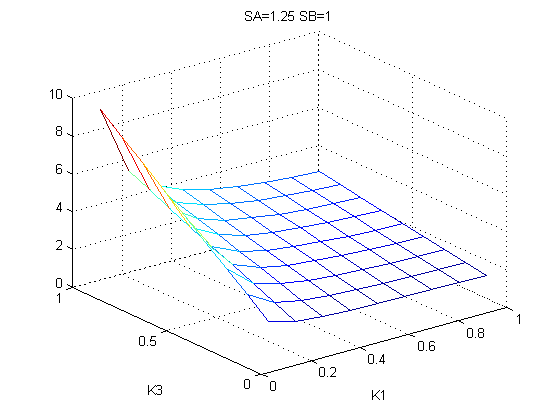
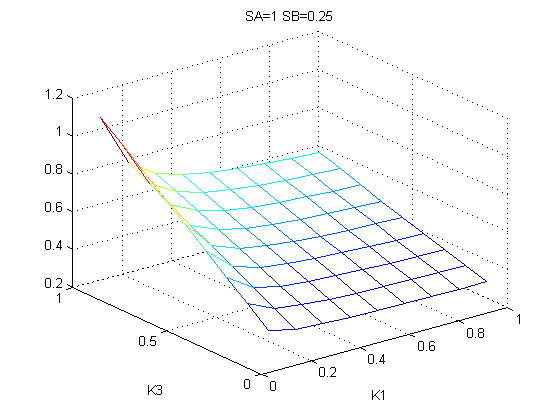
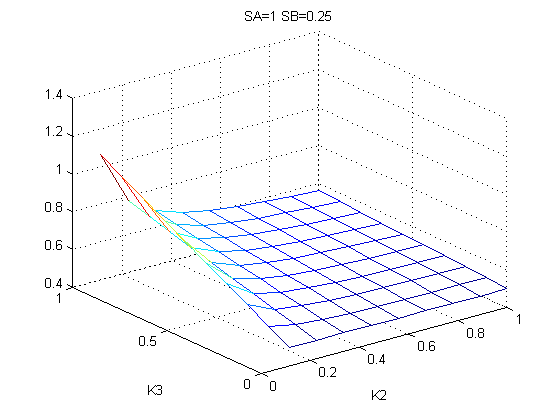
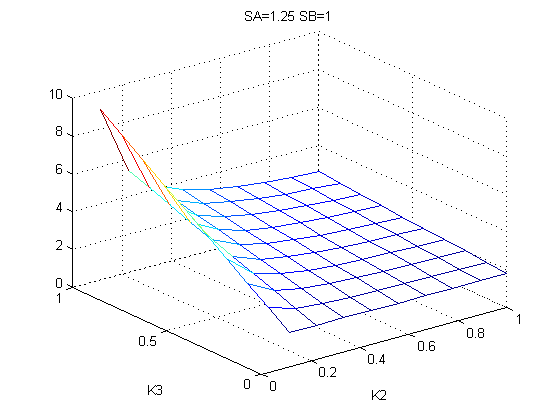
The bifurcation diagrams for [PHO80PHO85], the other output of the system, are qualitatively the same, so they are not showed here. The continuation software used is Matcont. Once we get the steady state behavior of the outputs separately, we have to choose some index for the performances of the system. The ratio between the two outputs, i.e. PHO8/PHO8085, appears to be appropriated for our purpose. The following pictures shows PHO8/PHO8085 at the varying of two parameters:
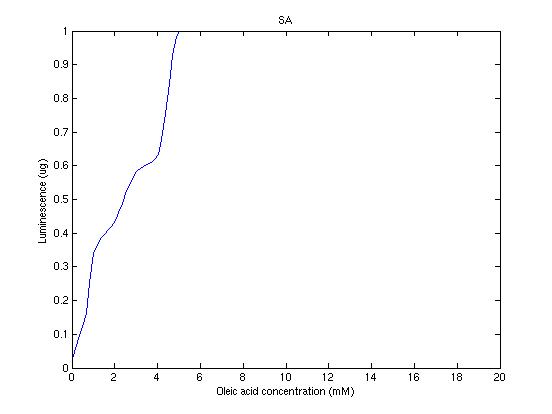
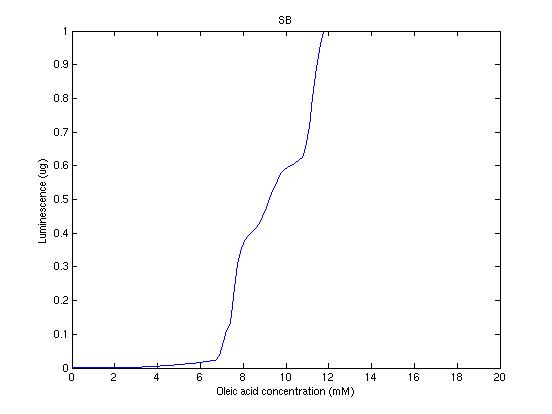
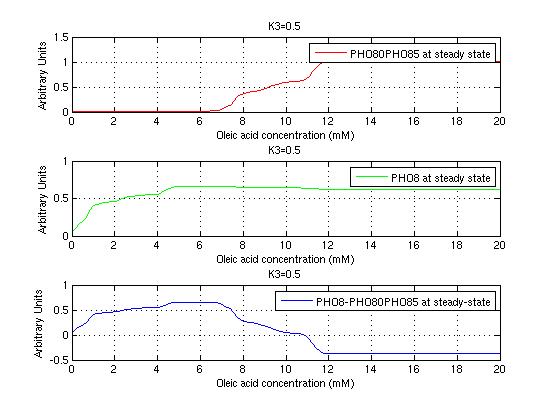
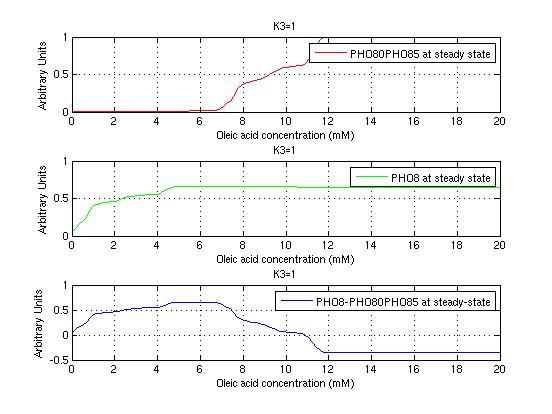
From the sowed pictures we find that the ideal choise for our parameters that assures the best performances will be: K1>>K3, K2>>K3, K2=K1. These reasoninge will be confirmed and strengthened by the following analysis, in which we will introduce oleic acid into the model. Notice that the model uses SA and SB as input and they are independent from the oleic acid concentration: now we want to study the behavior of the system using SA and SB as functions of oleic acid concentration (o.a.), i.e. SA(o.a.), SB(o.a.). For this purpose we used data from luciferase assay. We imported this data in Matlab and the results are the following input curves:
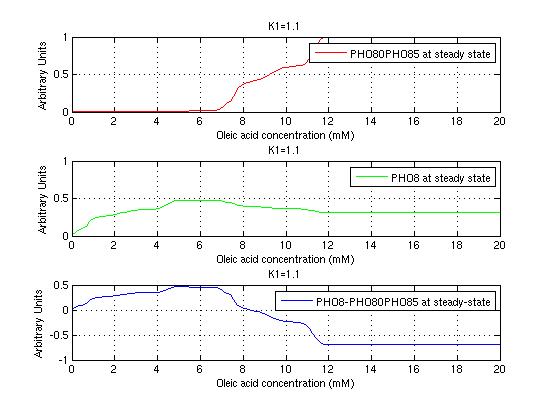
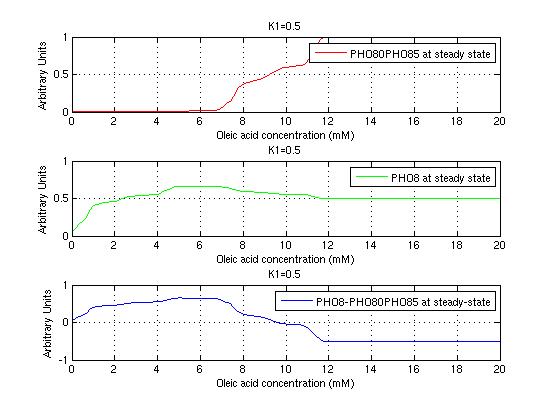
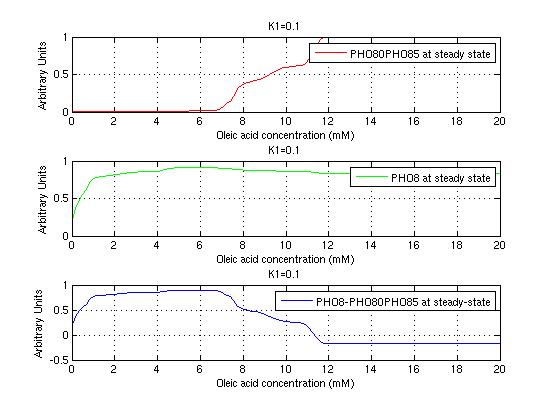
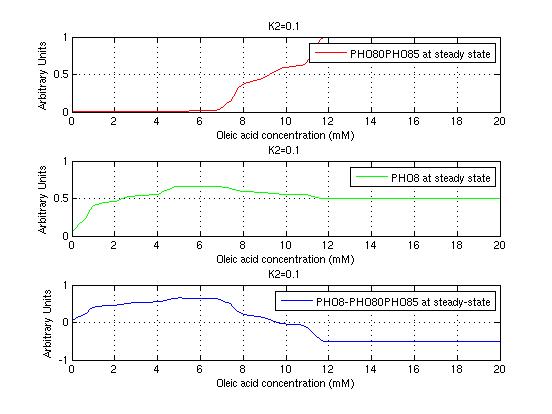
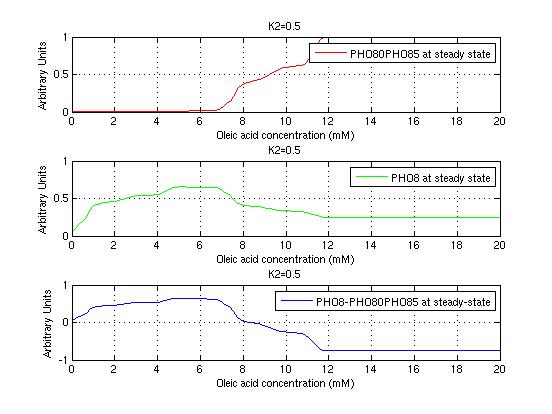
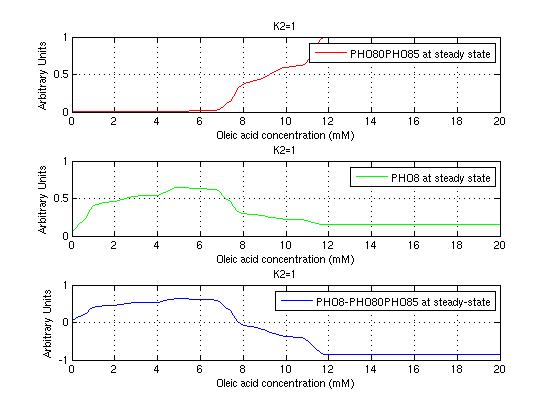
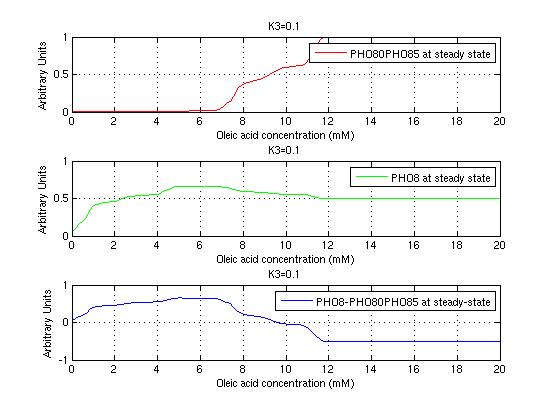
Using these input functions and varying parameters, we get the following response curve:
It's clear that k1=0.1 and K1=0.5 doesn't ensure a correct behavior of the system: the repression of PHO8 is too weak when the oleic acid concentration becomes greater than 7.1 mM! We repeated the same analysis for the varying parameters K2 and K3 and we found that a good behavior is given by k2=1 and k3=0.1. This is confirmed be the following pictures:
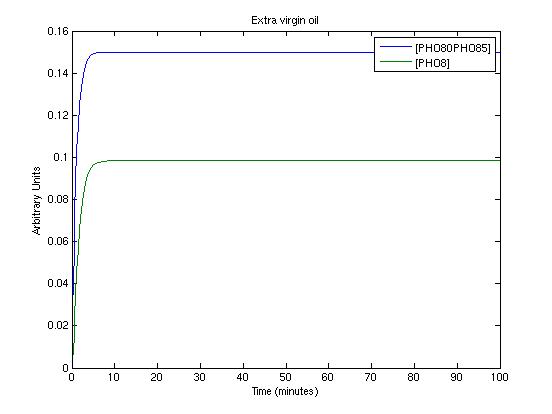
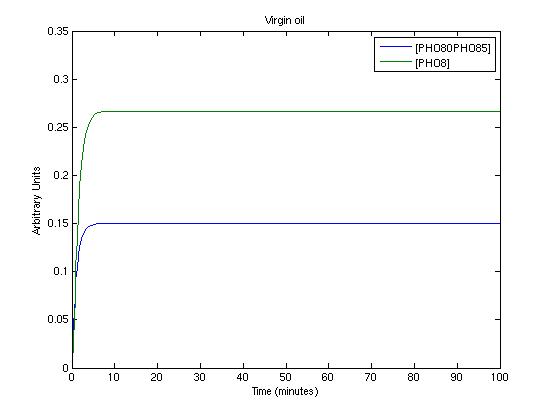
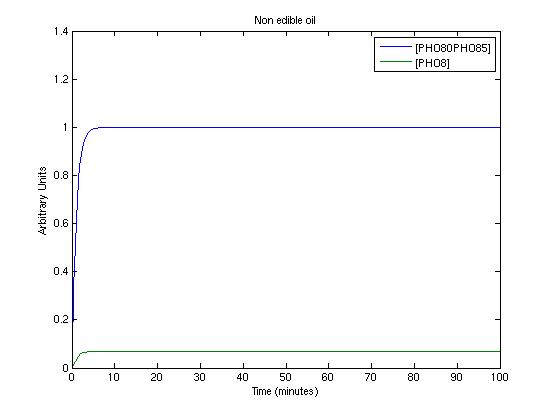
To get informations about the transient response of the system and to test the detected parameters we used a new Matlab file which simply simulates the system. The three picture we present shows the system's response in three working conditions:
- extra virgin oil
- virgin oil
- not edible oil
These conditions are simulated by setting proper values for SA and SB.
Yeast Strain
Yeast strain used is W303. All DNA manipulations and subcloning were done in Escherichia coli.
Materials & Methods
We have adopted a strategy of parallel cloning.A reporter genes are cloned in parallel into a vector containing four different promoters to test their force.
- Cloning Strategies in E.coli
- Vector choice
- Restriction Enzyme
- Primers Design
- Cloning Strategies in S.cerevisiae
- Vector choice: Our finally vector will be a centromeric plasmid : YCplac22
- Restriction Enzyme
- Primers Design
