Bangalore
From 2007.igem.org
| Line 34: | Line 34: | ||
=='''A note on Multistability and Hysteresis'''== | =='''A note on Multistability and Hysteresis'''== | ||
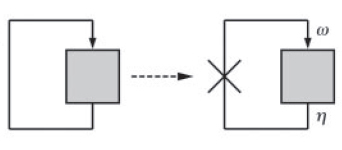
[[Image:Break_feedback_loop.jpg|thumb|200px|left|Fig. 2: Schematic view of a feedback system before (Left) and after (Right) breaking the feedback loop. ‘ω’ is the input of the open-loop system and ‘η’ is the output.]] | [[Image:Break_feedback_loop.jpg|thumb|200px|left|Fig. 2: Schematic view of a feedback system before (Left) and after (Right) breaking the feedback loop. ‘ω’ is the input of the open-loop system and ‘η’ is the output.]] | ||
| + | |||
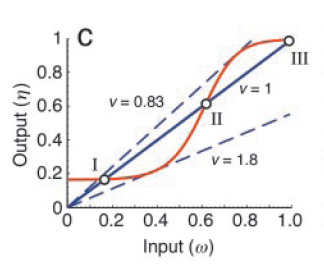
| + | [[Image:Io_curve.jpg|thumb|190px|left|Fig. 3: Steady state I/O static characteristic curve for the open loop of the mutually inhibitory Cdc2-Cyclin B/Wee1 feedback system (red). The solid blue line represents η as a function of ω for unitary feedback. There are three intersection points (I, II and III) which represent two stable steady states (I and III) and one unstable steady state (II). ]] | ||
In the recent past, multistability has been an important recurring theme in studies on cell signalling. Angeli et al (Ref. 2) have shown that for a class of feedback systems of arbitrary order, the stability properties and bifurcation diagram of the system can be deduced mathematically from how the system behaves when feedback is blocked. The system is guaranteed to be bistable for some range of feedback strengths provided the feedback-blocked system is monotone and shows a sigmoidal characteristic. | In the recent past, multistability has been an important recurring theme in studies on cell signalling. Angeli et al (Ref. 2) have shown that for a class of feedback systems of arbitrary order, the stability properties and bifurcation diagram of the system can be deduced mathematically from how the system behaves when feedback is blocked. The system is guaranteed to be bistable for some range of feedback strengths provided the feedback-blocked system is monotone and shows a sigmoidal characteristic. | ||
| Line 39: | Line 41: | ||
A simple graphical method can be used to deduce the stability behaviour of such systems (Ref. 2). The key feature of this approach is to view the positive feedback system as a feedback closure of its corresponding 'open loop' system. This open loop system is obtained by breaking the feedback loop at the point of feedback (Fig. 2). | A simple graphical method can be used to deduce the stability behaviour of such systems (Ref. 2). The key feature of this approach is to view the positive feedback system as a feedback closure of its corresponding 'open loop' system. This open loop system is obtained by breaking the feedback loop at the point of feedback (Fig. 2). | ||
| - | |||
Now, one can experimentally manipulate the amount of input (ω) and monitor the output (η) as a function of ω. The fixed points of the corresponding closed loop system are then obtained by intersecting η = f (ω) with the straight line, η = (1/ν) ω, where ' ν ' is the feedback strength. At these points of intersection, the open loop system exactly mimics the closed loop system (Fig. 3). | Now, one can experimentally manipulate the amount of input (ω) and monitor the output (η) as a function of ω. The fixed points of the corresponding closed loop system are then obtained by intersecting η = f (ω) with the straight line, η = (1/ν) ω, where ' ν ' is the feedback strength. At these points of intersection, the open loop system exactly mimics the closed loop system (Fig. 3). | ||
Revision as of 09:40, 29 May 2007
Contents |
The Company
- Mukund: Chief Mentor, Consultant and The Godfather
- Sugat: Right-hand Man and Manager of Operations
- Nilesh: The Man for all Seasons
- Vivek: Chief Troubleshooter, often his role is confused with one of a Troublemaker
- Krishna: The Sharpshooter
- Senthil: The Wikiman, also fondly referred to as the "Bio Info God"
- Varun: The Voice of Reason and Anti-Reason
- K12Z1: The Workhorse
The Mission
To investigate multistability and hysteresis in combinatorially constructed synthetic Vibrio quorum sensing circuits
The Target - Vibrio Quorum Sensing System
Quorum sensing is a phenomenon by which bacteria sense a critical cell density before turning on the expression of certain genes. It involves the gradual build-up of a chemical termed the 'autoinducer' in the cell. The autoinducer freely diffuses across the cell membrane and hence, its concentration is population density dependent. When the concentration crosses a threshold, the bacteria switch to a different physiological state such as bioluminescence, virulent gene expression, and bio-film formation.
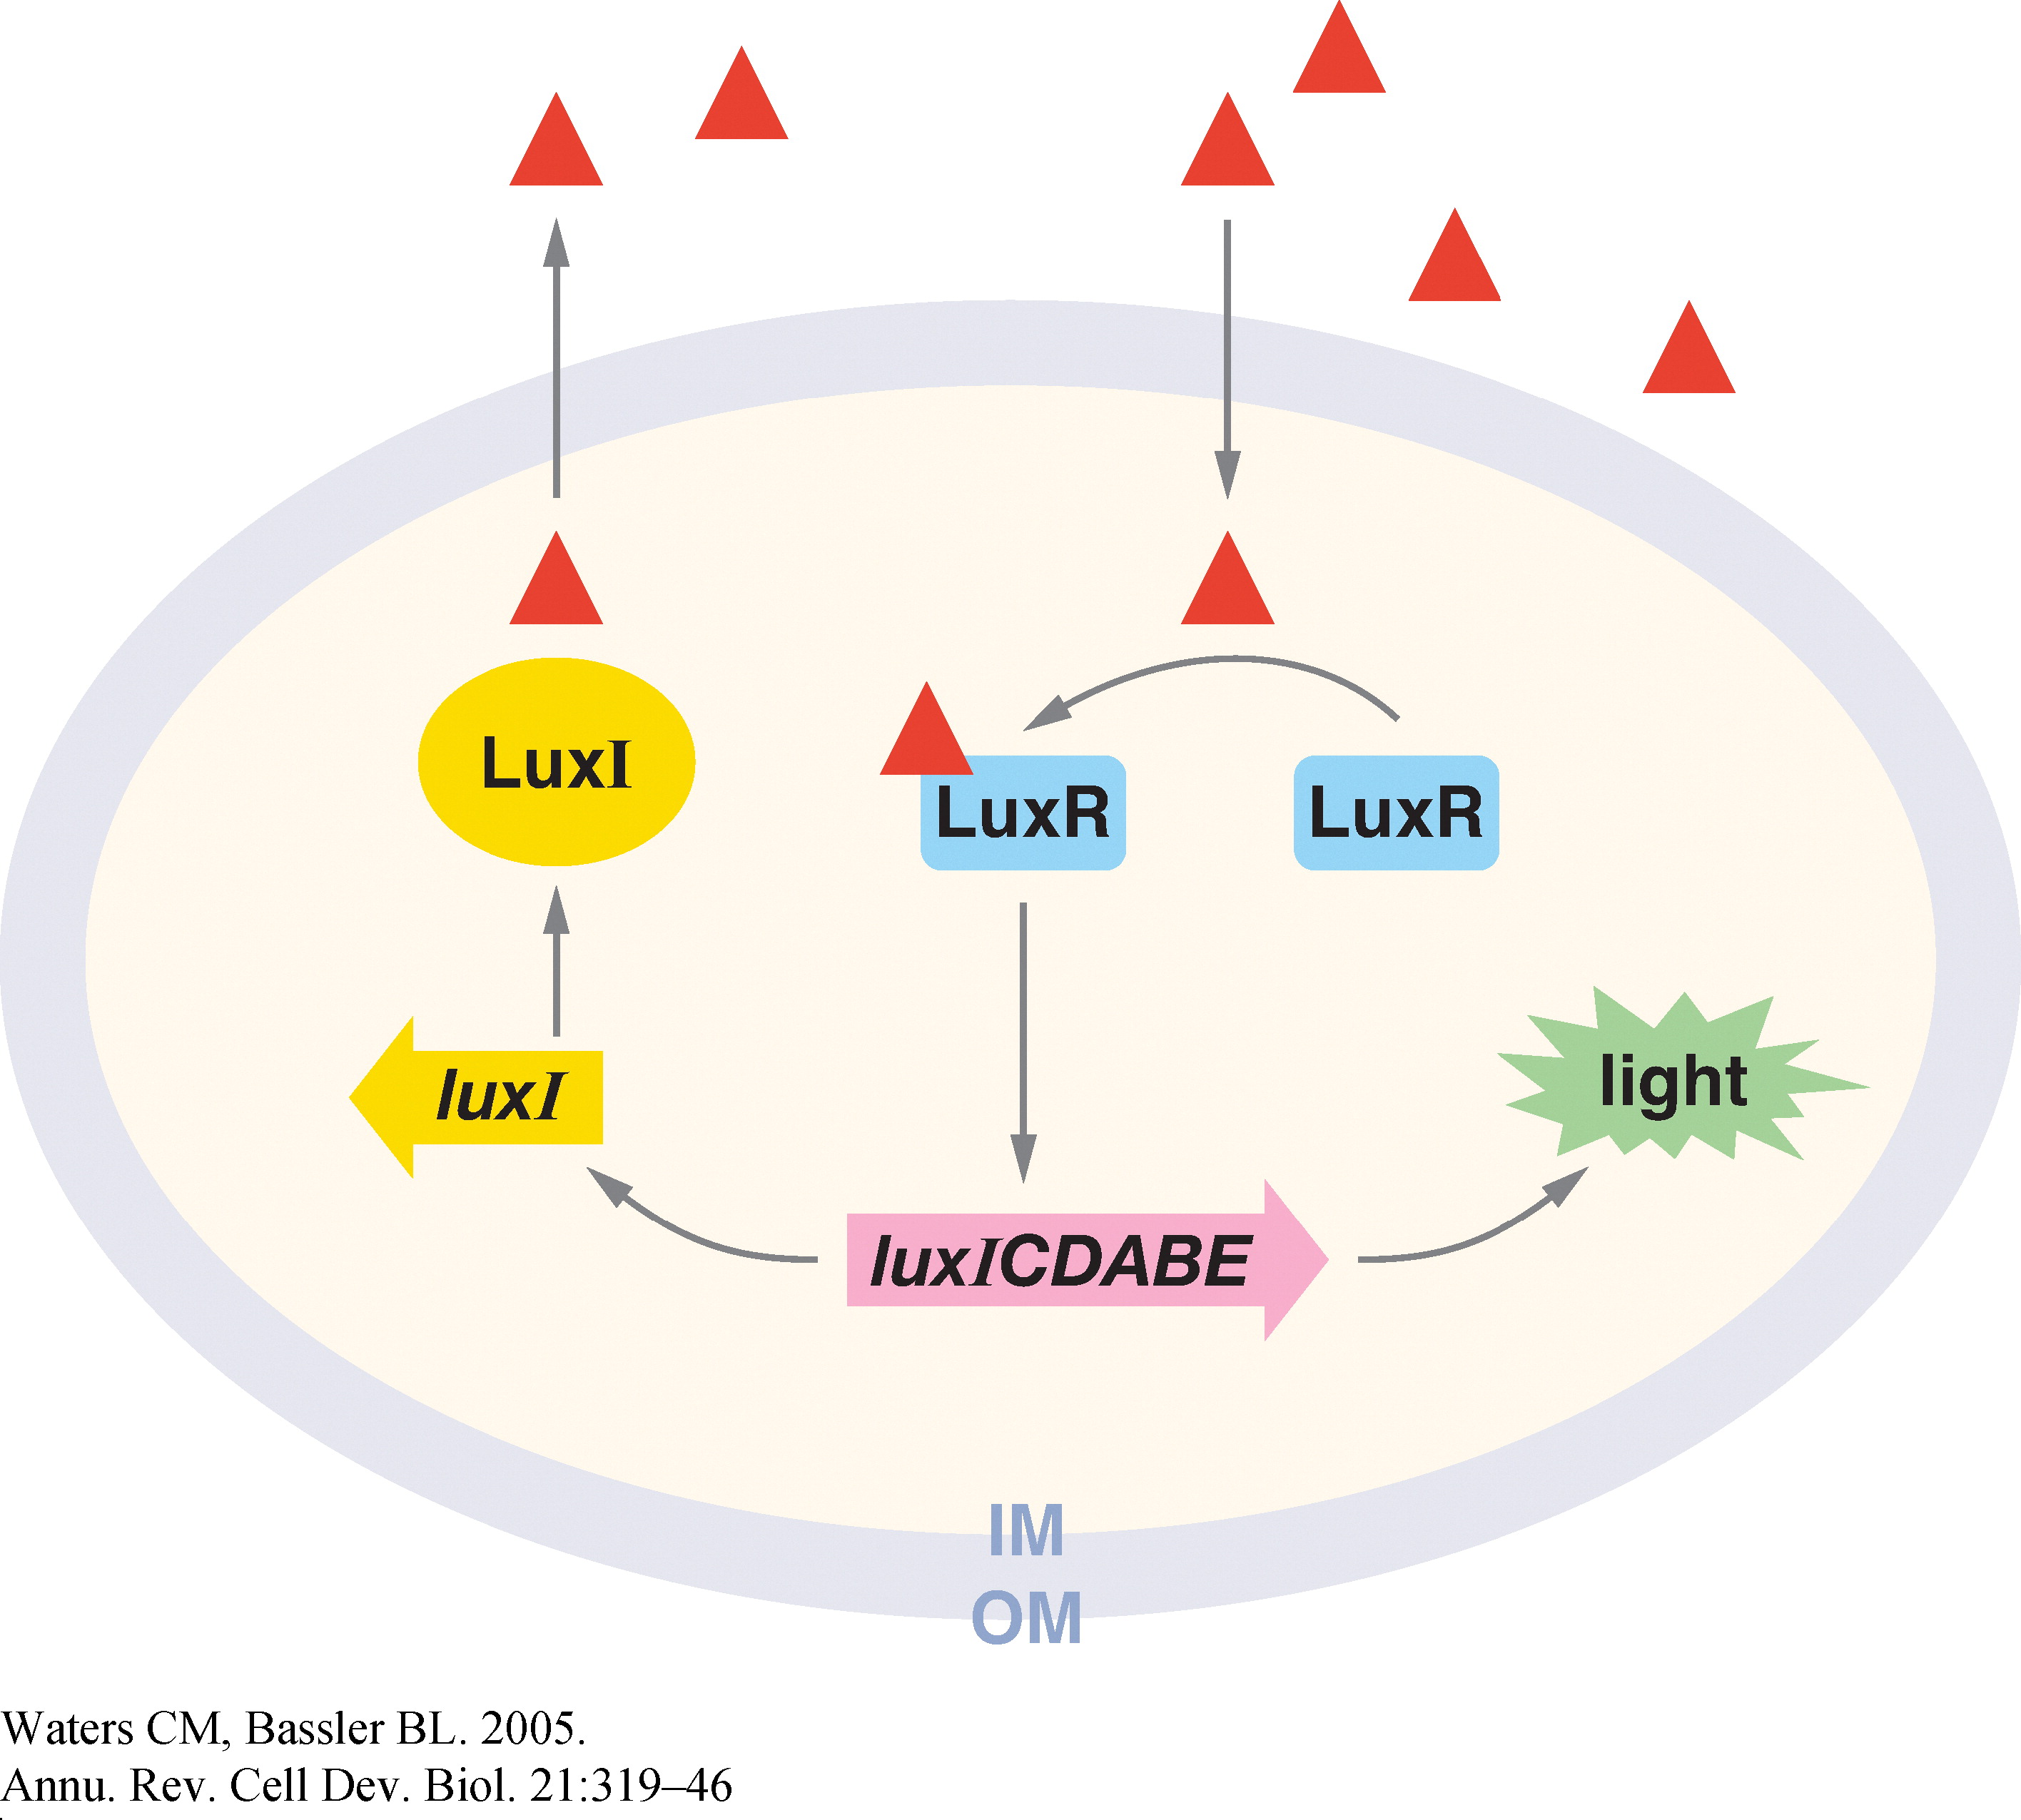
In Vibrio fischeri, when the population density (and hence the concentration of autoinducer) crosses a certain threshold, the expression of a set of genes that is required for bioluminescence is turned on. The production of the autoinducer is under the control of a gene, the expression of which involves positive feedback. Figure 1 shows the various components of this system (Ref. 1).
Why did we pick this system?
The Vibrio quorum sensing system involves a well-defined set of genes and a promoter, and has a degree of complexity that offers wide scope for exploration. Additionally, the concentration of the active transcriptional regulator, LuxR* is dependent on 3 factors: i) The concentration of LuxI ii) The population density iii) The concentration of LuxR
All these factors can be experimentally controlled. Thus, the nature of the system offers one an extremely good handle on the feedback strength of the genetic circuit.
A note on Multistability and Hysteresis

In the recent past, multistability has been an important recurring theme in studies on cell signalling. Angeli et al (Ref. 2) have shown that for a class of feedback systems of arbitrary order, the stability properties and bifurcation diagram of the system can be deduced mathematically from how the system behaves when feedback is blocked. The system is guaranteed to be bistable for some range of feedback strengths provided the feedback-blocked system is monotone and shows a sigmoidal characteristic.
A simple graphical method can be used to deduce the stability behaviour of such systems (Ref. 2). The key feature of this approach is to view the positive feedback system as a feedback closure of its corresponding 'open loop' system. This open loop system is obtained by breaking the feedback loop at the point of feedback (Fig. 2).
Now, one can experimentally manipulate the amount of input (ω) and monitor the output (η) as a function of ω. The fixed points of the corresponding closed loop system are then obtained by intersecting η = f (ω) with the straight line, η = (1/ν) ω, where ' ν ' is the feedback strength. At these points of intersection, the open loop system exactly mimics the closed loop system (Fig. 3).

