Imperial/Infector Detector/Testing
From 2007.igem.org
(→Discussion and Validation) |
|||
| Line 4: | Line 4: | ||
== Aims == | == Aims == | ||
The sensitivity of the system is to be determined through this experiment. To do this, we induce the system with known concentrations of AHL. We then record the change in GFP, such that we can calculate the rate of GFP production relative to concentration of AHL in solution. | The sensitivity of the system is to be determined through this experiment. To do this, we induce the system with known concentrations of AHL. We then record the change in GFP, such that we can calculate the rate of GFP production relative to concentration of AHL in solution. | ||
| - | * To determine the rate | + | * To determine the rate of protein production relative to concentration of AHL |
* To determine the response time relative to concentration of AHL | * To determine the response time relative to concentration of AHL | ||
* To determine the steady state response of protein relative to concentration of AHL | * To determine the steady state response of protein relative to concentration of AHL | ||
| Line 21: | Line 21: | ||
* 9.8µl Nuclease-Free Water | * 9.8µl Nuclease-Free Water | ||
| - | + | ==== Recording Results ==== | |
| - | + | [A little about when and how to read the plates, maybe...] | |
== Testing and Results == | == Testing and Results == | ||
| + | ==== Determine AHL sensitivity ==== | ||
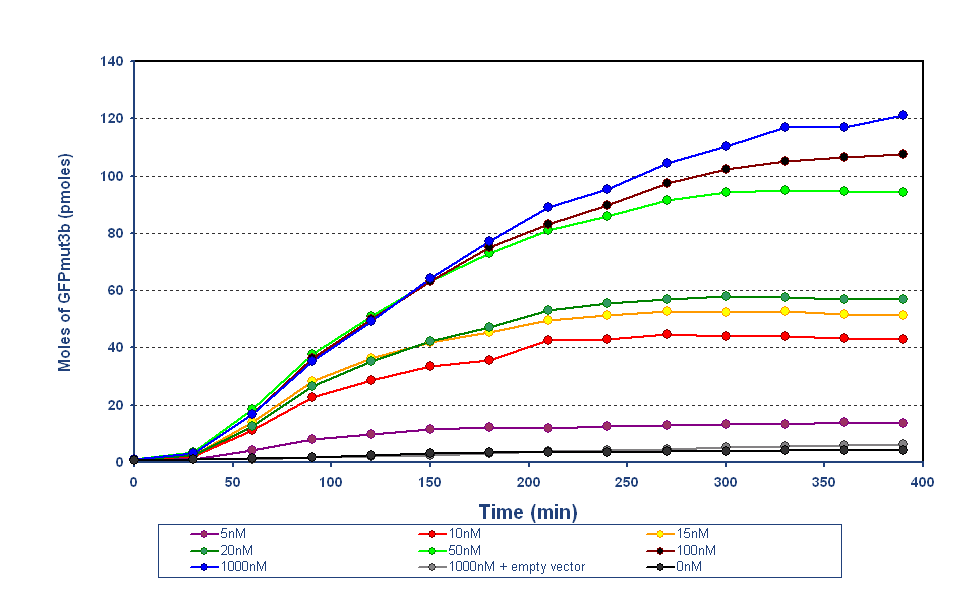
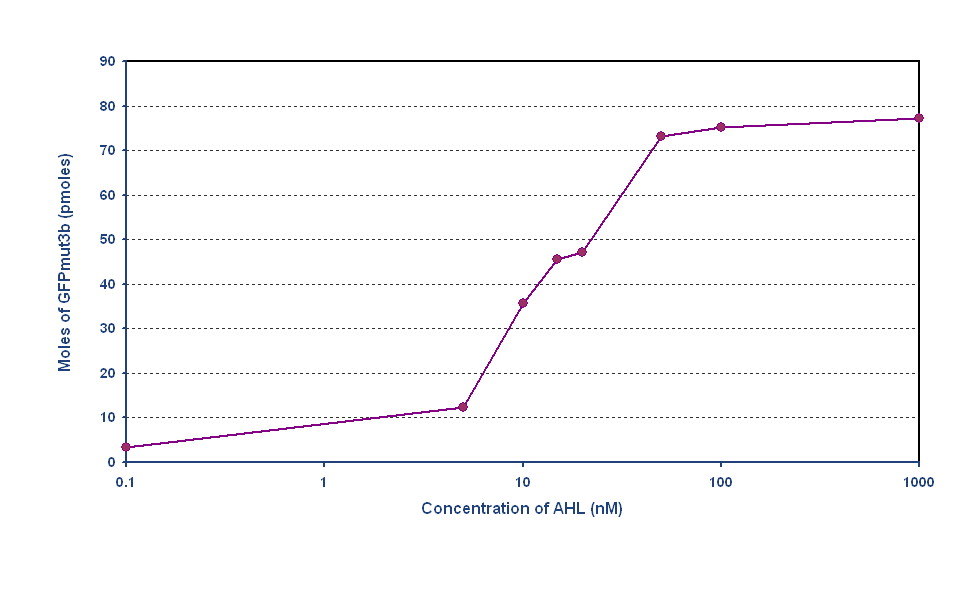
| + | We first induced the system with varying concentrations of AHL to determine the output of the system. From the results, we were able to determine that the sensitivity range of the system was indeed between 5-50 nM, which is what was specified earlier. We can thus calibrate the system to give a visual output at this range of AHL concentrations. | ||
| + | [[Image:Imperial ID testing transient1.png|thumb|left|430px|Transient reponse of the system at different AHL concentrations. There is a clear trend that with increasing amount of AHL concentration, the GFP output of the system also increases.]] | ||
| + | [[Image:Imperial ID testing transfer1.png|thumb|right|430px|The transfer function of our system - with the output of GFP at 3 hours af varying AHL inputs. This curve behaves similiarly as it would ''in vivo'', with the highest sensitivity at around 5-50nM.]] | ||
| + | == Discussion and Validation == | ||
| - | |||
| - | |||
| - | |||
<center> [https://2007.igem.org/Imperial/Infector_Detector/Implementation << Implementation] | Testing/Validation | [https://2007.igem.org/Imperial Home >>] | <center> [https://2007.igem.org/Imperial/Infector_Detector/Implementation << Implementation] | Testing/Validation | [https://2007.igem.org/Imperial Home >>] | ||
</center> | </center> | ||
Revision as of 08:30, 23 October 2007

Aims
The sensitivity of the system is to be determined through this experiment. To do this, we induce the system with known concentrations of AHL. We then record the change in GFP, such that we can calculate the rate of GFP production relative to concentration of AHL in solution.
- To determine the rate of protein production relative to concentration of AHL
- To determine the response time relative to concentration of AHL
- To determine the steady state response of protein relative to concentration of AHL
Materials and Methods
AHL Dilutions
8 concentrations of AHL were tested - 0, 5, 10, 15, 20, 50, 100, 1000 nM. These concentrations of AHL were produced by serial dilutions. Indepth protocols of these dilutions are documented at AHL dilutions page.
Preparing Cell Extract
The following mixture was made
- 20µl Premix Solution
- 15µl S30 Cell Extract
- 2.5µl Amino Acid Mixture 1
- 2.5µl Amino Acid Mixture 2
- 10.2µl DNA (4 µg)
- 9.8µl Nuclease-Free Water
Recording Results
[A little about when and how to read the plates, maybe...]
Testing and Results
Determine AHL sensitivity
We first induced the system with varying concentrations of AHL to determine the output of the system. From the results, we were able to determine that the sensitivity range of the system was indeed between 5-50 nM, which is what was specified earlier. We can thus calibrate the system to give a visual output at this range of AHL concentrations.

