Tianjin/DIODE
From 2007.igem.org
(Difference between revisions)
Lovecarrot (Talk | contribs) (→Model) |
Lovecarrot (Talk | contribs) (→Model) |
||
| Line 23: | Line 23: | ||
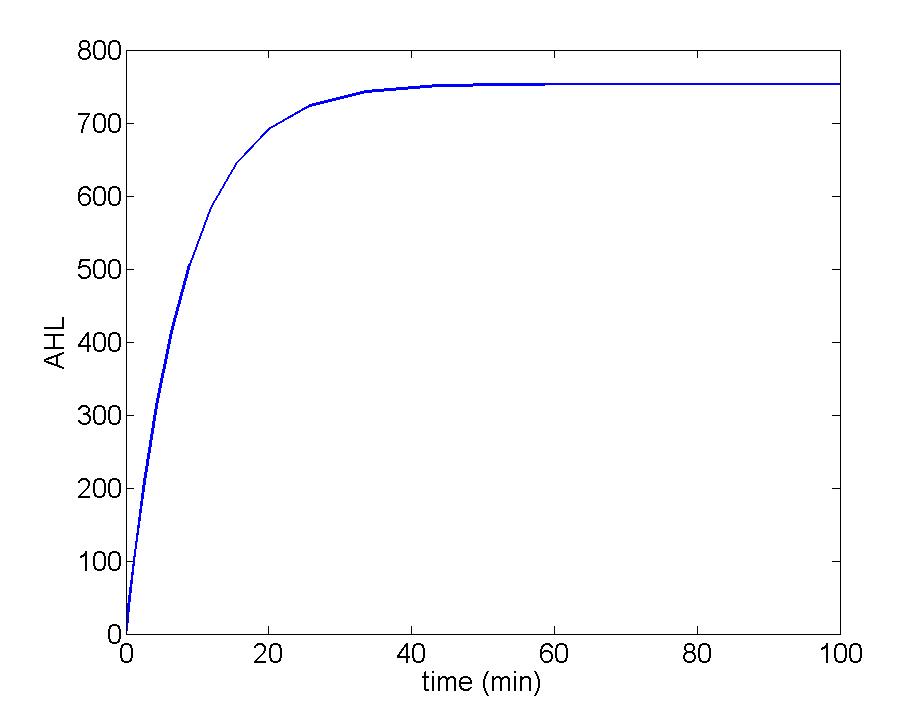
Figure 3: concentration of AHL increases expotentially during the first 40 minutes after the input of liquid culture, but keep constant from then on. | Figure 3: concentration of AHL increases expotentially during the first 40 minutes after the input of liquid culture, but keep constant from then on. | ||
[[Image:TJU4L.jpg|500px]]<br> | [[Image:TJU4L.jpg|500px]]<br> | ||
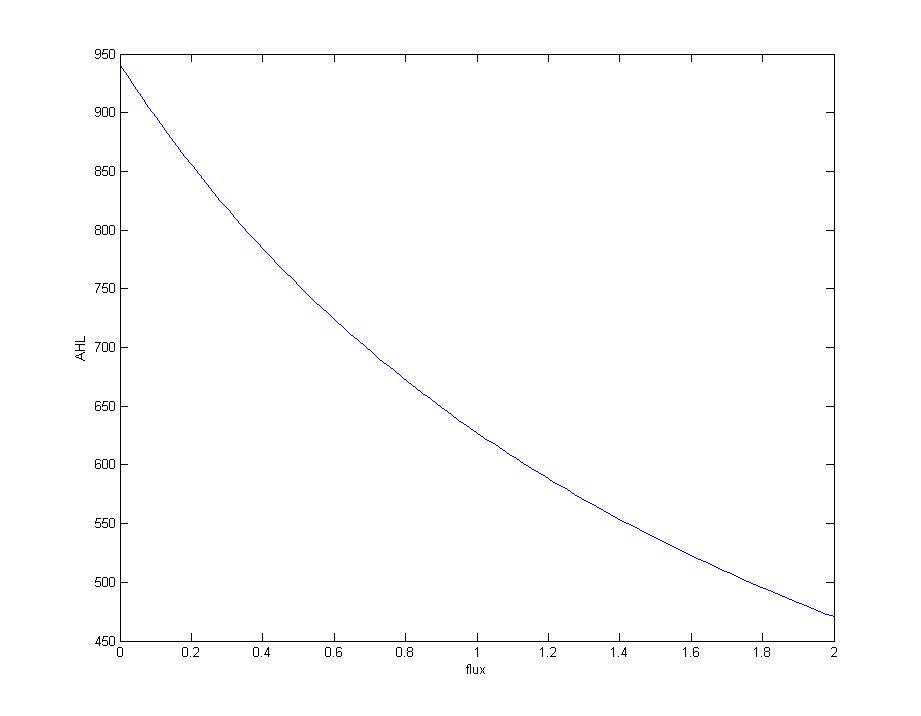
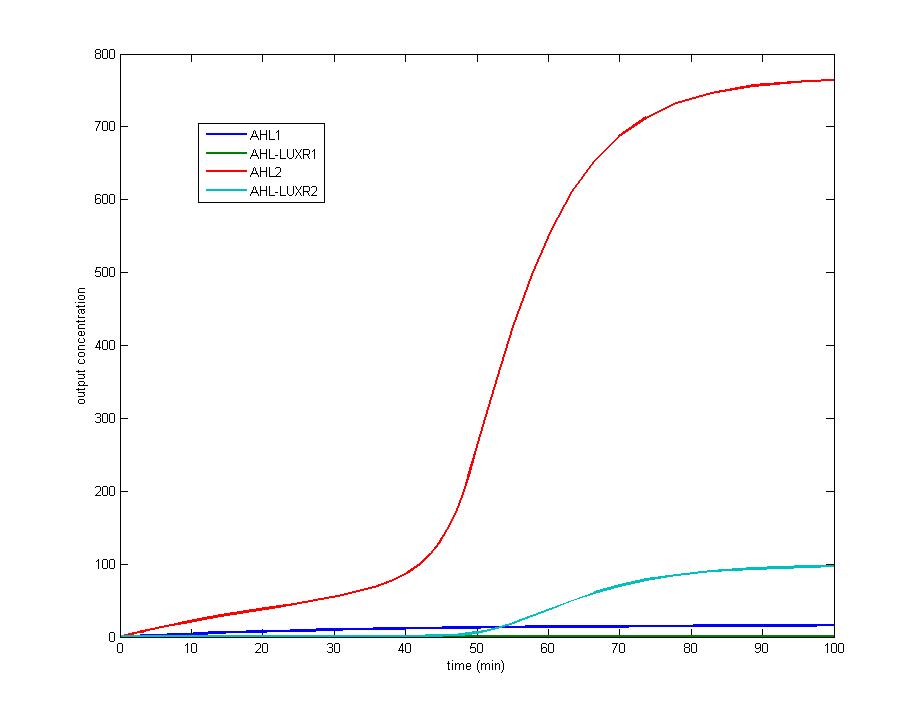
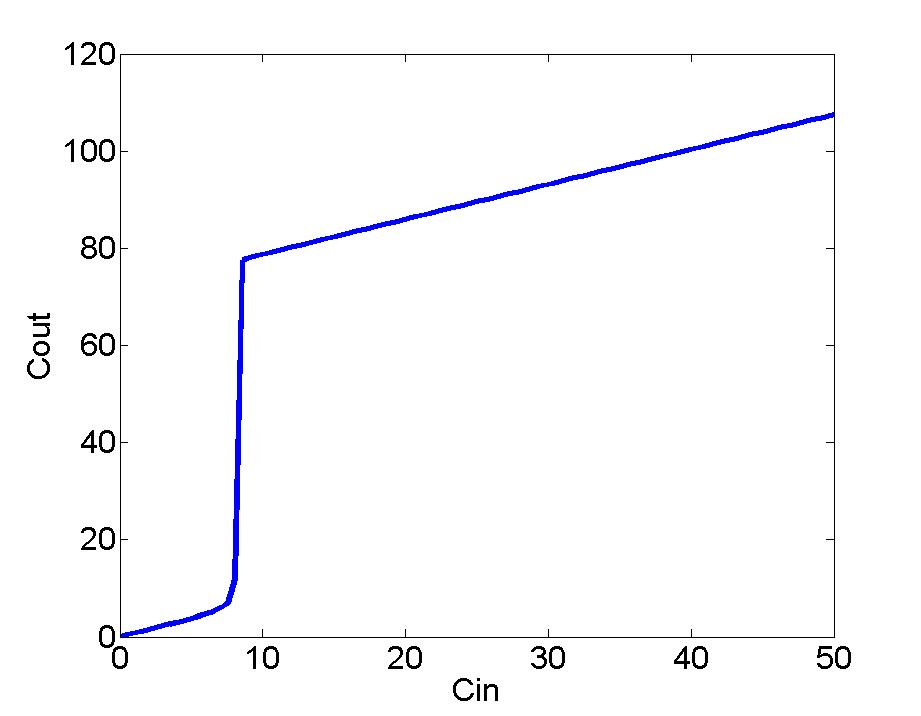
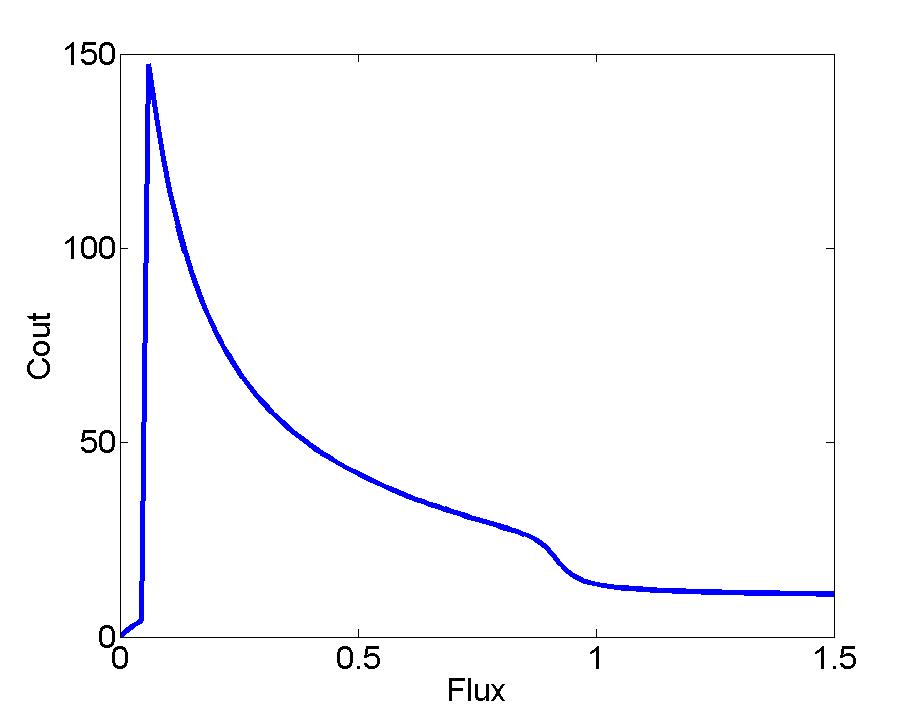
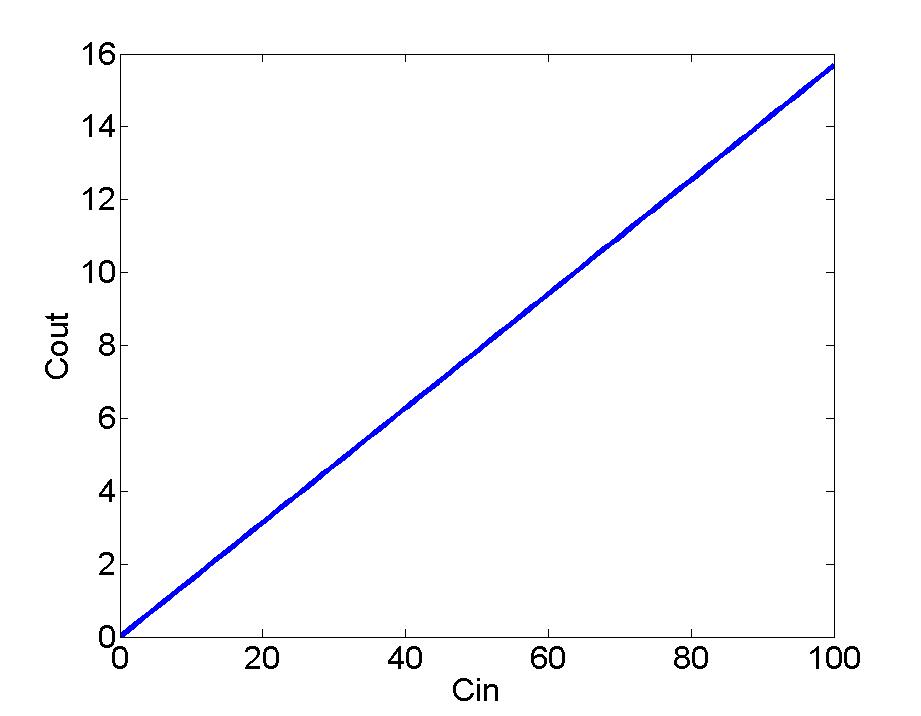
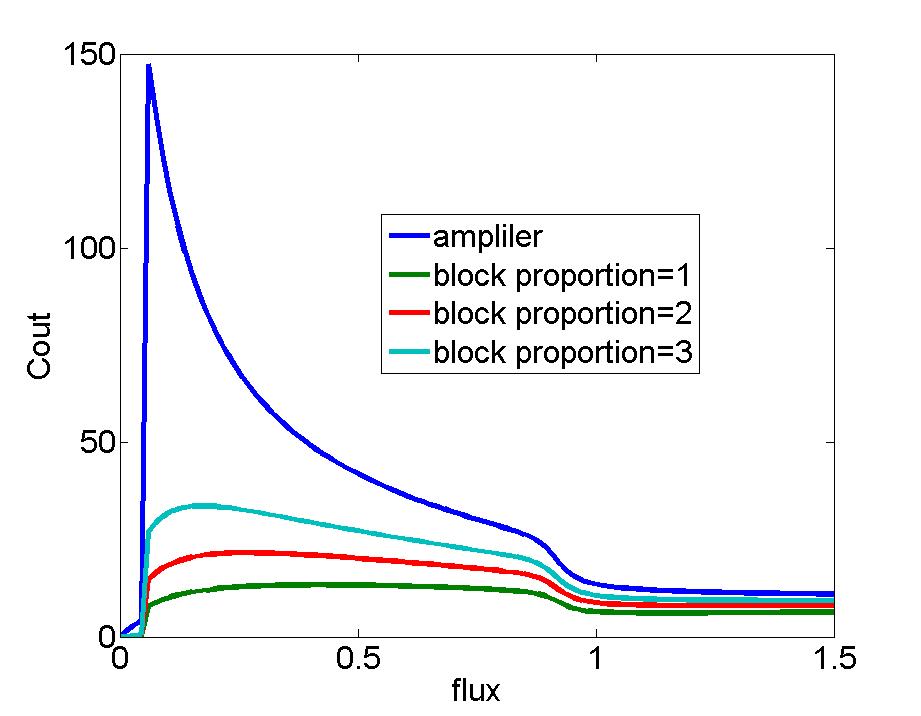
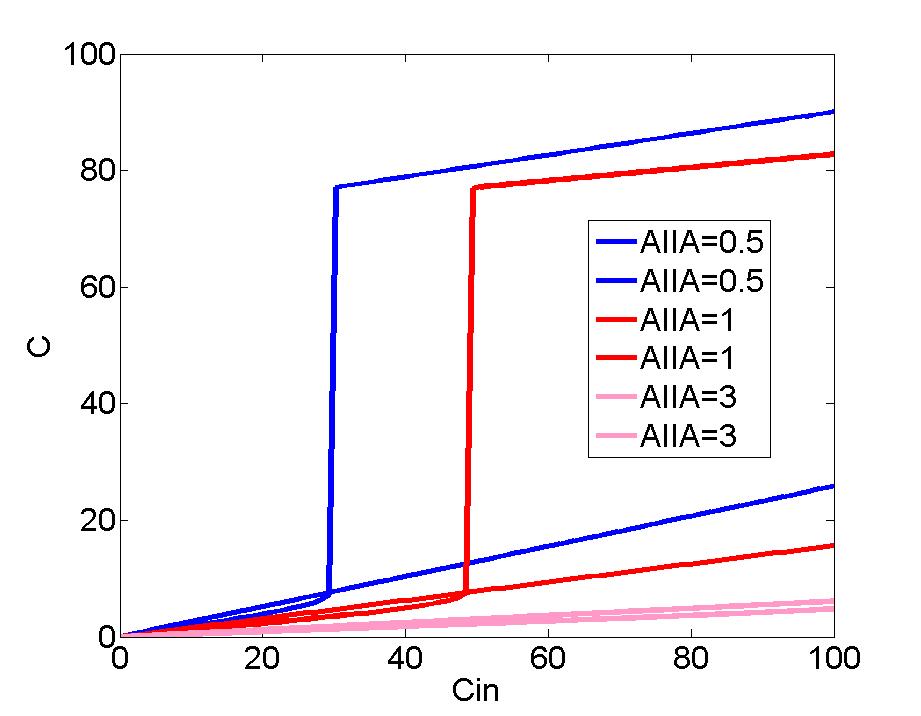
| + | Figure 4: Rough description of relationship between the input of AHL signal and the output of AHL signal when the flux passes through the amplified cells. Low concentration input failed to initialize the amplication process. | ||
| + | [[Image:TJU8P1.jpg|500px]]<br> | ||
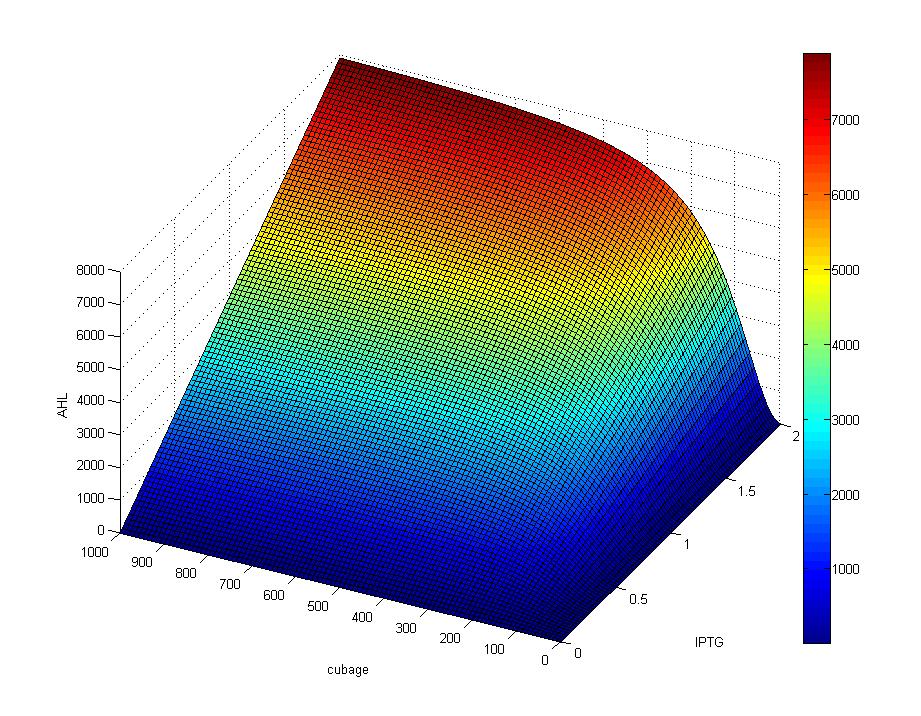
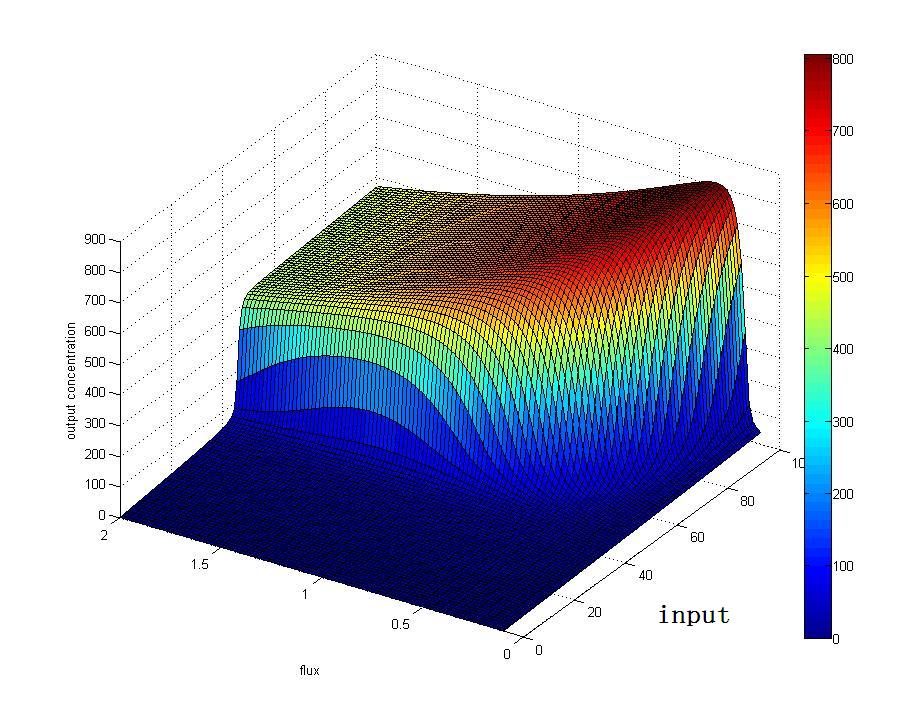
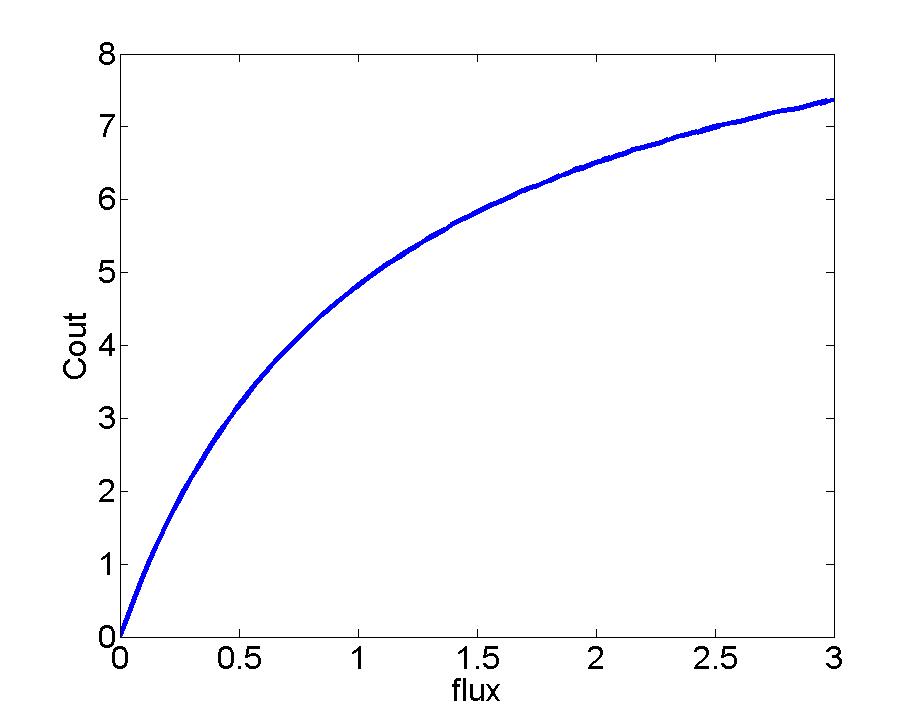
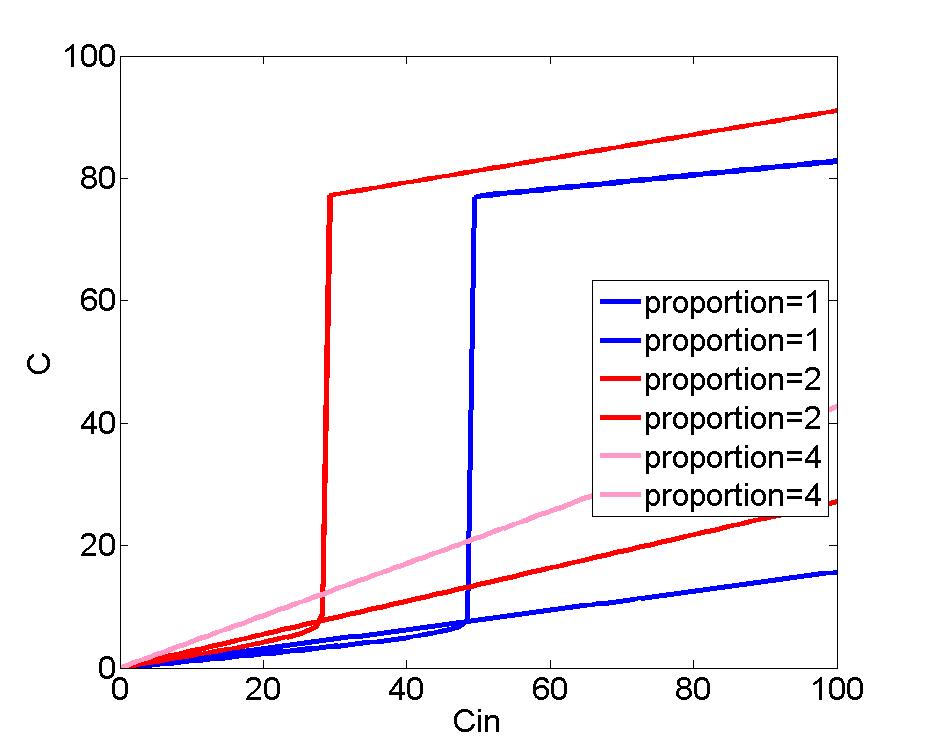
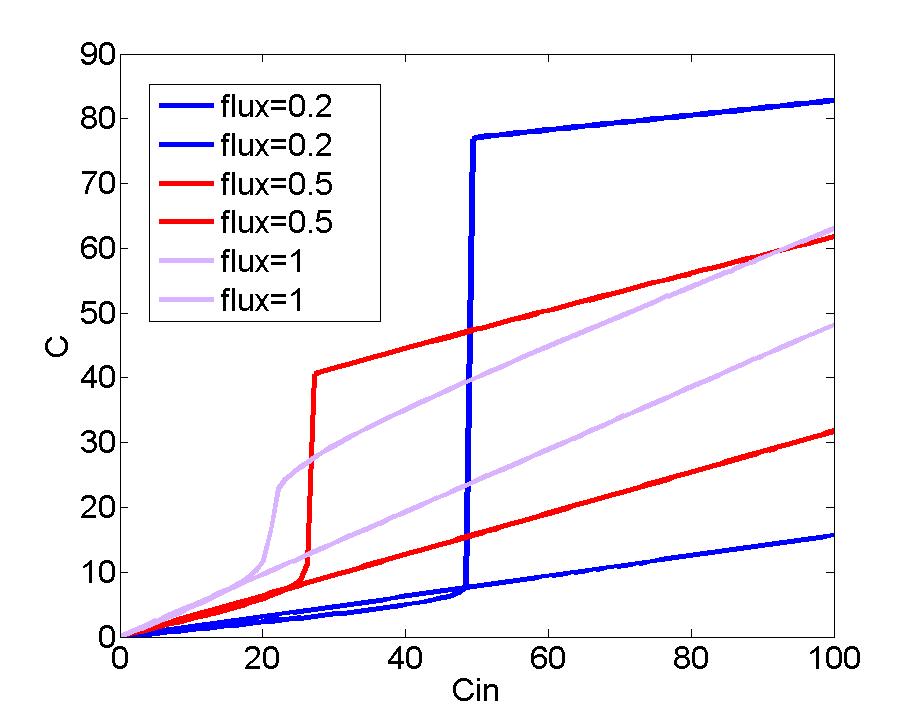
| + | Figure 5: With the rising of flux and input signal, the output signal tend to rocketrise at a particular value,which indicates the value of threshold. | ||
| + | [[Image:TJU8P2.jpg|500px]]<br> | ||
==Experiment== | ==Experiment== | ||
