Tianjin/FLIP-FLOP/Experiment/result
From 2007.igem.org
(Difference between revisions)
Sunlovedie (Talk | contribs) |
Sunlovedie (Talk | contribs) |
||
| Line 1: | Line 1: | ||
{| | {| | ||
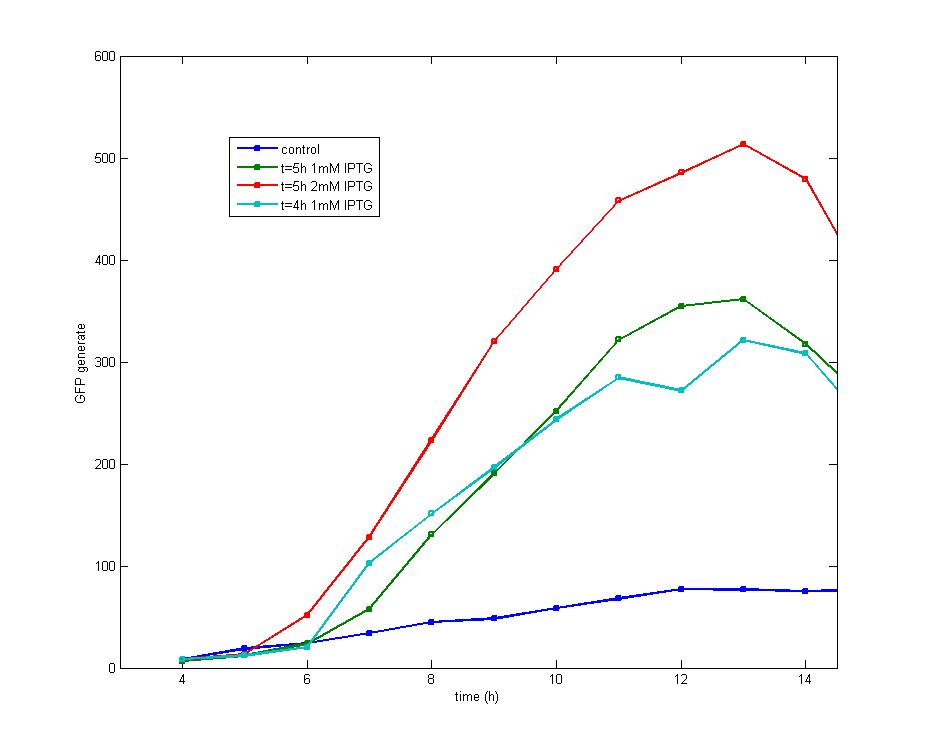
Figure 1<br> | Figure 1<br> | ||
| - | [[Image:tjuexpff201.jpg| | + | [[Image:tjuexpff201.jpg|500px]]<br> |
After the addition of 1 mM IPTG into cultures with an OD600 value of 0.4(cultured for 4 hours) and 0.6(cultured for 5 hours) respectively, it is discovered that both share the similar shape of GFP fluorescence peak while early addition of IPTG could produce early peak. Addition of 2mM IPTG tends to produce a higher peak than 1mM IPTG at the OD600=0.6, but both curves share the same changing tendency.<br><br> | After the addition of 1 mM IPTG into cultures with an OD600 value of 0.4(cultured for 4 hours) and 0.6(cultured for 5 hours) respectively, it is discovered that both share the similar shape of GFP fluorescence peak while early addition of IPTG could produce early peak. Addition of 2mM IPTG tends to produce a higher peak than 1mM IPTG at the OD600=0.6, but both curves share the same changing tendency.<br><br> | ||
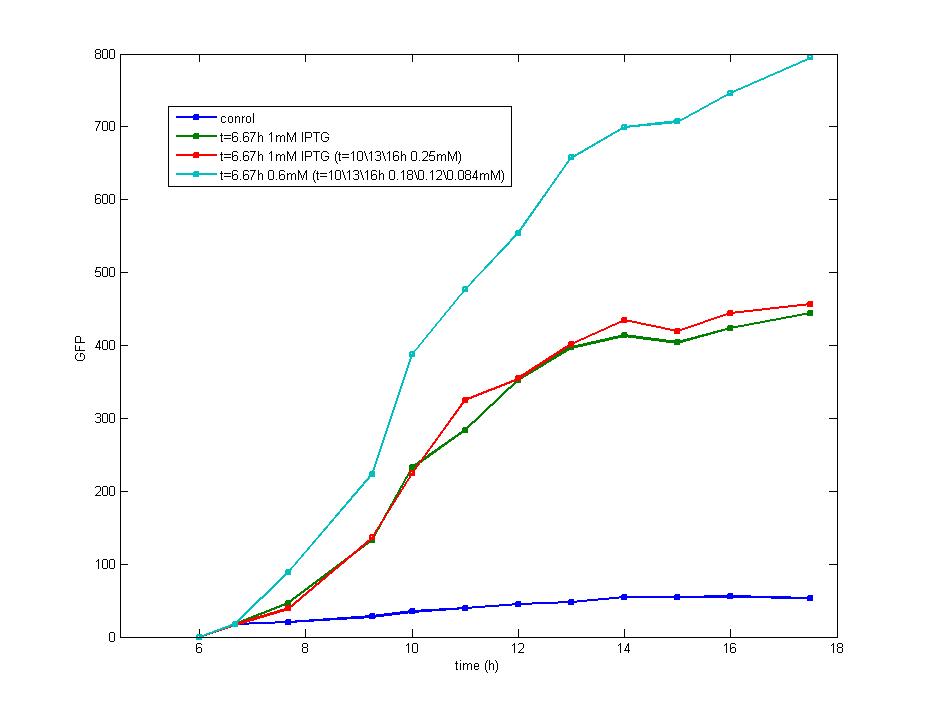
Figure 2<br> | Figure 2<br> | ||
| - | [[Image:tjuexpff202.jpg| | + | [[Image:tjuexpff202.jpg|500px]]<br> |
The supplement of IPTG exerts little effect on the shape of curves indicating the induction of IPTG mainly occurs at the beginning of impulse and keep stable since then on. | The supplement of IPTG exerts little effect on the shape of curves indicating the induction of IPTG mainly occurs at the beginning of impulse and keep stable since then on. | ||
The fluorescence intensity tends to increase constantly with addition of AHL instead of IPTG, as the blue line shows, while under the latter condition it becomes steady and has a lower value than that with addition of AHL, proving that the induction of IPTG triggers the inhibition of LuxR Protein expression.<br><br> | The fluorescence intensity tends to increase constantly with addition of AHL instead of IPTG, as the blue line shows, while under the latter condition it becomes steady and has a lower value than that with addition of AHL, proving that the induction of IPTG triggers the inhibition of LuxR Protein expression.<br><br> | ||
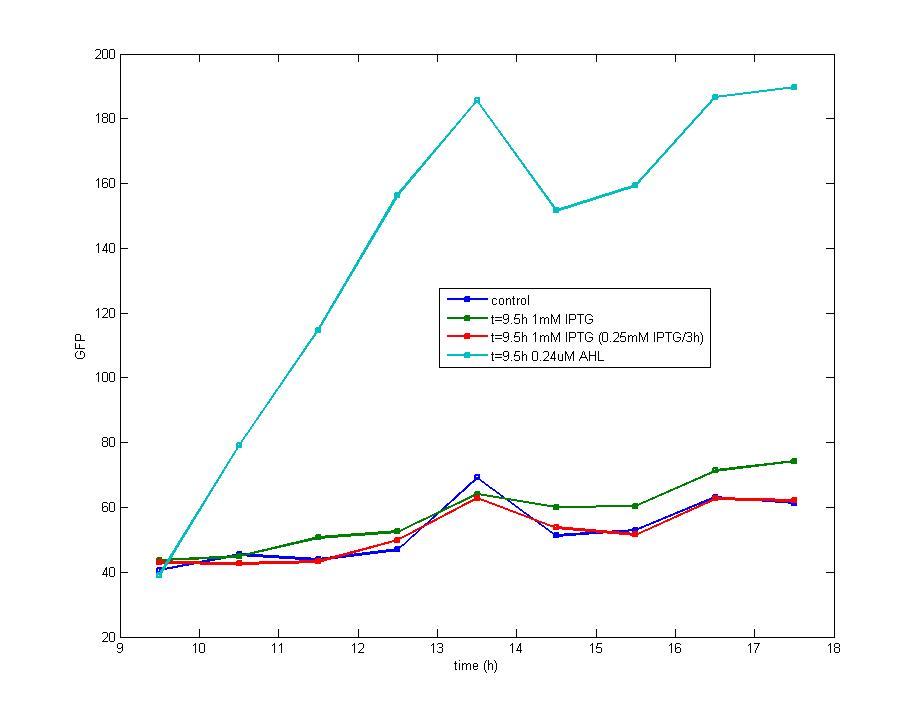
Figure 3<br> | Figure 3<br> | ||
| - | [[Image:tjuexpff203.jpg| | + | [[Image:tjuexpff203.jpg|500px]]<br> |
The impulse of IPTG at the stationary phase could not stimulate the production of fluorescence protein which is shown in this graph. Considering the addition of AHL could also result in the accumulation of fluorescence protein which support the existence of LuxR protein, we know the IPTG could not induce the transcription of LacI promoter during the stationary phase.<br><br> | The impulse of IPTG at the stationary phase could not stimulate the production of fluorescence protein which is shown in this graph. Considering the addition of AHL could also result in the accumulation of fluorescence protein which support the existence of LuxR protein, we know the IPTG could not induce the transcription of LacI promoter during the stationary phase.<br><br> | ||
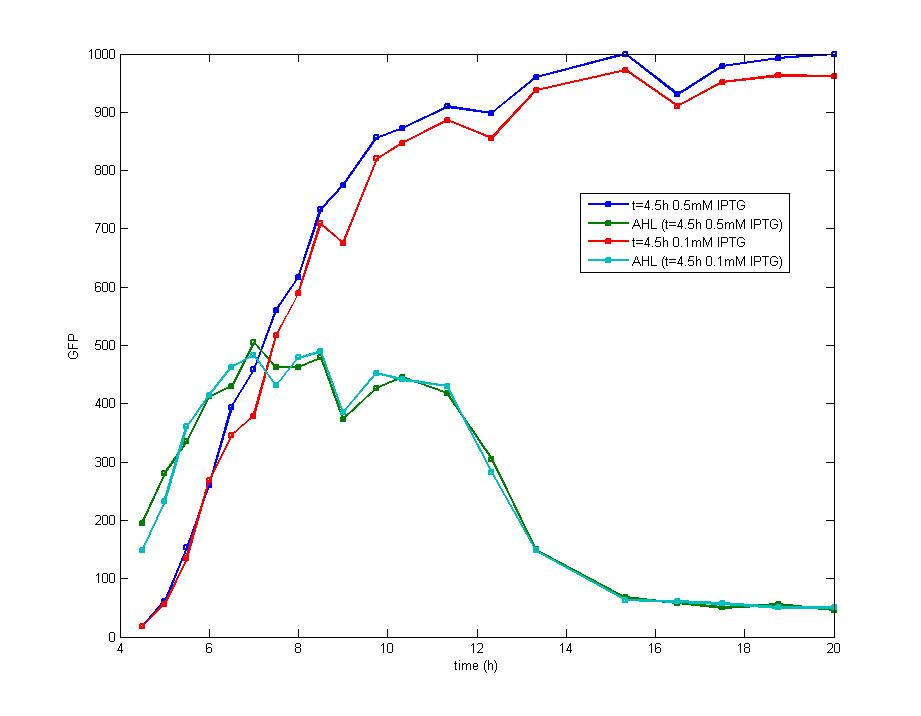
Figure 4<br> | Figure 4<br> | ||
| - | [[Image:tjuexpff204.jpg| | + | [[Image:tjuexpff204.jpg|500px]]<br> |
The concentration of extracellular AHL is examined after the induction of diluted IPTG and it seems there is no difference between the result of 0.5mM IPTG and 0.1mM IPTG. The AHL contents decreased remarkably during the stationary phase which could be attributed to the fast degradation rate and the cease of IPTG induction.<br><br> | The concentration of extracellular AHL is examined after the induction of diluted IPTG and it seems there is no difference between the result of 0.5mM IPTG and 0.1mM IPTG. The AHL contents decreased remarkably during the stationary phase which could be attributed to the fast degradation rate and the cease of IPTG induction.<br><br> | ||
Figure 5 <br> | Figure 5 <br> | ||
| - | [[Image:tjuexpff205.jpg| | + | [[Image:tjuexpff205.jpg|500px]]<br> |
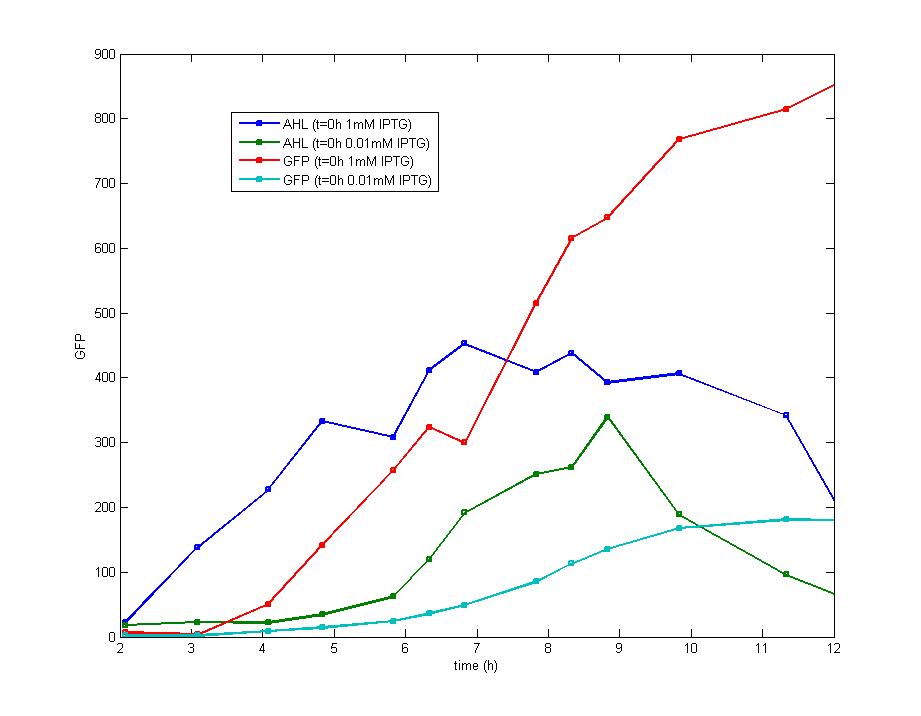
The addition of IPTG with a concentration of 1 mM and 0.1 mM individually at the inoculation makes no diversity on the induction behavior ,but the fluorescence intensity varies at the highest level. <br> | The addition of IPTG with a concentration of 1 mM and 0.1 mM individually at the inoculation makes no diversity on the induction behavior ,but the fluorescence intensity varies at the highest level. <br> | ||
<br><br> | <br><br> | ||
| Line 23: | Line 23: | ||
<br><br> | <br><br> | ||
Figure 6<br> | Figure 6<br> | ||
| - | [[Image:tjuexpff206.jpg| | + | [[Image:tjuexpff206.jpg|500px]]<br> |
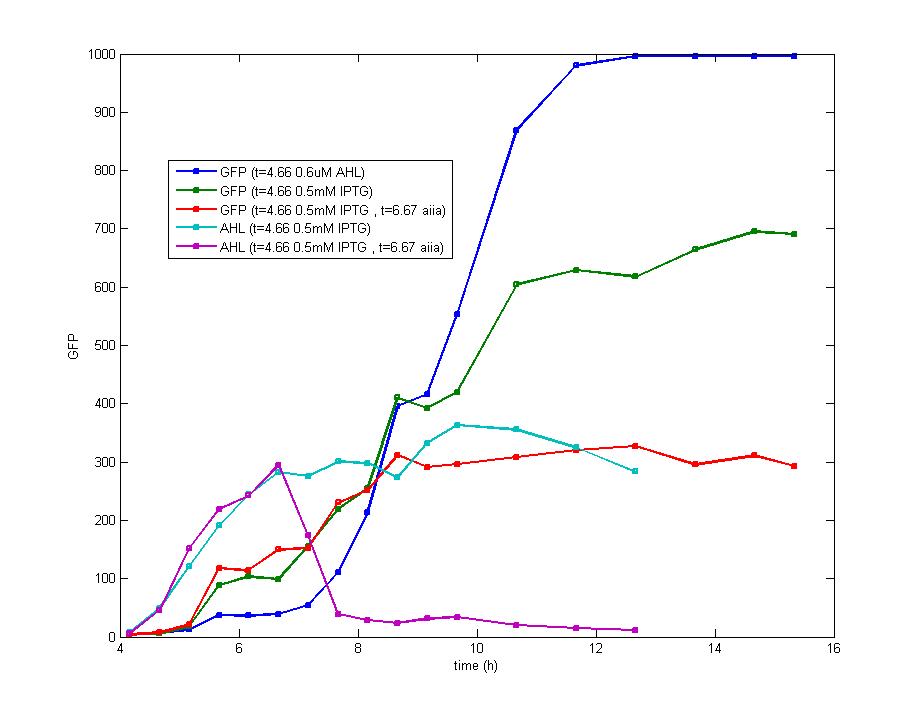
AHL exists in the culture during the whole exponential phase as the blue line displays. However, the green curve implies that the expression of fluorescence protein has been ceased 6 hours after the induction. Therefore, cI promoter has been inhibited to express luxR protein and original LuxR protein has been combined as well as degraded to a low level that fails to initialize the expression of fluorescence protein, which matches the model of flip-flop perfectly. | AHL exists in the culture during the whole exponential phase as the blue line displays. However, the green curve implies that the expression of fluorescence protein has been ceased 6 hours after the induction. Therefore, cI promoter has been inhibited to express luxR protein and original LuxR protein has been combined as well as degraded to a low level that fails to initialize the expression of fluorescence protein, which matches the model of flip-flop perfectly. | ||
On the other hand, the fluorescence intensity of cells with the addition of AHL tends to be higher than the addition of IPTG, proving the induction of IPTG did inhibit the activity of cI promoter which reduces the production of LuxR. | On the other hand, the fluorescence intensity of cells with the addition of AHL tends to be higher than the addition of IPTG, proving the induction of IPTG did inhibit the activity of cI promoter which reduces the production of LuxR. | ||
