Paris/Robustness and optimization
From 2007.igem.org
(→Kinetic Parameters) |
m (→Optimization) |
||
| Line 160: | Line 160: | ||
The population exhibits an exponential growth of type exp(kt). In order to measure the relative growth of each set of parameters we compare value k in the exponential. The wild type has a growth k=λ<sub>div</sub>-λ<sub>death</sub>=0.055. For p*, the apparent growth is exponential with k=0.013. The best value for design (1) is 0.049 and is obtained for κ<sub>cre</sub>=κ<sub>cre</sub><sup>*</sup> /20, κ<sub>dap</sub>=κ<sub>dap</sub><sup>*</sup> *100 and θ<sub>cre</sub><sup>dap</sup>=θ<sub>cre</sub><sup>dap*</sup> * 4. For design 2 the best value is 0.044 and is obtained for κ<sub>cre</sub>=κ<sub>cre</sub><sup>*</sup> /100, κ<sub>dap</sub>=κ<sub>dap</sub><sup>*</sup>*100. | The population exhibits an exponential growth of type exp(kt). In order to measure the relative growth of each set of parameters we compare value k in the exponential. The wild type has a growth k=λ<sub>div</sub>-λ<sub>death</sub>=0.055. For p*, the apparent growth is exponential with k=0.013. The best value for design (1) is 0.049 and is obtained for κ<sub>cre</sub>=κ<sub>cre</sub><sup>*</sup> /20, κ<sub>dap</sub>=κ<sub>dap</sub><sup>*</sup> *100 and θ<sub>cre</sub><sup>dap</sup>=θ<sub>cre</sub><sup>dap*</sup> * 4. For design 2 the best value is 0.044 and is obtained for κ<sub>cre</sub>=κ<sub>cre</sub><sup>*</sup> /100, κ<sub>dap</sub>=κ<sub>dap</sub><sup>*</sup>*100. | ||
| - | + | Here are the simulation obtained for these values in both designs : | |
[[Image:Opt2000.png|left|450px|refGS]] | [[Image:Opt2000.png|left|450px|refGS]] | ||
| Line 169: | Line 169: | ||
First, we notice that the regulated system has a better start : high Cre concentration leads to a rapid increase in S cells and thus to higher dap amounts and a better growth of G cells. After intialisation phase is over the regulated system is still better : inhibition of Cre synthesis allows a lower Cre concentration, a lower differentiation rate that is a higher G/S ratio and a better growth. | First, we notice that the regulated system has a better start : high Cre concentration leads to a rapid increase in S cells and thus to higher dap amounts and a better growth of G cells. After intialisation phase is over the regulated system is still better : inhibition of Cre synthesis allows a lower Cre concentration, a lower differentiation rate that is a higher G/S ratio and a better growth. | ||
| - | |||
| - | |||
| - | |||
| - | |||
| - | |||
| - | |||
| - | |||
| - | |||
| - | |||
==Summary== | ==Summary== | ||
Revision as of 00:50, 26 October 2007
In section Design process two designs have been proposed. The only difference is that one of them incorporates a negative feedback of cre recombinase by dap. We developed simple models to evaluate the relative benefits of both designs in term of robustness and optimization capabilities.
Contents |
Introduction
This model aims at assessing robustness of the system with regards to kinetic parameters and initial condition variations and at investigating the possibilities to tune the system to improve its behavior. Additionaly, we would like to compare the robustness and optimization capabilities of two slightly different designs, one with a constant rate of synthesis of cre recombinase and one with a rate of synthesis driven by the concentration of Dap.
This approach differs from the first one by the level of description of the model
and the numerical analysis done on the model. More precisely, it is based on a set of differential equations describing Dap synthesis, Cre synthesis, Dap transport, differentiation of germen bacteria into soma and bacteria death.
We first provide a set of kinetic parameters such that the numerical simulation validate a given minimal behavior.
Then we analyze the system robustness with regard to variations of its kinetic parameters and initial condition and finally we investigate ways to optimize the system behavior by adjusting some biologically relevant parameters.
Problem description
System
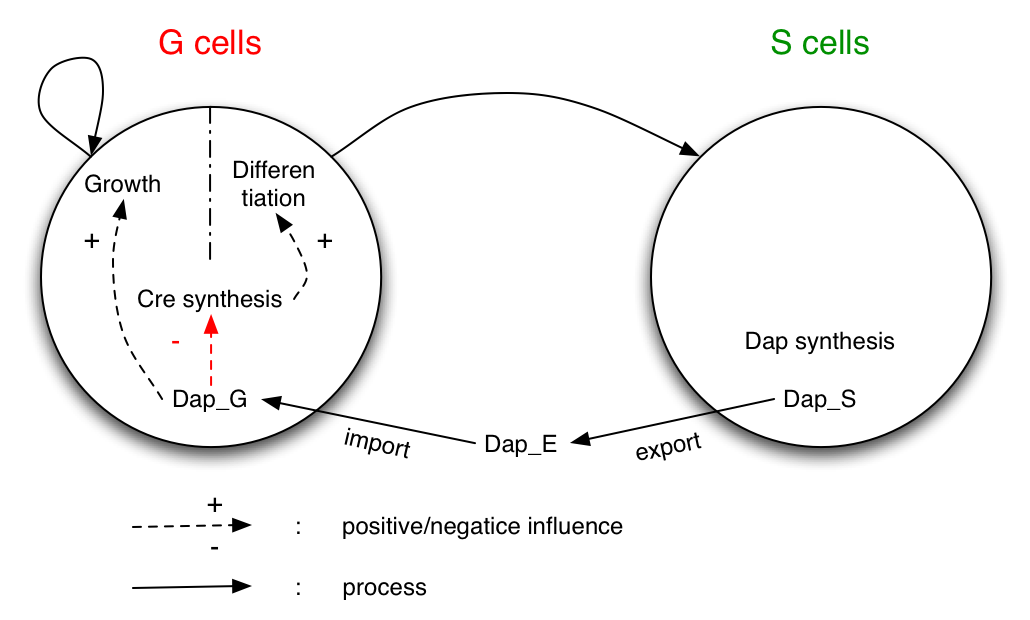
The system studied is made of two populations of bacteria G (germen) and S (soma). Bacteria G can either divide or differentiate into S.
Dap is only synthesized by bacteria S and diffuses in the environment and in G.
G is dependent of Dap for division. Differentiation of G is controlled by Cre. Cre synthesis in G is either constant or dependant of Dap (red arrow).
Expected behavior
We consider initial conditions in which only G cells are present. Because both Dap and S cells are absent, the system has to go through an intialization phase in which G differentiates into S cells and S cells start producing Dap. This initialization phase is vulnerable since no cell growth is possible. Adding Dap in the environment can only have a benefic effect on the population so we choose to start this study with an initial condition lacking Dap. In summary the expected behavior for this system is that cell populations grow fast enough and have a robust initialization phase.
Modeling purpose
- Is minimal behavior robust ?
- How can we tune the system to improve its behavior ?
- Which design should we prefer ?
Modelling
Differential equations
Equations (1) and (2) takes into account cell division, differentiation and death. To model the dependence of division on Dap and differentiation on Cre for G cells we use Michaelis-Menten kinetics (terms λdiv and λdiff in equations 1 and 2 with ηDapdiv=ηCrediff=1).
Equation (3) represents the synthesis of Cre, its degradation and its dilution caused by Gcells growth. We consider two models : the synthesis rate of Cre is either constant (design 1) or inhibited by Dap (design 2) as indicated by the red term. Term λdiv in equations (3,4) accounts for the dilution of Cre and Dap when the population of G grows.
Equations involving Dap (4,5,6) represent Dap synthesis in soma bacteria, Dap degradation in bacteria and in the environment, Dap transport and the release of Dap in the environment from dying bacteria. Term λdiff in equation (6) is a corrective term to take into account the mean variation of concentration of Dap in G and S when some bacteria G differentiate into S.
Parameters
We first try to find out a set of parameter values such that the system exhibits a minimal growth and a robust initialization phase. We will then use this set of parameter values as a reference point for the robustness and optimization analysis.
Initial condition
The initial conditions correspond to a situation where only G cells are present, that is no bacteria S, no Dap and no Cre.
Kinetic Parameters
In order to set parameter values we use several different methods. First, parameters λdiv and λdeath are estimations based on experimental data. Then, we fix inequality constraints expressing on the one hand biological knowledge : Dap is actively imported into bacteria (κimp > κexp), bacteria death is lower than bacteria growth (λdeath<λdiv), degradation of DAP in the environment is lower than in bacteria where it is consumed (γDapE < γDapGS),transport of DAP is an order of magnitude faster than reactions modelling death, growth or differentiation of bacteria (κexp,κimp>> λdiv,λdeath,λdiff) and on the other hand intuitive reasoning : differentiation must be lower than bacteria growth (λdiff > λdiv).
Based on these constraints on the parameters, we defined a set of parameter values p* as a reference starting point.
Specification
We define a minimal behavior that the system must display. First, we want that the quantity of bacteria G never
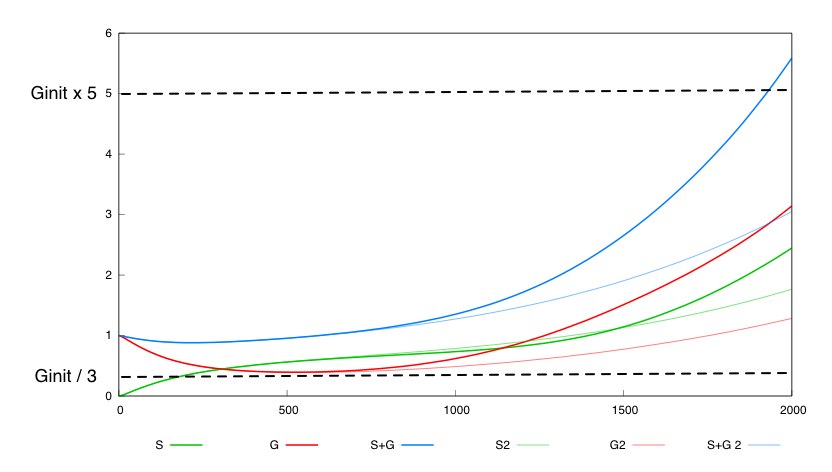
falls below threshold Ginit/3. Secondly, we want that after a certain amount of time (2000 time units), the overall population of bacteria (G+S) is above threshold Ginit*5.
For the parmaeter values p*, both systems validate this specification. The system with a synthesis rate of Cre dependent of Dap has the following behavior :
Analysis
Robustness
In order to evaluate the robustness of both models, we try to find a box in the parameter space containing p* such that for any point of this box the specification we defined is valid.
First of all, we reduce the number of relevant parameters to ease the enumeration process. Several parameters values act by pair, such has κexp/κimp determing the ratio DapE/DapGS. For each of this pairs we retained only one parameter. By using this method we extracted 9 parameters from the existing 19 parameters.
Then, to find the box we begin by searching for a box such that for any vertex of this box the system is valid, that is making 2^9 simulations and checking for everyone whether the specification is valid. Once such a box is found we sample the inner area to check if the specification is valid in the inside of the box. We sampled each parameter's interval value with 4 points. It takes about 9 hours to make simulations for 4^9 parameters.
For the system with a variable rate of synthesis of Cre the following box is valid :
| λdiff | λdiv | λdeath | κexp | θdivdap | θdiffcre | θcredap | Ginit | |
| % decrease | 20 | 1.5 | 90 | 50 | 20 | 8.6 | 30 | 10 |
| % increase | 10 | 4.6 | 10 | 100 | 10 | 100 | 15 | 1000 |
The system is very responsive to parameters λdiff, λdiv and λdeath. A combined very small change of these 3 parameters int the system is enough to invalidate the required behavior.
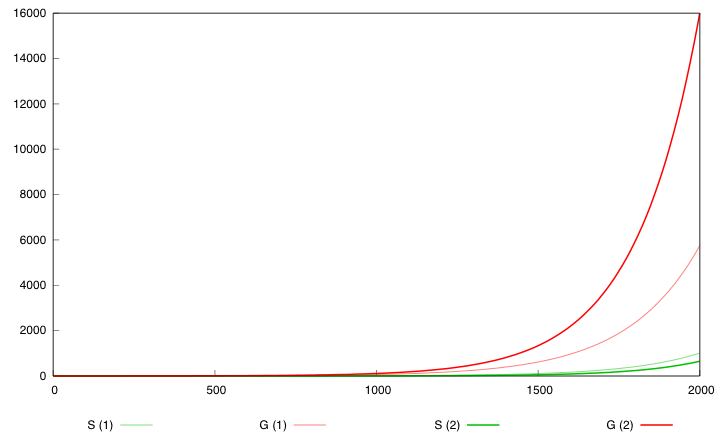
The second system with a constant synthesis rate of Cre is not valid in this whole box. 536 out of the 262000 points in this box are not valid fot this system. Here is a simulation for a given set of parameter values inside this box for which the constant rate system is not valid.
This tends to show that having a negative feedback of Cre synthesis by Dap leads to a more robust design.
Optimization
We compare the growth of the system to the growth of the wild type bacteria. After 2000 time units, the wild type bacteria attains a population of 61000 compared to 14 when parameter values are set to p*.
For that reason we try to adjust some parameter values to obtain a better growth. We only consider parameters directly corresponding to biologically adjustable properties of the system. These parameters are cre synthesis(κcre), dap synthesis(κdap), and inhibition of cre synthesis by dap (θcredap). Moreover we consider we can change these parameters at most by x100 or x0.01. our approach is to sample thi interval values for each parameter to find the optimal combined value of these parameters in this range.
The population exhibits an exponential growth of type exp(kt). In order to measure the relative growth of each set of parameters we compare value k in the exponential. The wild type has a growth k=λdiv-λdeath=0.055. For p*, the apparent growth is exponential with k=0.013. The best value for design (1) is 0.049 and is obtained for κcre=κcre* /20, κdap=κdap* *100 and θcredap=θcredap* * 4. For design 2 the best value is 0.044 and is obtained for κcre=κcre* /100, κdap=κdap**100.
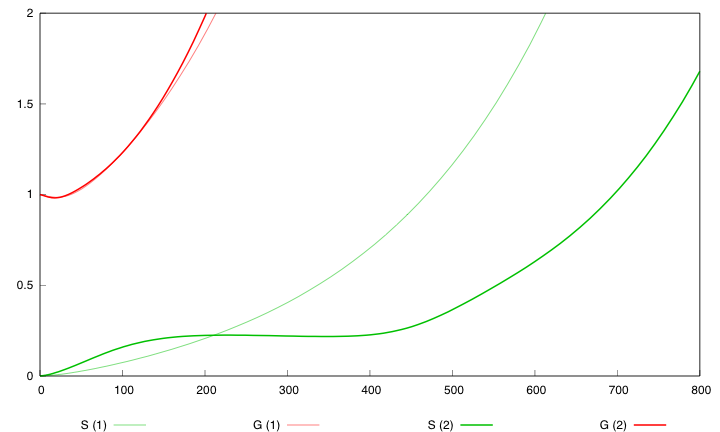
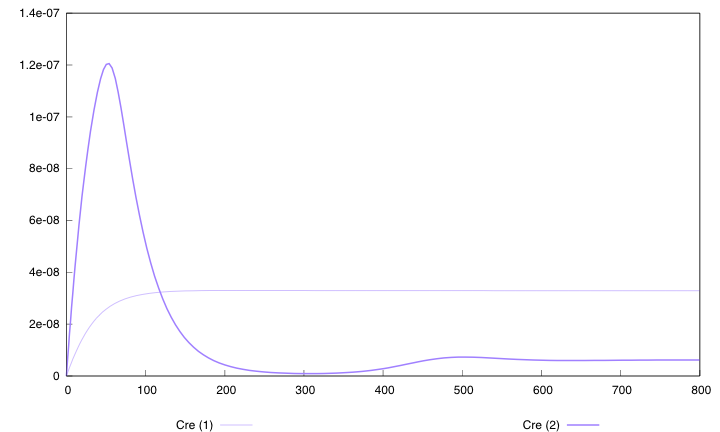
Here are the simulation obtained for these values in both designs :
First curve displays the evolution of populations G and S in 200 time units, the second one the evolution of G and S in 800 time units while the third one shows off Cre concentration in 800 time units.
First, we notice that the regulated system has a better start : high Cre concentration leads to a rapid increase in S cells and thus to higher dap amounts and a better growth of G cells. After intialisation phase is over the regulated system is still better : inhibition of Cre synthesis allows a lower Cre concentration, a lower differentiation rate that is a higher G/S ratio and a better growth.
Summary
These results tend to indicate that the model with negative feedback loop on Cre synthesis presents an increased robustness.
In order to have a system with a population growth rate similar to the growth of the wild type, S cells have to produce a lot of Dap and differentiation of G cells has to be low so that ratio S/G << 1. Optimization anlysis shows that it is easier to achieve this with the regulated system. Inhibition of Cre synthesis by Dap indeed allows to have a very low overall differentiation in the growth phase and still have a fast initialization phase thanks to the initial burst of Cre caused by the lack of Dap in the initial condition.

