Tianjin/DIODE/Experiment2

From 2007.igem.org

(Difference between revisions)
(Introduction)
(Introduction)
Line 1: Line 1:
{|
{|
==Introduction==
==Introduction==
-
We desgined a equipment to test these immobilized cells.We test them in different sequences and different time.We get the following results to prove our design and model.The last figure show the right result of our project.
+
We desgined a equipment to test these immobilized cells.We test them in different sequences and different time.We get the following results to prove our design and model.The last figure show the right result of our project.We get it right only once just before the dead line and more test is needed.
==Equipment ==
==Equipment ==

Revision as of 12:52, 26 October 2007

Introduction

We desgined a equipment to test these immobilized cells.We test them in different sequences and different time.We get the following results to prove our design and model.The last figure show the right result of our project.We get it right only once just before the dead line and more test is needed.

Equipment

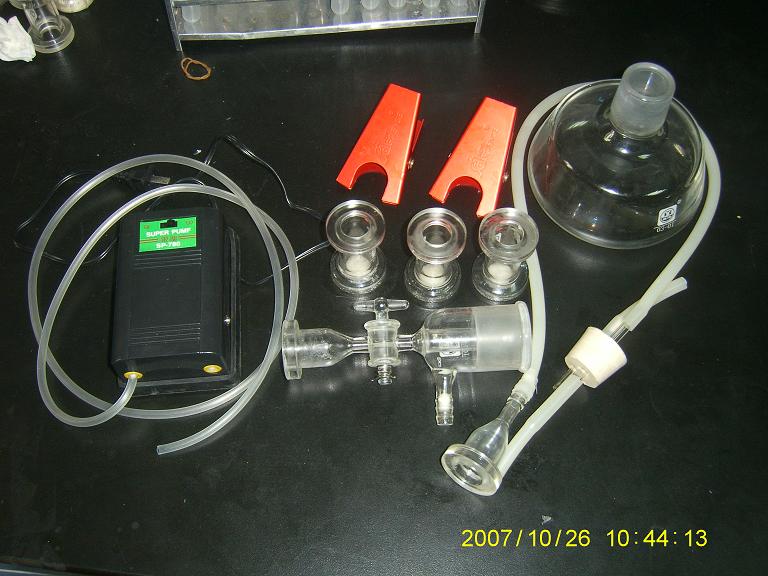
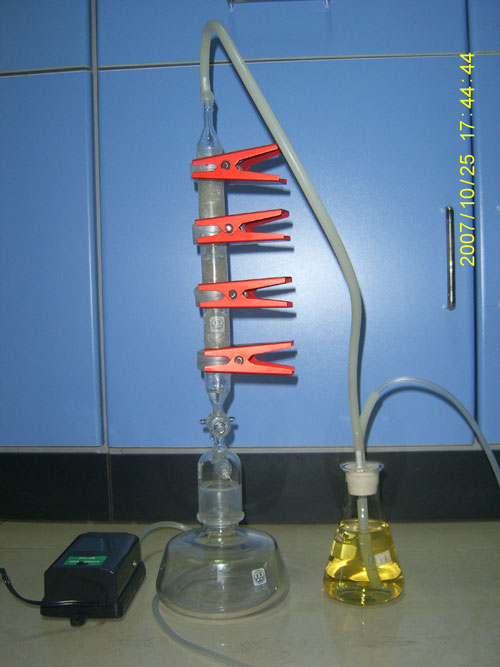
In order to imitate the actual diode and for fun, we construct an equipment by using the principles of chemical engineering. This 'diode' mainly consists of three consecutive hollow columns fulfilled with immobilized beads, at the boundries of two of which is a ground glass surface permitting the flow of culture but not the immobilized beads. The top column is connected with a flask containing liquid culture(usually LB)by a hosepipe and the bottom column is tied to a valve which could control the rate of flux. The liquid culture is driven by a pump to pass through the three consecutive columns and under the condition of positive-biased, the AHL produced by the generater cells are brought to the second column filled with amplifier cells and then the third column filled with block cells. Under the condition of negative-culture the positions fo amplifier cells and block cells are reversed. The solution passing through the third column is collected by a small container which is used for further analysis of AHL contents.

TJUcolumn.jpg
TJUcolumn1.jpg

Test Result

The datas of fluorescence intensity are derived from the mixture of detector cells with samples extracted from the culture of different cells. The specific method is as shown here.

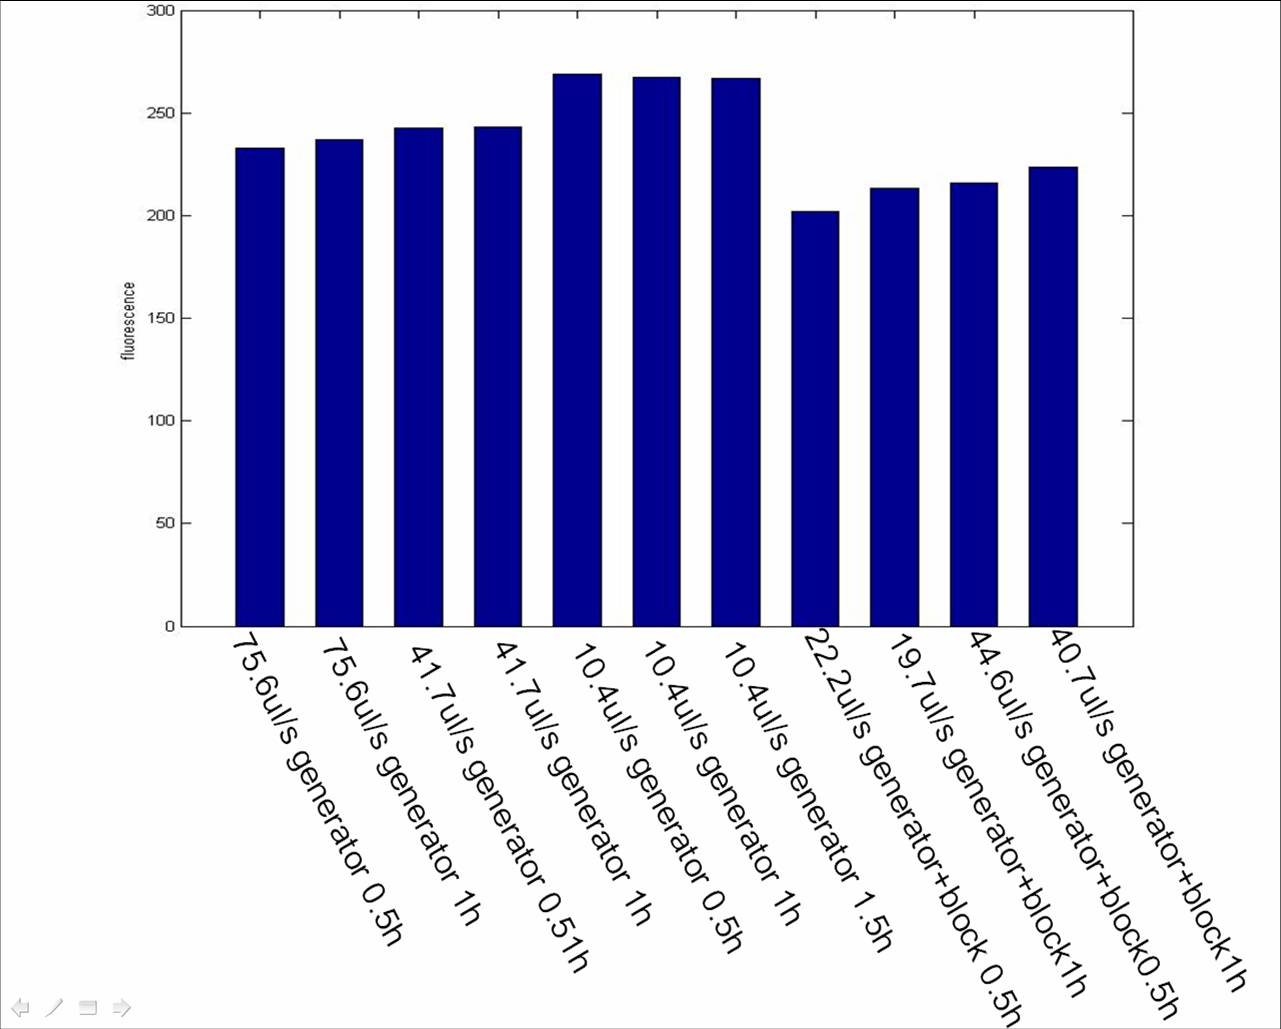
Figure 1: We test the equipment fulfulling with the generator cell and the block cell at different flux rate and different time after the alteration of flux rate.The result shows that the output concentration of AHL will decrease with the increase of the flux rates and the block cells could degradate the AHL produced by the generator cell,but the value is still a little higher than what we expected.
Tjuex301.jpg


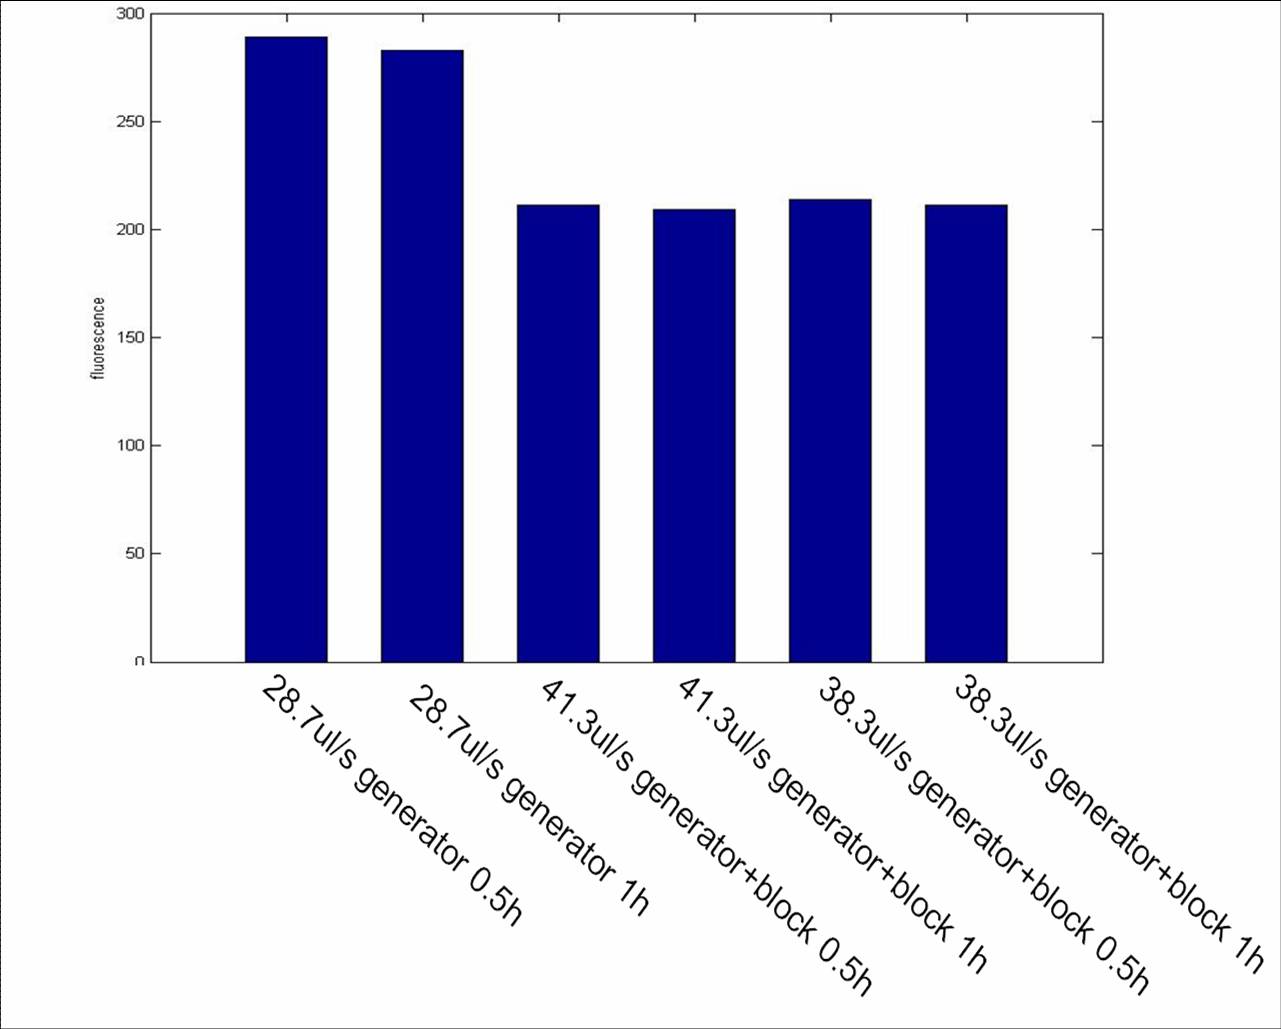
Figure 2:We put in more block cells than that in figure 1,that is 1ml immobilized generator cells and 4ml immobilized block cells .The result shows that the block cells also work but not as good as we want.
Tjuex302.jpg


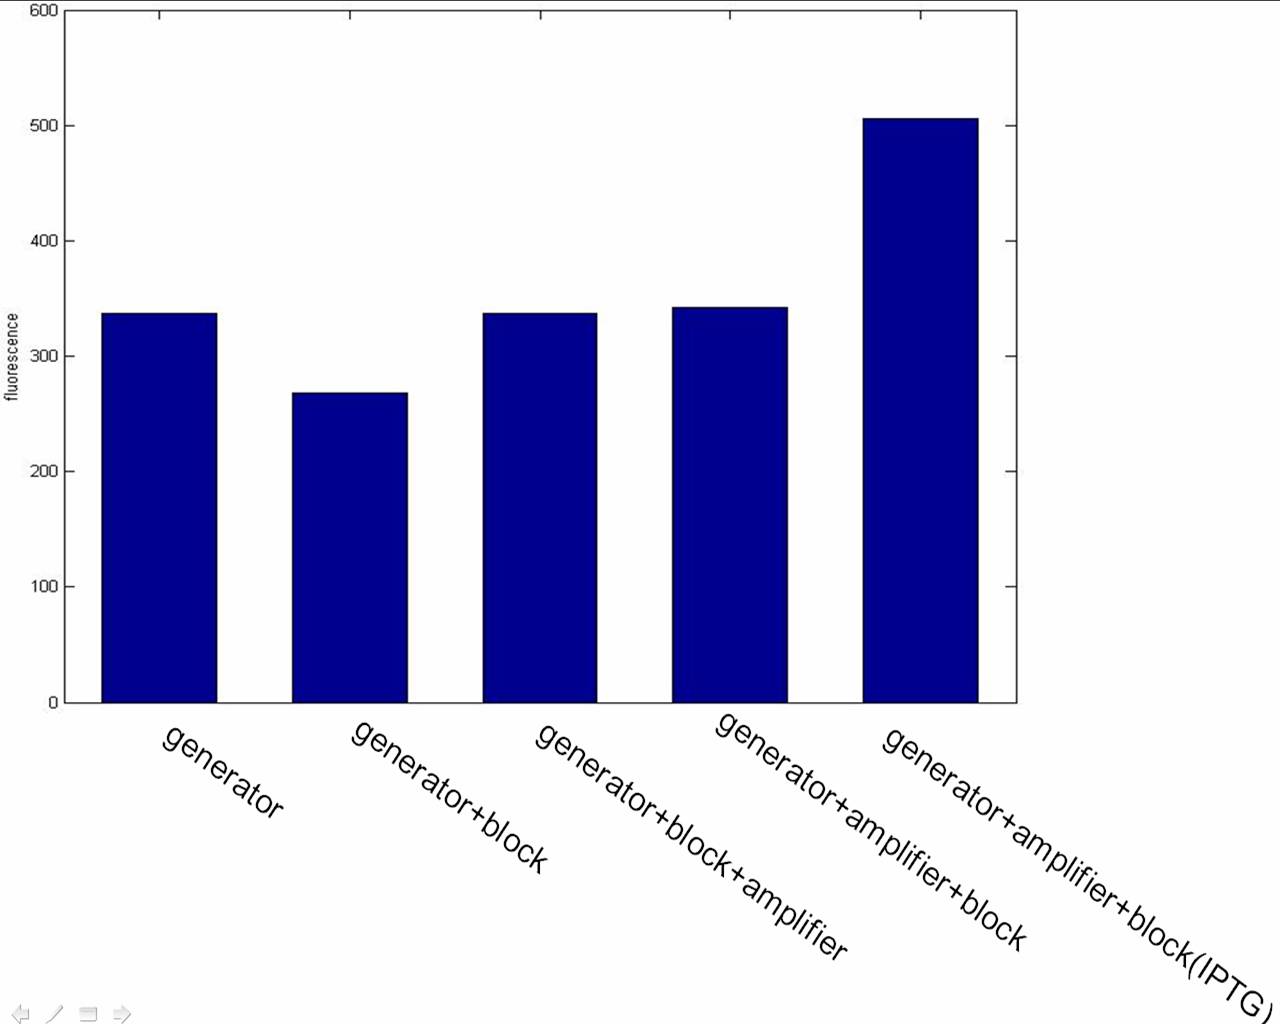
Figure 3:We test the postive-biased and the negative-biased condition of the system .The result shows that the block cell successfully reduces the concentration of AHL.We can observe that the fluorescence value of postive-biased and negative-biased condition are almost the same which reveals that the amplifier cells are working at both condition .When we add IPTG,the fluorescence of postive-biased will reach a high value as we expected.
Tjuex303.jpg


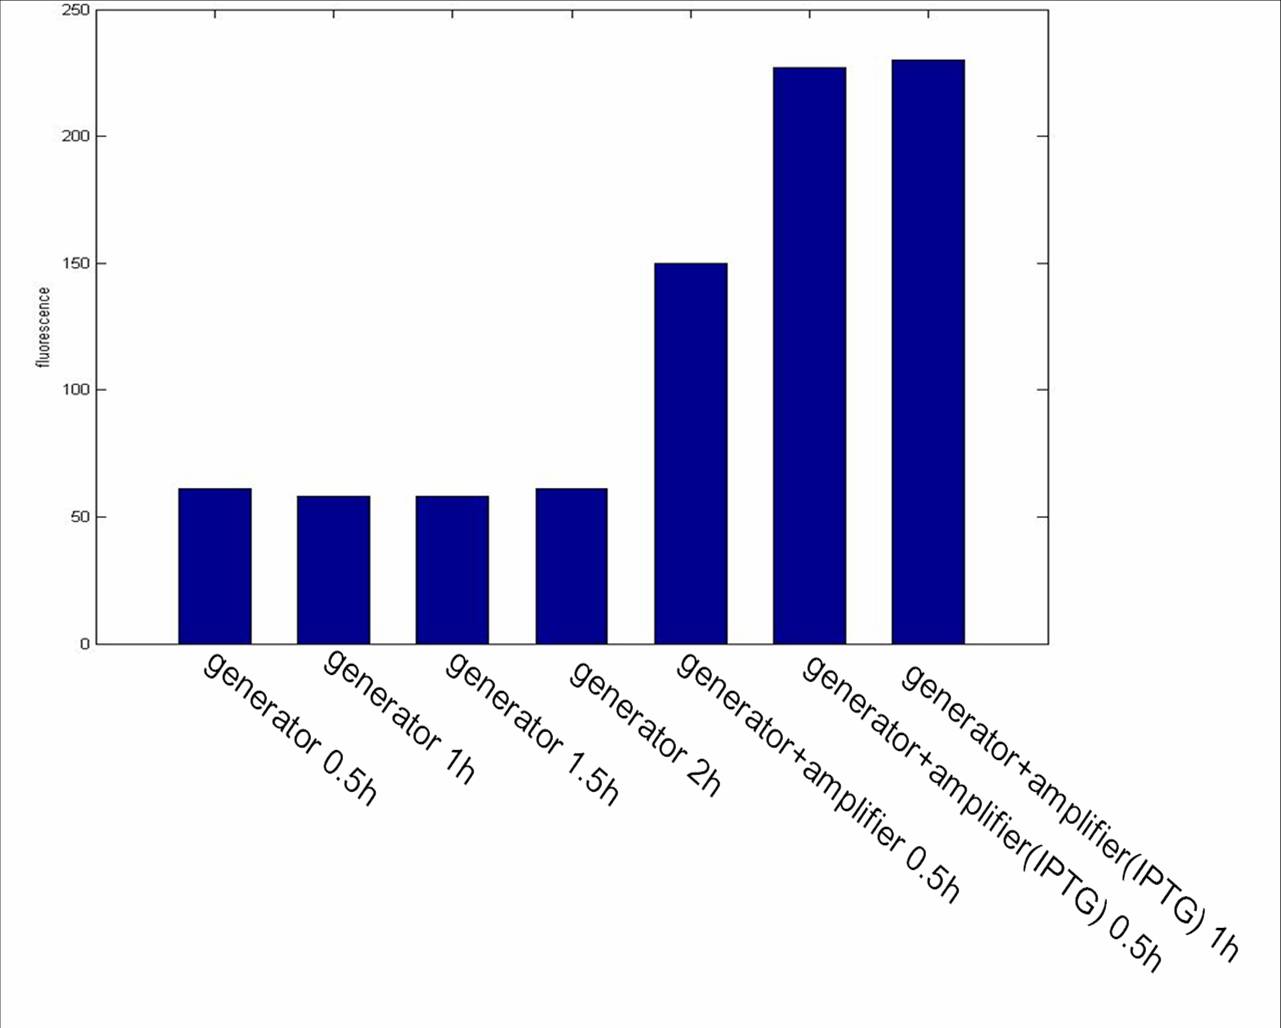
Figure 4:We test generator cells together with the amplifier cells at flux rate of 55.6ul/s .The result shows that the concentration of AHL become higher when amplifier cells together with IPTG were added.
Tjuex304.jpg


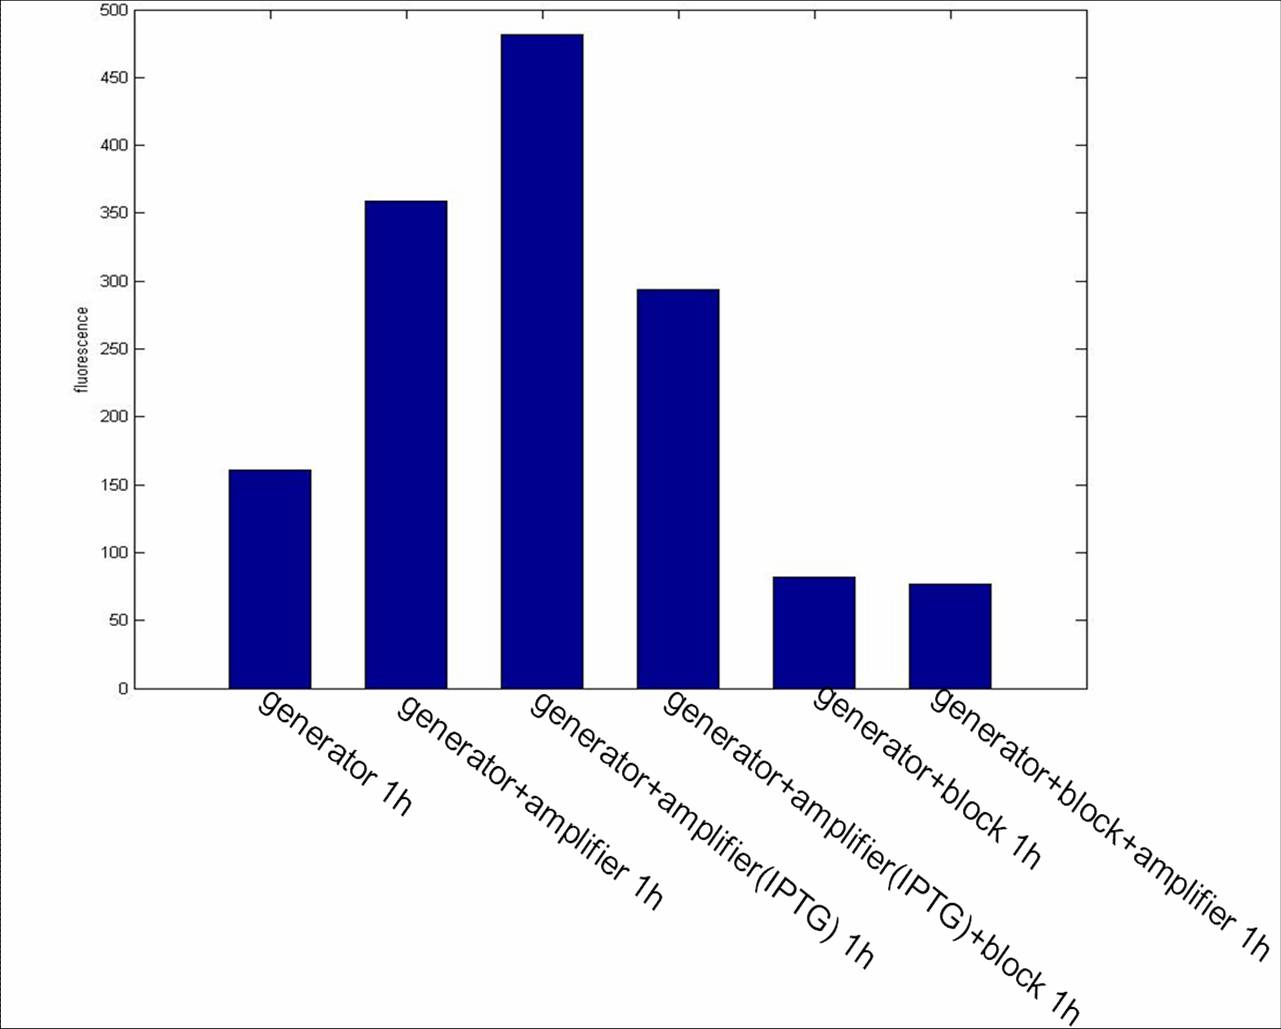
Figure 5:This figure shows the right behavior of the diode .The fluorescence value of the postive-biased is 294.0055 a.u. while the negative-biased is 76.3918 a.u..
Tjuex305.jpg