Bologna University/Protocol validation measures
From 2007.igem.org
(Difference between revisions)
Guido Costa (Talk | contribs) |
Guido Costa (Talk | contribs) |
||
| Line 24: | Line 24: | ||
| - | + | Complete data set is in figure below. | |
| + | |||
| + | [[Image:sito.jpg]] | ||
As we expected, the two mean values are close to each other, being the different spots from the same solution. | As we expected, the two mean values are close to each other, being the different spots from the same solution. | ||
Revision as of 16:17, 26 October 2007
We use bacteria with [http://partsregistry.org/Part:BBa_I763004 I763004] plasmid, since we know all of them beam fluorescence also when not inducted; we check that the OD value is 1.2. We then execute two different observations:
- ten different spots within the same slide (test A);
- five slides, and two spots each (10 total spots, test B).
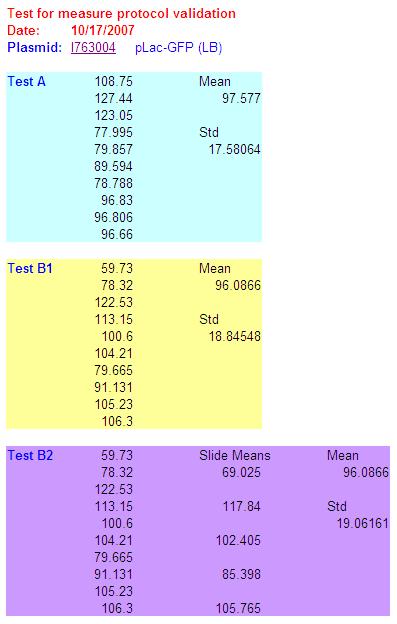
For every spot, we take a picture and we elaborate it using the algorithm above, obtaining as output a normalized intensity value. Finally, for each of the two sets of values, we calculate mean and standard deviation; for the B test, we calculate both values either on the 10 intensities indistinctly (B1) and on the five slide means (B2). Here are the results:
| Results | |
|
|
Complete data set is in figure below.
As we expected, the two mean values are close to each other, being the different spots from the same solution.
