Berkeley LBL/Results/ProteinGel
From 2007.igem.org
(Difference between revisions)
KonniamChan (Talk | contribs) (→Discussion) |
KonniamChan (Talk | contribs) (→'''Discussion''') |
||
| Line 28: | Line 28: | ||
''*We expected to see protein bands for the constructs that contained:'' | ''*We expected to see protein bands for the constructs that contained:'' | ||
| - | 1. -H gene (~140kDa)that were induced with IPTG | + | * 1. -H gene (~140kDa)that were induced with IPTG |
| - | 2. -I gene(~38kDa) that were induced with IPTG | + | * 2. -I gene(~38kDa) that were induced with IPTG |
''*We did not expect to see bands that coded for:'' | ''*We did not expect to see bands that coded for:'' | ||
| Line 38: | Line 38: | ||
2. - All constructs that were not induced with IPTG | 2. - All constructs that were not induced with IPTG | ||
| - | * Although the induced constructs that contained the -H gene had strong bands at ~140kDa, the uninduced constructs also showed strong bands in the same area. The -H gene was able to be expressed with or without induction of IPTG. | + | *Although the induced constructs that contained the -H gene had strong bands at ~140kDa, the uninduced constructs also showed strong bands in the same area. The -H gene was able to be expressed with or without induction of IPTG. |
| - | * In addition, protein bands that coded for the -I gene showed a strong band, when alone. | + | *In addition, protein bands that coded for the -I gene showed a strong band, when alone. |
| - | * However, when the -I gene was expressed with the -H gene, it did not clearly show a strong band at ~38 kDa in comparison to the benchmark ladder. | + | *However, when the -I gene was expressed with the -H gene, it did not clearly show a strong band at ~38 kDa in comparison to the benchmark ladder. |
| - | * As expected, protein bands for the -D gene also did not show, alone nor in conjunction with the -H and -I gene. | + | *As expected, protein bands for the -D gene also did not show, alone nor in conjunction with the -H and -I gene. |
| + | '' | ||
| + | '''Conclusion:''''' | ||
'''* Although our protein gels did not convey expression of neither the -I nor -D genes, our genes may still be expressed and may have enough activity to catalyze the Mg-chelatase enzyme to produce Mg-protoporphyrin IX.''' | '''* Although our protein gels did not convey expression of neither the -I nor -D genes, our genes may still be expressed and may have enough activity to catalyze the Mg-chelatase enzyme to produce Mg-protoporphyrin IX.''' | ||
Revision as of 03:20, 27 October 2007
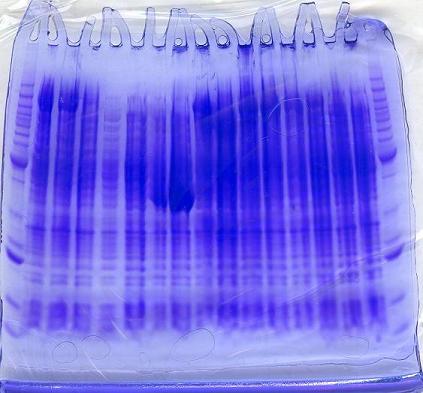
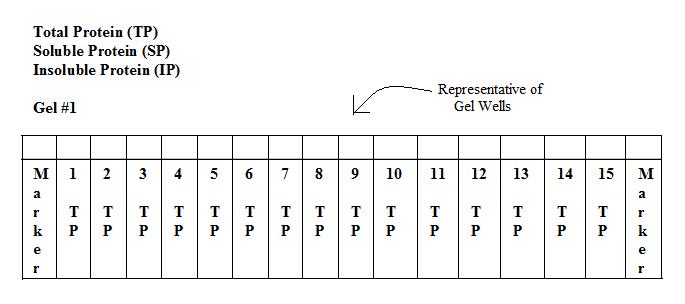
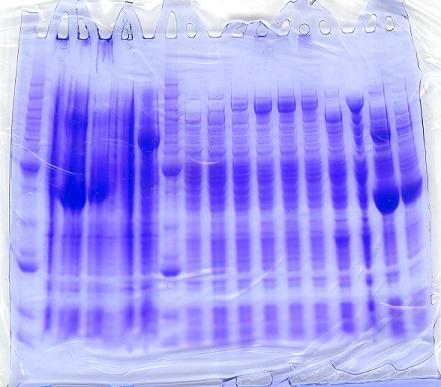
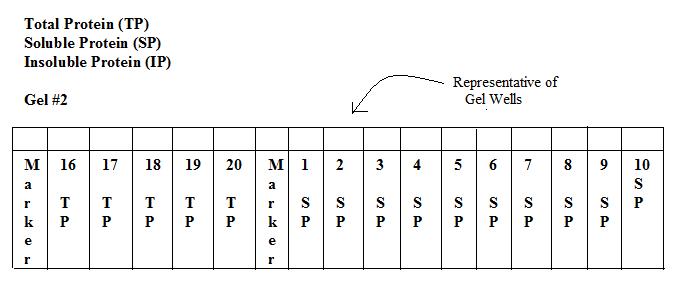
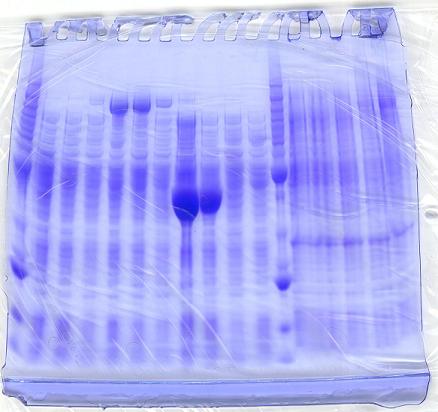
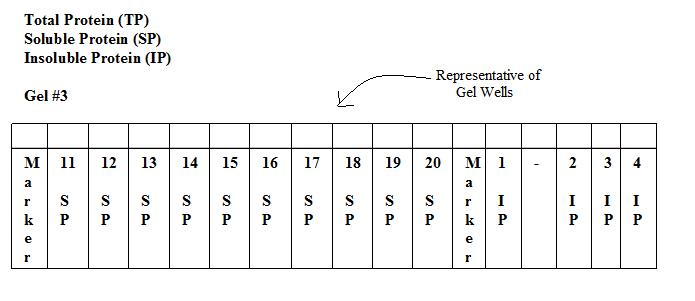
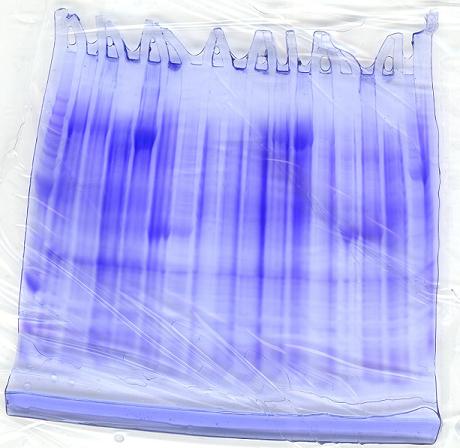
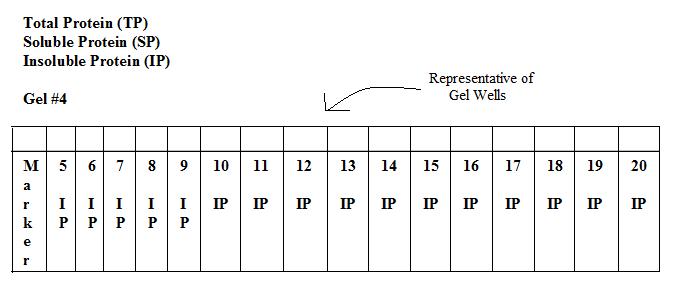
Results of SDS-PAGE Gel of Soluble Proteins
Invitrogen BenchMark Protein Ladder
Discussion
Prior to running the protein gels:
*We expected to see protein bands for the constructs that contained:
- 1. -H gene (~140kDa)that were induced with IPTG
- 2. -I gene(~38kDa) that were induced with IPTG
*We did not expect to see bands that coded for:
1. -D gene (~70kDa)
2. - All constructs that were not induced with IPTG
- Although the induced constructs that contained the -H gene had strong bands at ~140kDa, the uninduced constructs also showed strong bands in the same area. The -H gene was able to be expressed with or without induction of IPTG.
- In addition, protein bands that coded for the -I gene showed a strong band, when alone.
- However, when the -I gene was expressed with the -H gene, it did not clearly show a strong band at ~38 kDa in comparison to the benchmark ladder.
- As expected, protein bands for the -D gene also did not show, alone nor in conjunction with the -H and -I gene.
Conclusion:
* Although our protein gels did not convey expression of neither the -I nor -D genes, our genes may still be expressed and may have enough activity to catalyze the Mg-chelatase enzyme to produce Mg-protoporphyrin IX.
