June 25
From 2007.igem.org
(→Discussions) |
(→Discussions) |
||
| Line 60: | Line 60: | ||
Guests from National Institute of Advanced Sciences (NIAS) turned up at around 11:30 am. Today Vini presented a brief introduction of the experimental techniques we use while Varun and Shashank explained the methods of analysis of data obtained from some initial trial experiments and what the graphs and plots meant. | Guests from National Institute of Advanced Sciences (NIAS) turned up at around 11:30 am. Today Vini presented a brief introduction of the experimental techniques we use while Varun and Shashank explained the methods of analysis of data obtained from some initial trial experiments and what the graphs and plots meant. | ||
| - | A powerpoint presentation introducing our experiments can be obtained from this link. [[ Click here.]] | + | A powerpoint presentation introducing our experiments can be obtained from this link. [[vini.pdf|Click here.]] |
The analysis of some previous data can be obtained in the Analysis section of the e-notebook | The analysis of some previous data can be obtained in the Analysis section of the e-notebook | ||
Revision as of 06:36, 4 July 2007
Back to Bangalore
Back to e-Notebook
Contents |
Experiments
Microscopy
- pL.CFP imaging done at various IPTG concentrations after 12 hours
- K12Z1 imaging done at 0 IPTG concentration
- pL.YFP imaging done at 50 & 1000 IPTG concentrations after 12 hours
Analysis
Microscopy
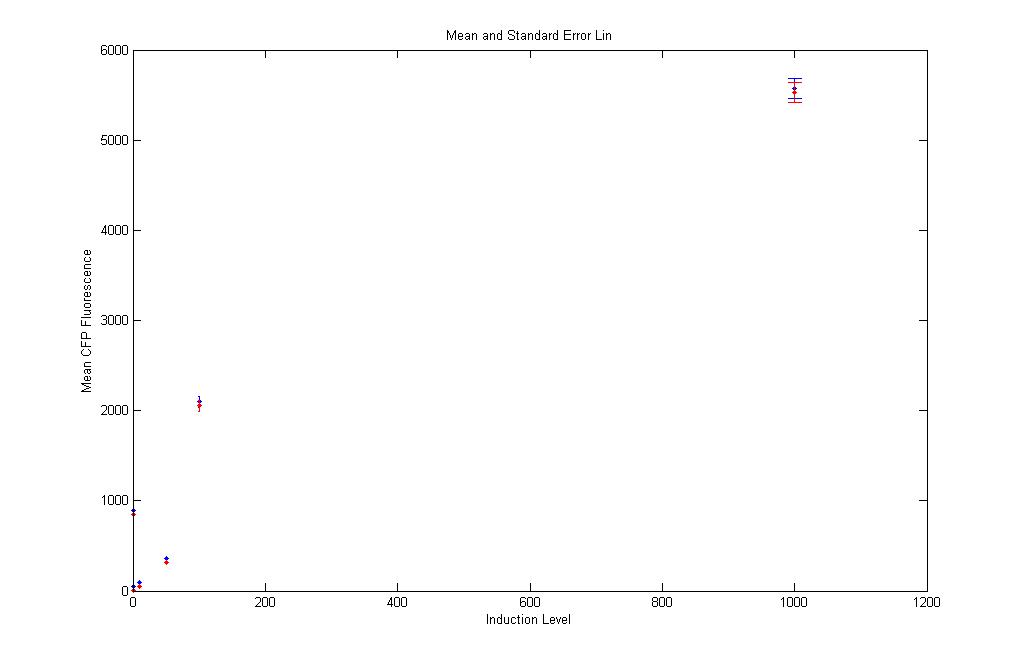
Mean and Standard Error Plots at all induction levels:
- pL.CFP: Subtract K12Z1 and plot Mean CFP vs IPTG concentration
- Blue : Mean pL.CFP Fluorescence values at different ITPG concentrations
- Red : Mean pL.CFP - K12Z1 Fluorescence values at different ITPG concentrations
Linear space
|
Also, the Blue and Red points almost form a sigmoid, except for the value at 1 IPTG(???). Yippie, something we expected. |
Scatter Plots:
- The Scatter plots show CFP values of each cell against their corresponding YFP values. Each dot represents a cell.
- CYAN : K12Z1 Fluorescence values at no ITPG concentration
- Blue : pL.CFP values at each ITPG concentrations
|
The K12Z1 dot (cyan) show the control experiment performed. The blue dots, due to pL.CFP, show expected rise in CFP fluorescence with increase in IPTG, except for some strange thing happening at 1 IPTG(???). |
Inference
The sigmoid nature of the mean pLac cfp curve is expected with increasing concentrations of IPTG. Every promoter has some basal and maximal expression level.The steepness of the sigmoid curve is described by the Hill coefficient which defines the number of molecules of the inducer(which in this case is IPTG) that bind to a molecule of the lac repressor in order to completely inactivate it.
Furthermore, CFP expression at 1 uM IPTG induction is higher than expected. This may be attributed to the noise in the system.
Discussions
Another Monday
Guests from National Institute of Advanced Sciences (NIAS) turned up at around 11:30 am. Today Vini presented a brief introduction of the experimental techniques we use while Varun and Shashank explained the methods of analysis of data obtained from some initial trial experiments and what the graphs and plots meant.
A powerpoint presentation introducing our experiments can be obtained from this link. Click here.
The analysis of some previous data can be obtained in the Analysis section of the e-notebook

