Design
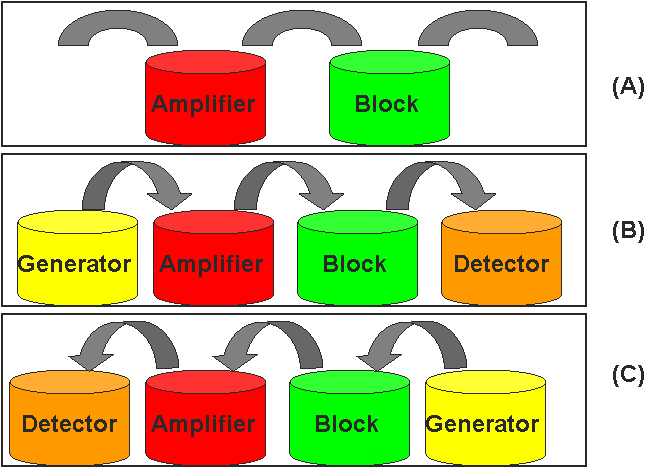
Bio-diode: The diode, one of the most significant parts in the electric integrate circuit and electronic equipment, functions as allowing the current get through when the diode is positive-biased, and cut off while it is negative-biased. When the negative voltage increases to a threshold, the diode tends to be negatively broken down. In this project, the molecular signal AHL is considered as the current of electric circuit, the generator, amplifiers, blocks and detector cells are constructed with the parts provided by MIT and then are equipped in series in order to achieve the cellular and molecular biological diode.
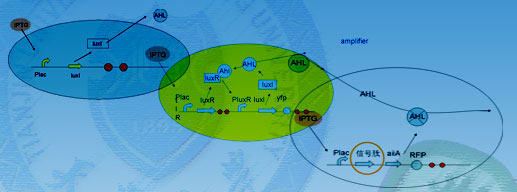
Generator: Generator cells could produce AHL signal constantly which could be sensed by special gene sequence to activate particular function. In our experiment, the production of AHL is controlled by LuxI promoter and could be promoted by the addition of IPTG and the function of Generator could be verified by the detector cells.
Reporter cell: this cell is designed to test the concentration of AHL signal. In this cell, LuxR gene under the control of tet promoter could produce LuxR protein which could activite the following Lux pR promoter when binding to certain amount of AHL signal, thus GFP expressed to make this cell green within the view of a fluoresence microscope. The intensity of fluoresence could be measured by a fluoresence spectrophometer to decide the concentration of AHL signal roughly.
Amplifier cells: Also containing a LuxR protein producer together with an AHL producer controlled by a Lux pR promoter, the amplifier cells could generate more AHL signal when it combines with the environmental AHL signal.
Block cells: Block cells contain a gene coding for a special enzyme digesting the AHL signal. The concentration of AHL signals in liquid culture could dramatically decrease after passing through the block cell congeries.
Mechanism: The three types of cells, generator cell、amplifier cells and block cells are immobilized into small beads with a diameter of 0.5 millimeter, then different beads are settled into particular parts of our specially designed equipment sequentially and respectively. Firstly, the liquid culture flow through the generator cells and carry the AHL signal into the amplifier cells which are activated to make more AHL signals. Finally, the concentration of AHL accumulates to such a level that block cells could not eliminate them completely, and the rest could be detected by reporter cells, a condition called ‘pass’ On the contrary, if the positions of amplifier cells and block cells in the equipment are reversed, the AHL produced by generator cell would be degraded by block cells at the very beginning resulting in no amplification of the signal, thus, hardly AHL could be detected in the outflow culture, a condition called ‘block’. By this way, we successfully simulate the two most important features of diode and our project could be connected with other devices to construct more complex circuit system in the future.
|
Model
Figure 1: the production of AHL could be accelerated both by the addition of IPTG and increasement if living cells.
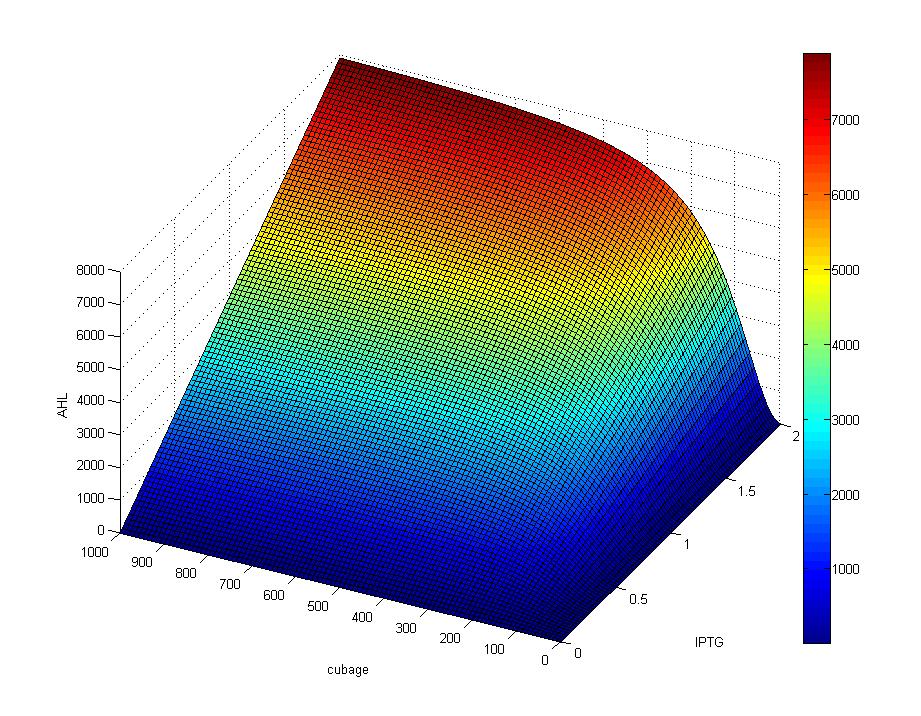
Figure 2: the concentration of AHL decreases nearly proportionally to the flux rate of liquid culture since the rate of AHL production maintains stable.
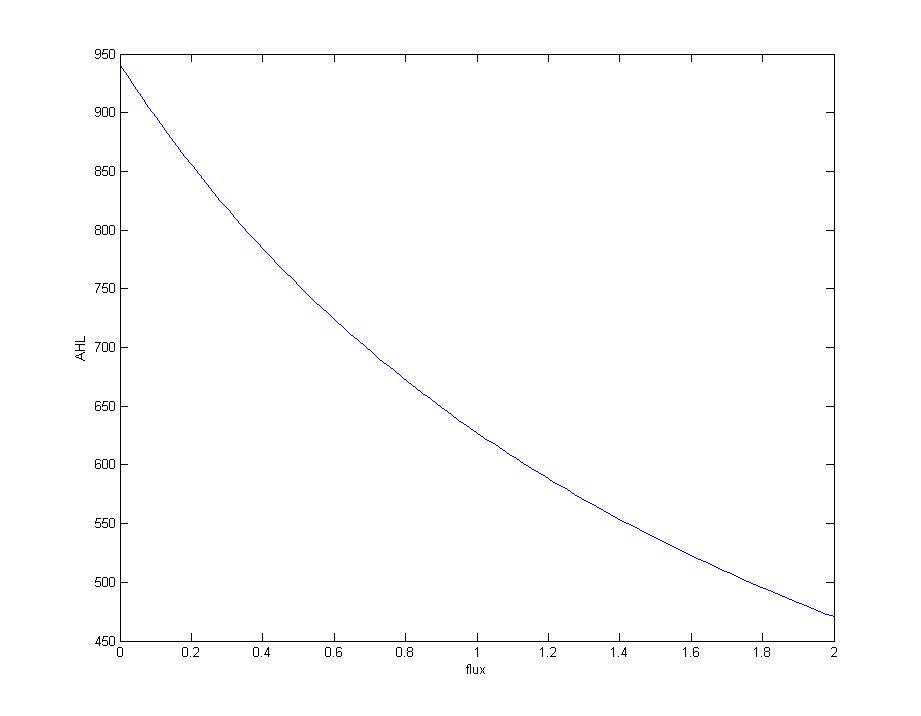
Figure 3: concentration of AHL increases expotentially during the first 40 minutes after the input of liquid culture, but keep constant from then on.
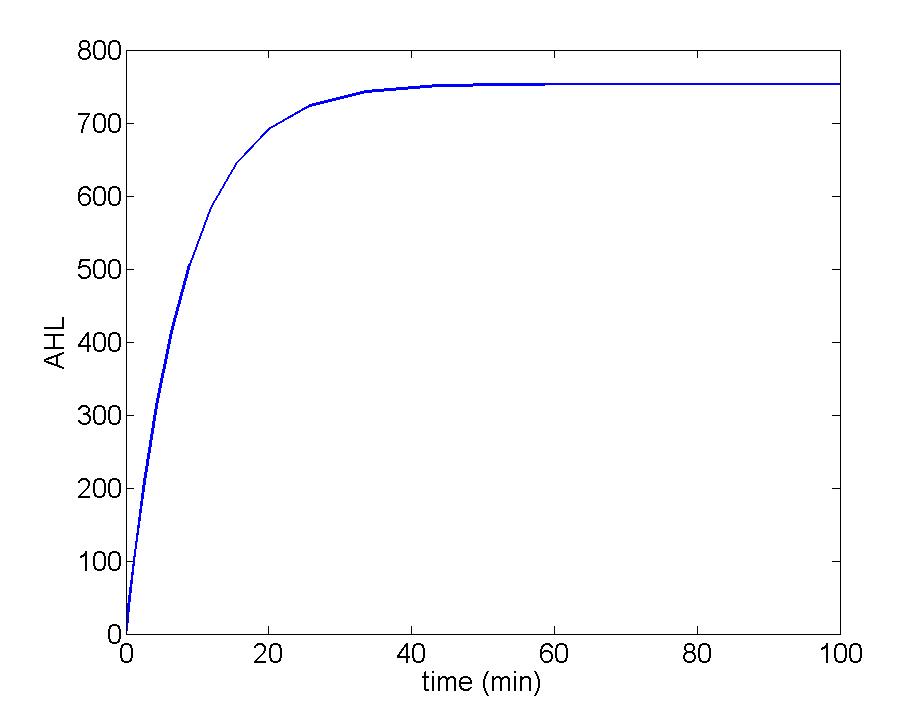
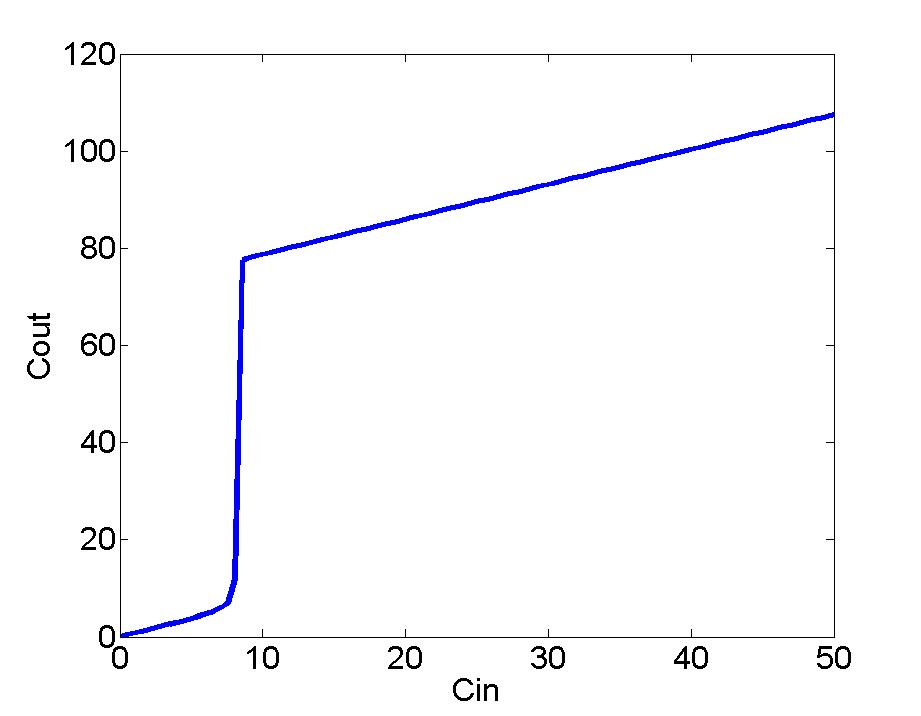
Figure 4: Rough description of relationship between the input of AHL signal and the output of AHL signal when the flux passes through the amplified cells. Low concentration input failed to initialize the amplication process.
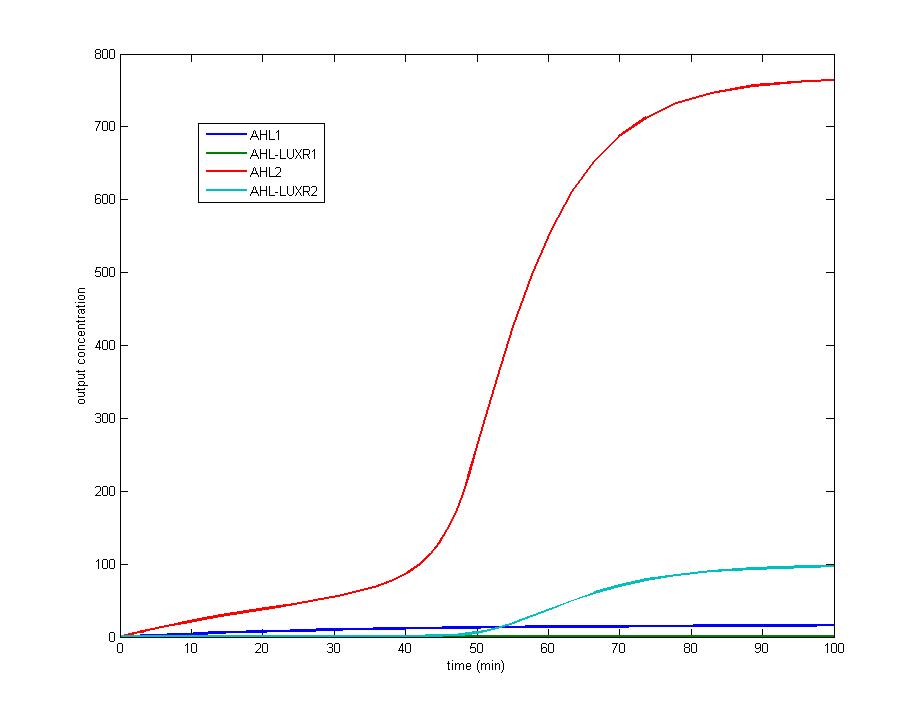
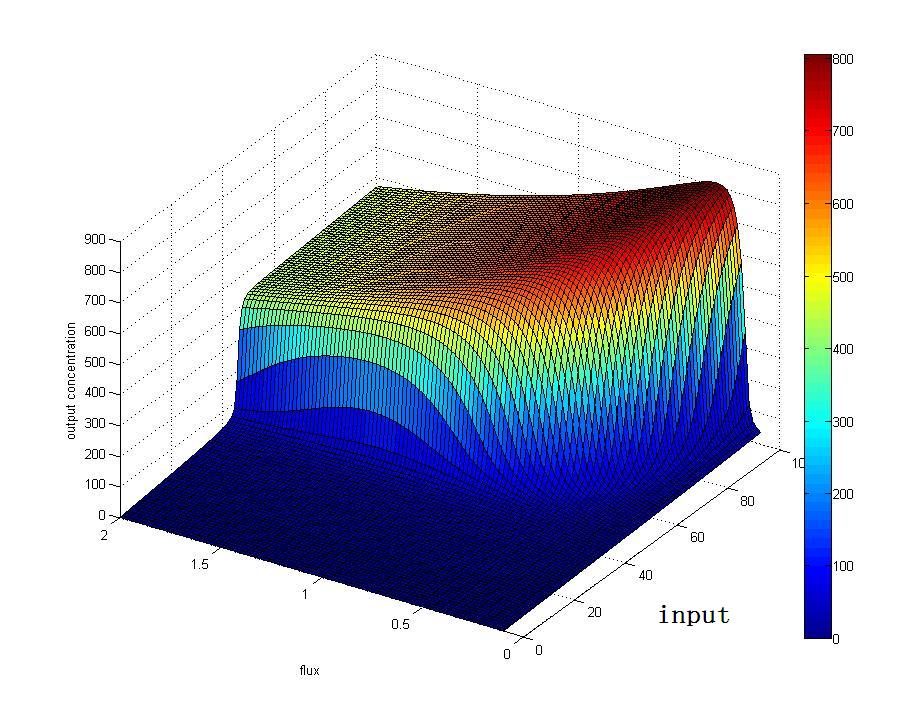
Figure 5: With the rising of flux and input signal, the output signal tend to rocketrise at a particular value,which indicates the value of threshold.
Experiment
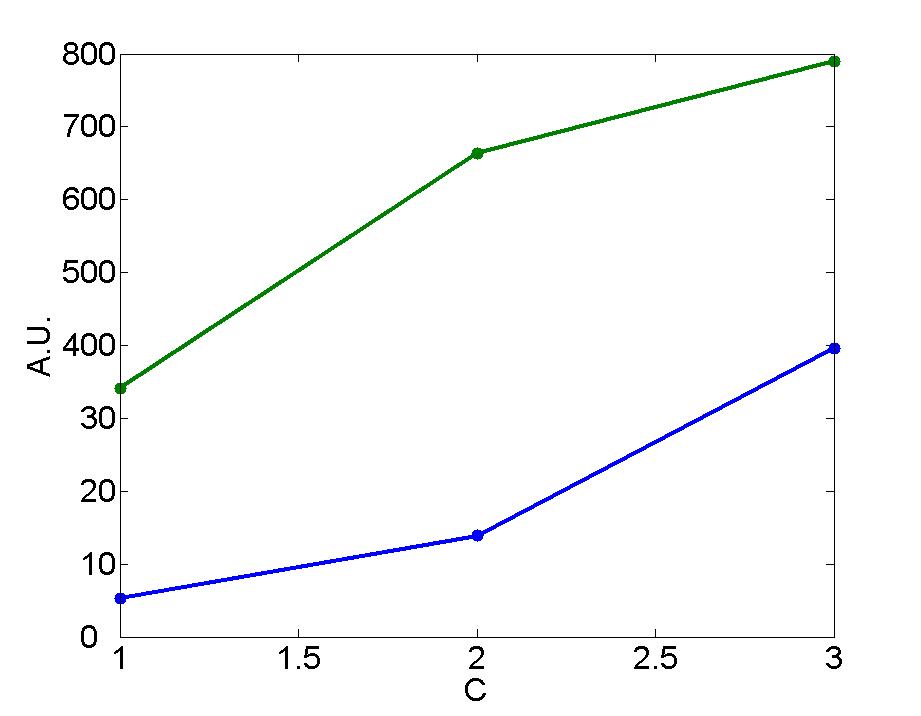
1.RFP fluorescence of the decter at different cell cencertration
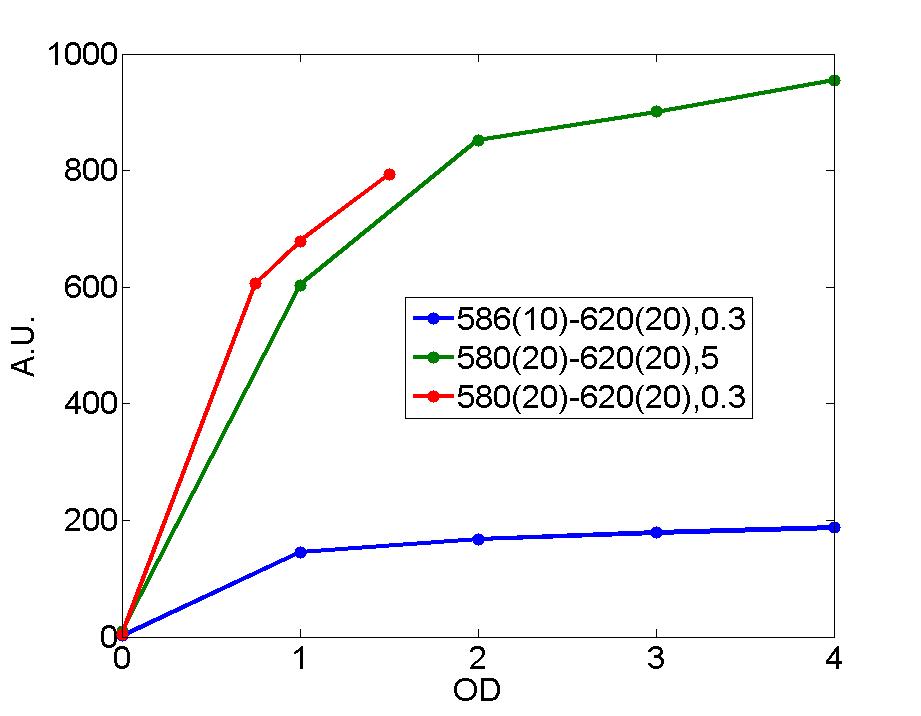
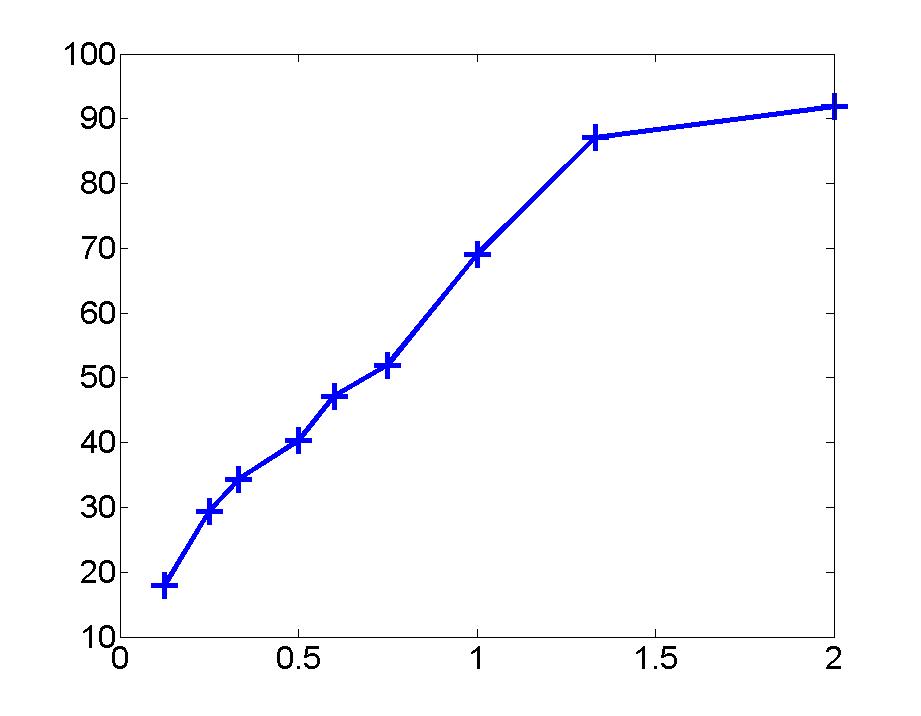
2.GFP fluorescence of the decter at different cell cencertration
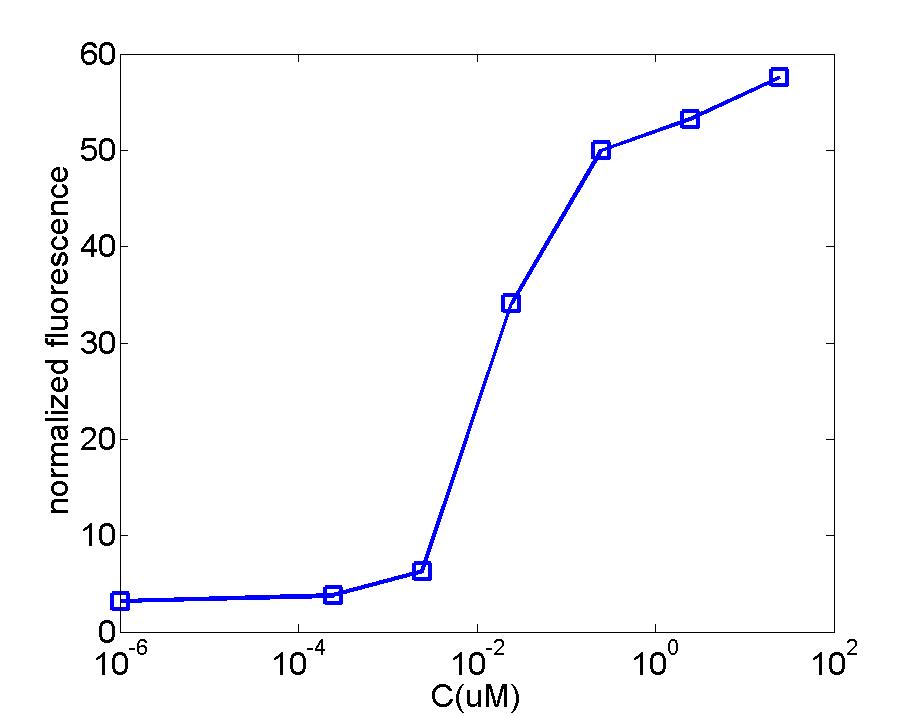
3.GFP fluorescence of the decter at different cencertration of AHL
|
Modeling
We use ODEs to simulate the system. Datas used in the model are based on the literature and would be adjusted to match the experimental results.In the model we assume that the flux through each pipeline is identical and the block maintains a stable state.
The simulation result is as follows:
Amplifier
1.relation between the input concentration of the amplifier and the output concentration of the amplifier
2.relation between the flux of the amplifier and the output concentration of the amplifier
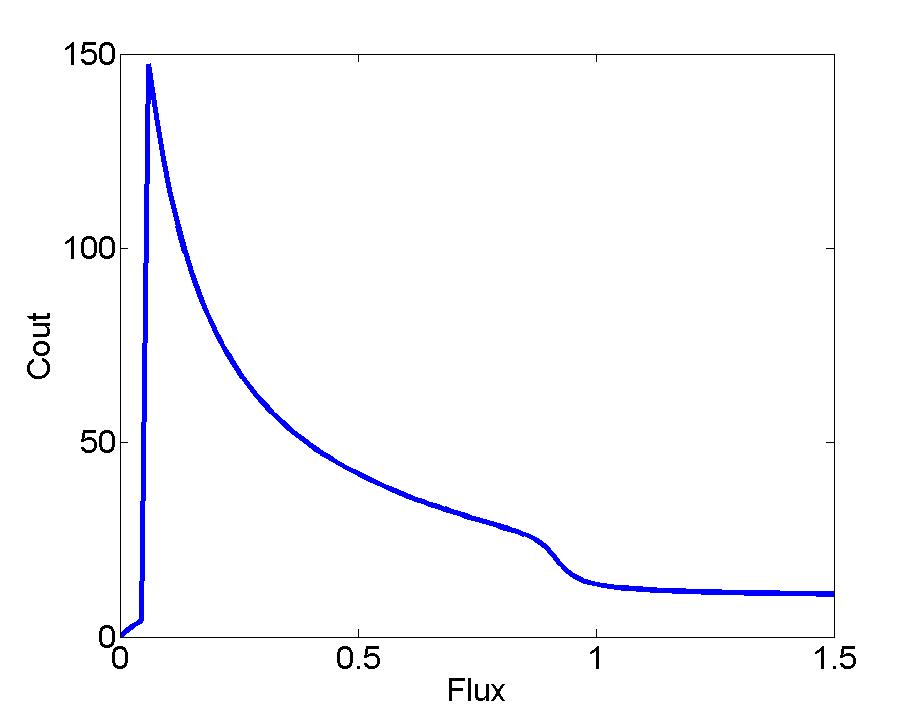
Block
1.relation between the input concentration of the block and the output concentration of the block
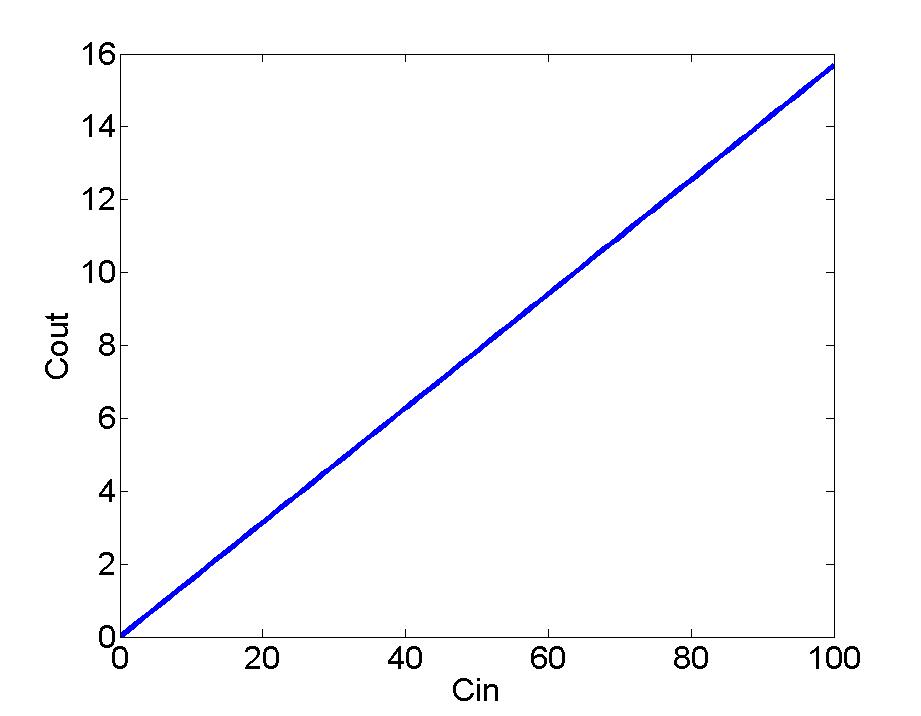
2.relation between the flux of the block and the output concentration of the block
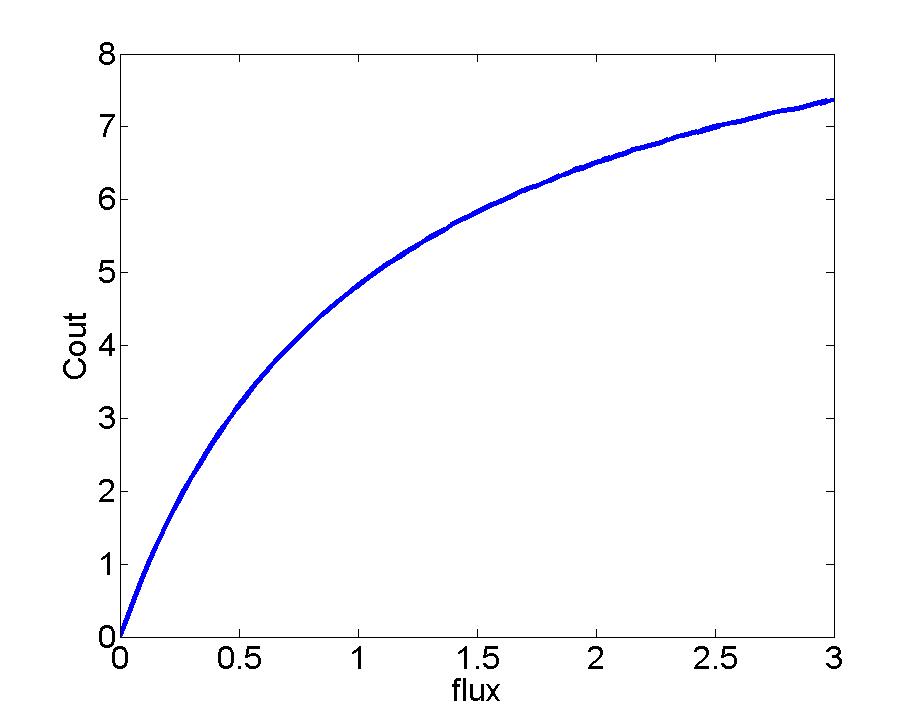
3.relation between the concentration of AIIA in the block and the output concentration of the block
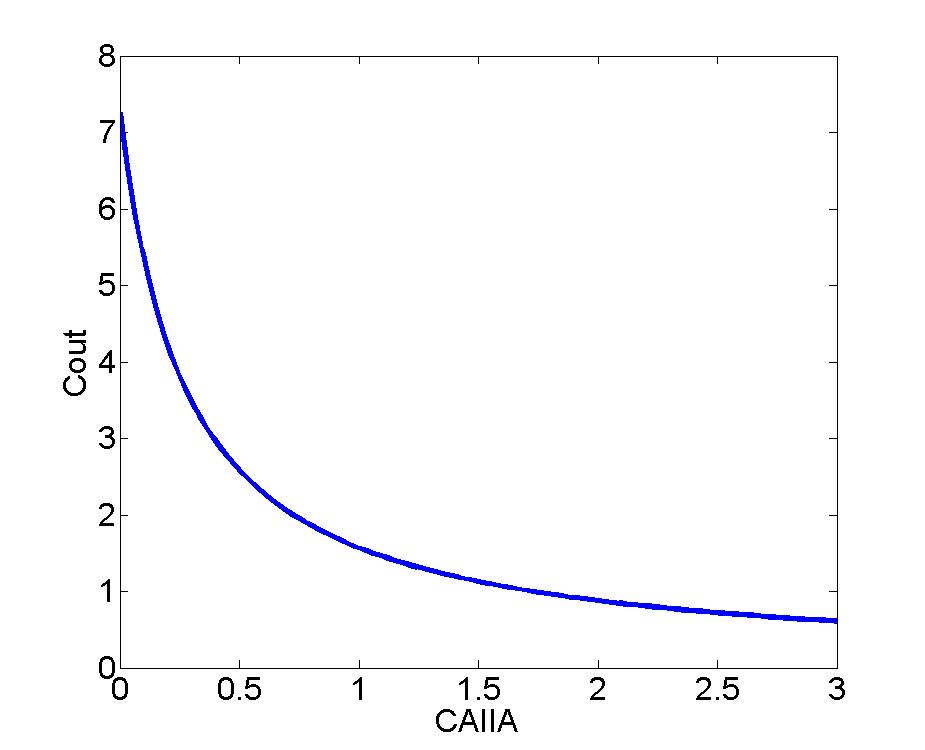
4.relation between the flux of the block and the output concentration of the block in different concentration of AIIA
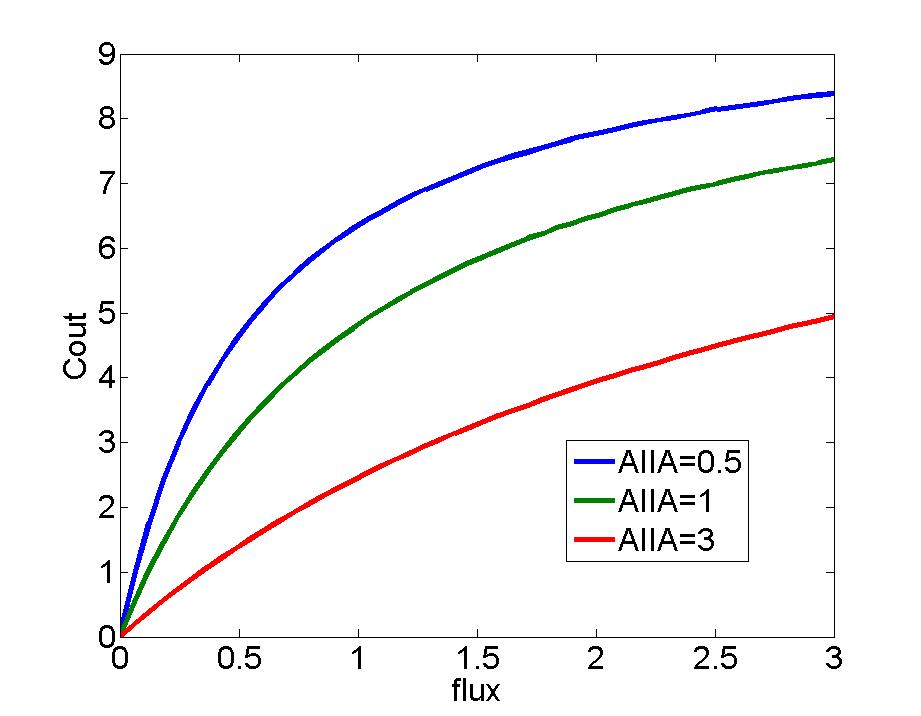
Flow direction from amplifier to block
1.relation between the concentration and the flux at different proportion between the volume of the ampilier and the volume of the block.(the left image is a part of the left image)
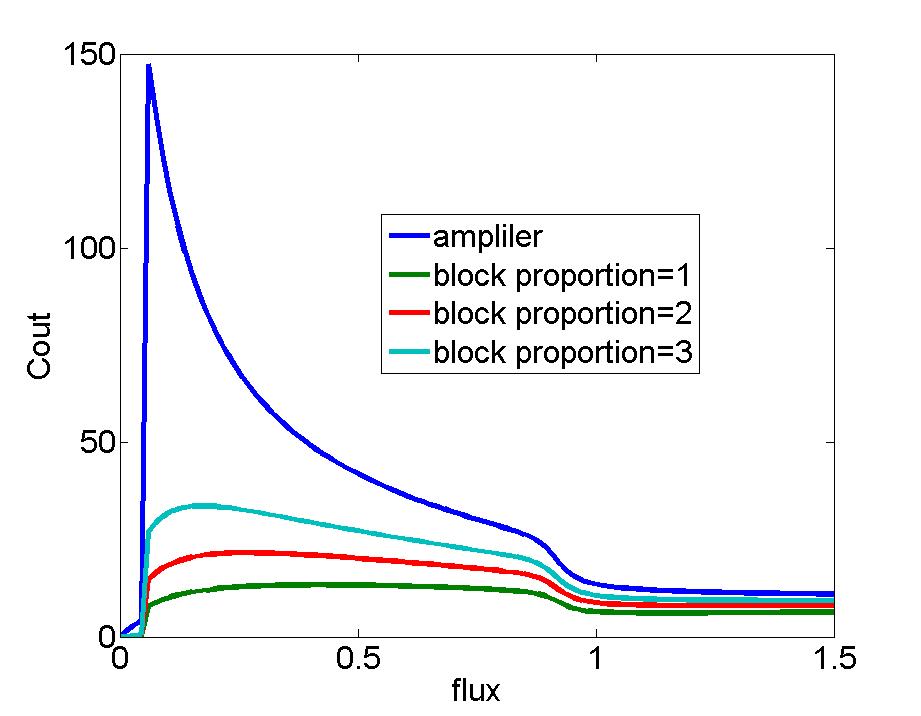 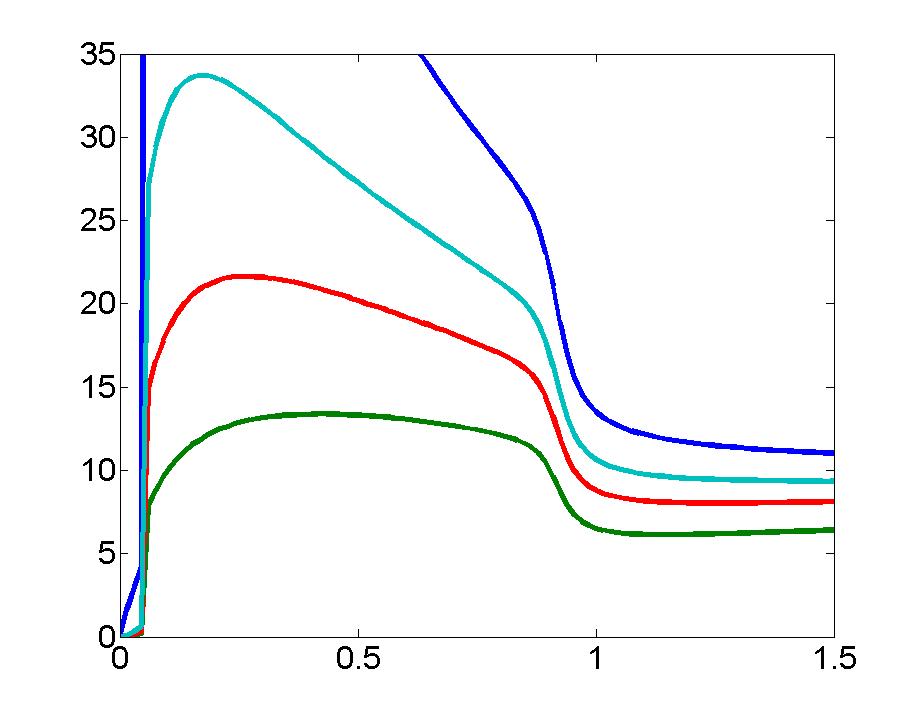
Flow direction from block to amplifier(breakdown)
1.relation between the concentration and the input concentration at different proportion betweeen the volume of the amplifier and the volume of the block.(the concentretion contains two curves,the amplifier(the output concentration) and the block)
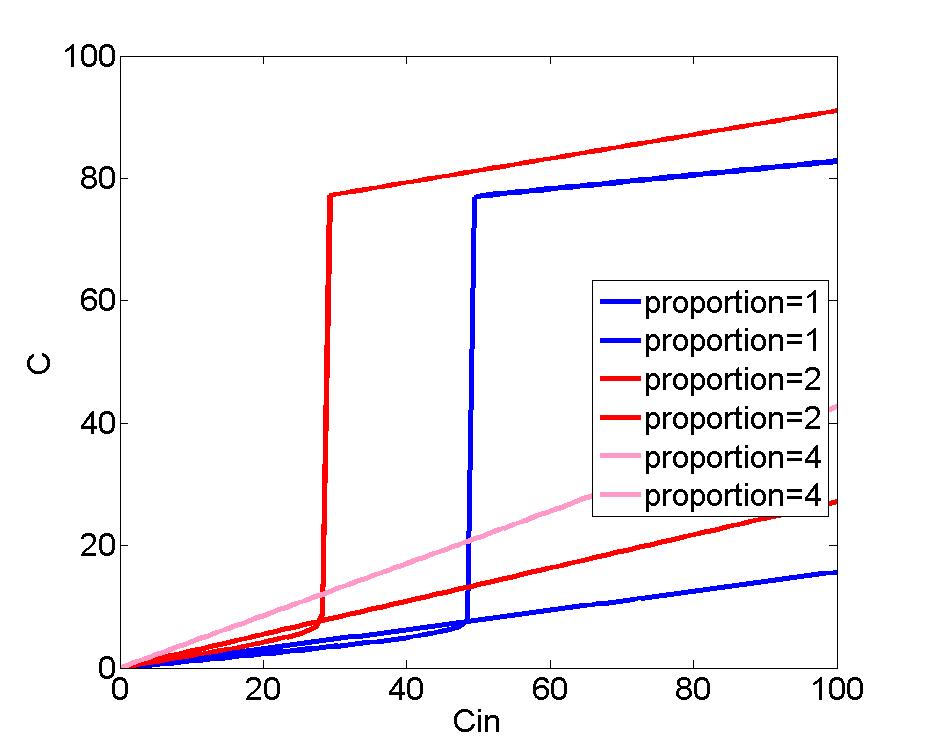
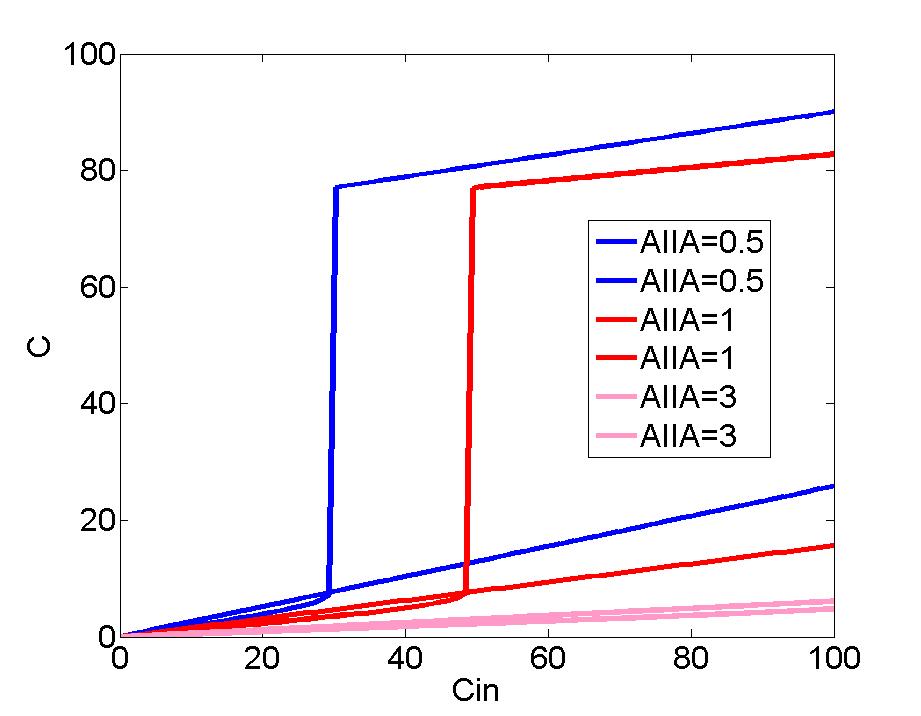
2.relation between the concentration and the input concentration at different concentration of AIIA.(the concentretion contains two curves,the amplifier(the output concentration) and the block)
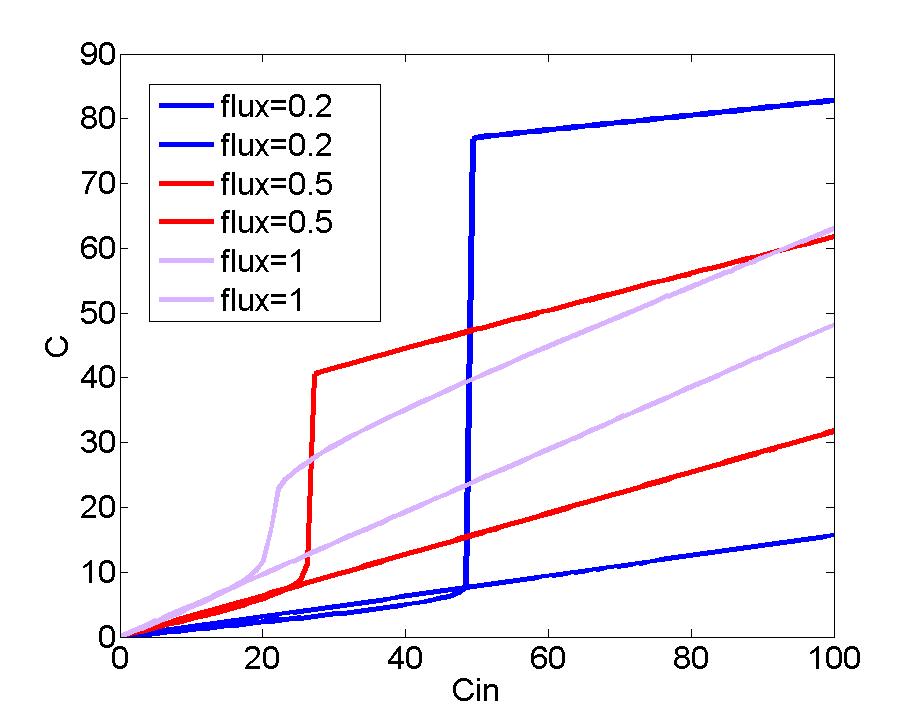
3.relation between the concentration and the input concentration at different flux.(the concentretion contains two curves,the amplifier(the output concentration) and the block)
|