Modelling
From 2007.igem.org
Mathematical Modelling
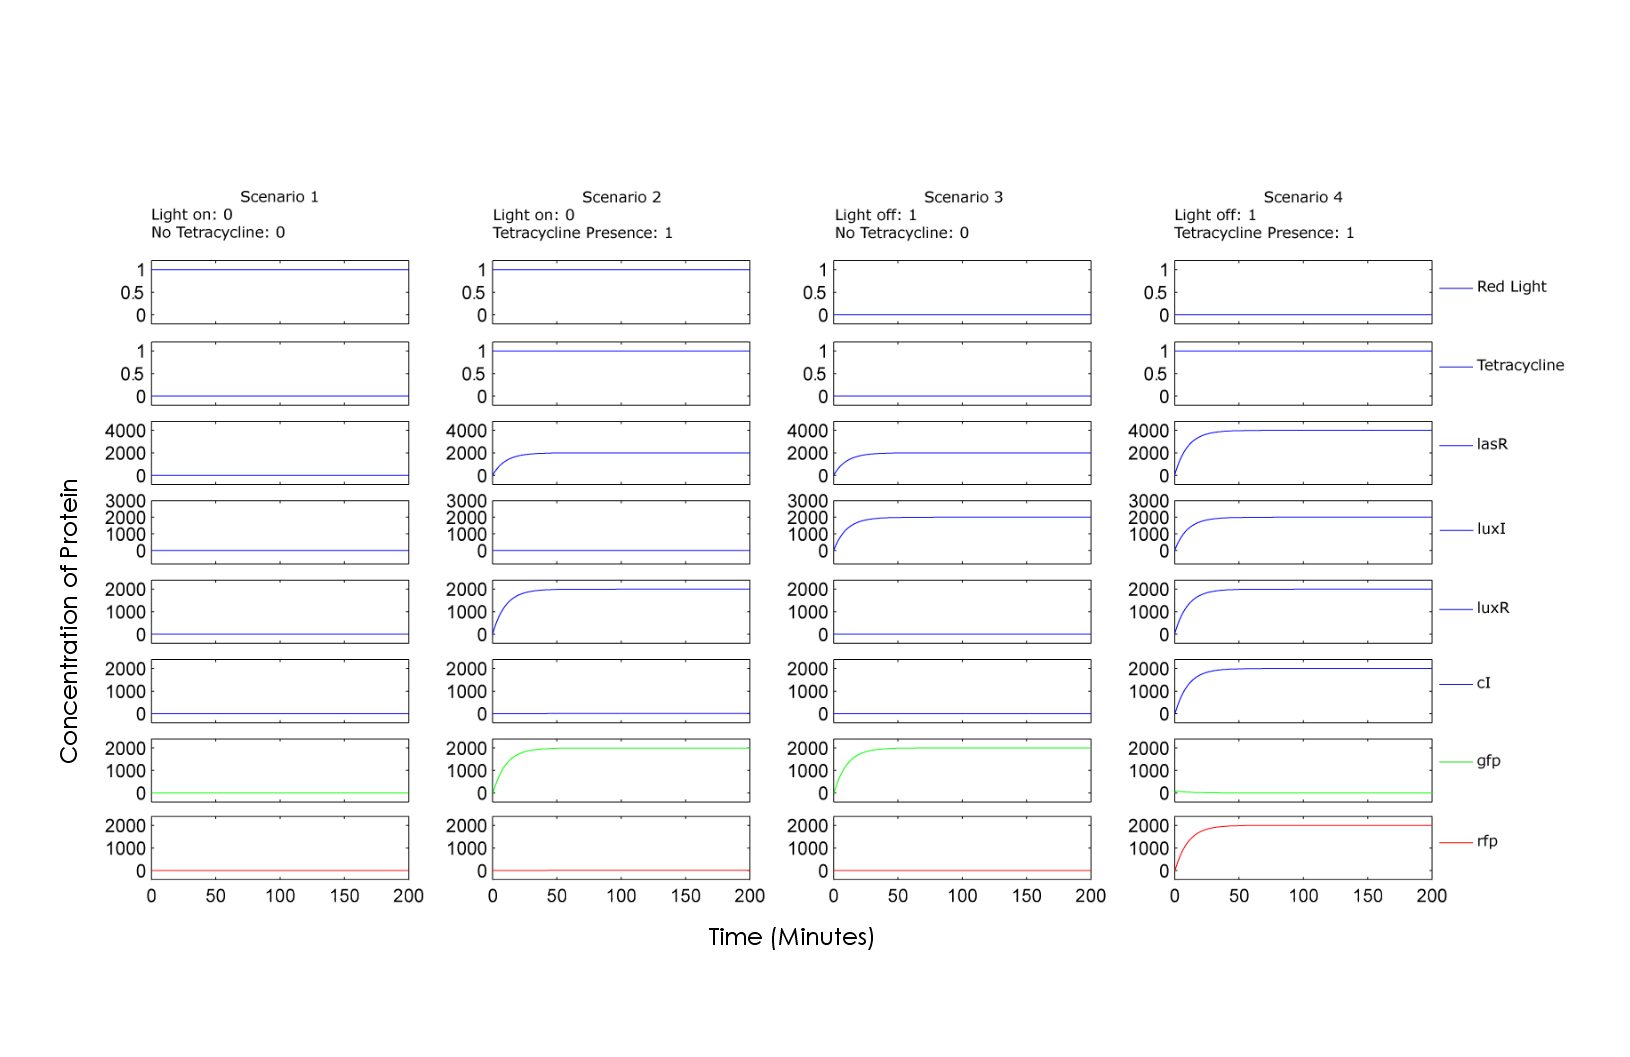
To create a predictive model, we used a set of differential equations to graph the approximate concentrations of each chemical with respect to time. These graphs are intended to illustrate the relative concentrations of the chemicals involved for each possible combination of inputs. The first quarter of the graph (t=0 to 500) illustrates the concentration of chemicals when adding 0+0; the second quarter (t=500 to 1000) illustrates the 0+1 case; the third quarter illustrates the 1+0 case; and the fourth quarter the 1+1 case.
Home

