Paris/Results
From 2007.igem.org
Contents |
Experimental results
dapA deletant growth
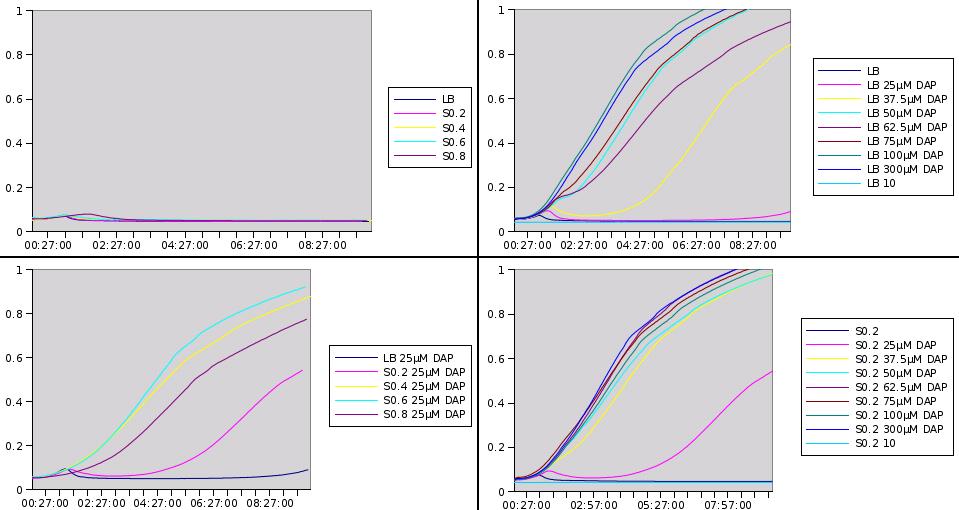
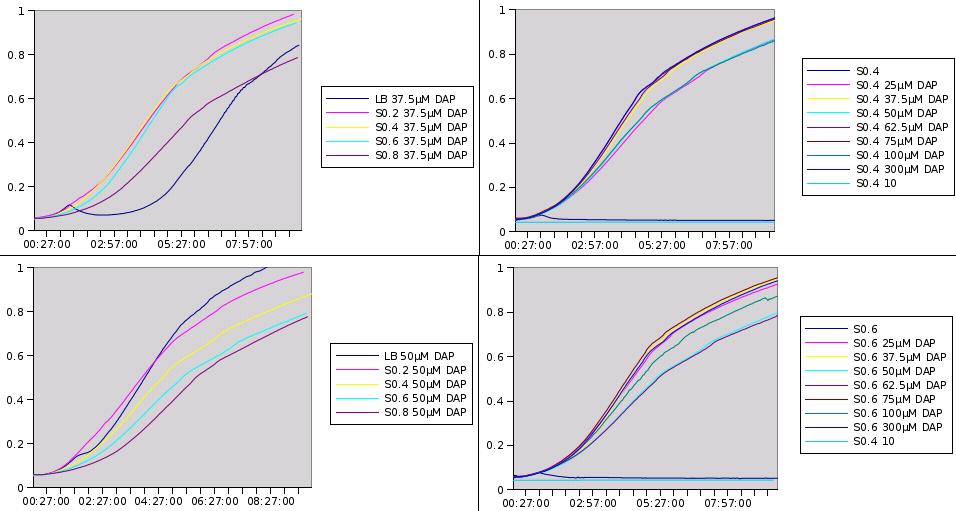
We expect the somatic cells to excrete only a limited amount of DAP, it would thus be nice if our auxotroph strain could grow on limited amount of metabolite. Over night culture were diluted 100 time in LB suplemented with different amount of DAP.
The experiment descripbed above has been performed on 28/09/07
Several such experimens were performed at other dates
06/08/07
Survival of dapA deleted strain and Co-culture experiments
If we want our system to be robust, the germ line cells should be able to live as long as possible when deprived of DAP. They may indeed face such a feat within our system if their is not enough somatic cells at a given time.
Our dapA deleted strain was grown over night in LB + 300µM DAP. A culture was then launched diluting 100 time the ON culture in LB (+ Kanamycin). 100µL were plated each hour and the number of clone determined.
We also want to know if the soma of our synthetic organism will be able to feed the germ line. Unfortunatly, this cannot properly be done without the final construct. Nevertheless, we can already check if in similar situations, dapA deleted strain can survive.
Two different co-culture experiments were performed:
- In the first one, the dapA deleted strain is grown with a prototroph strain. In this case, we know for sure that the prototroph cells will take the population over. Nervertheless it is interesting to see if dapA deleted strain survive longer in this condition than if alone and without DAP.
(the experiment has only been done once, and would be worth repeating to confirm the results)
We can draw from this curves two important conclusions:
1. Most of the cells die within the first 2 hours of culture, but a small fraction of the cells are still alive after 8 hours. A part of the dapA deleted cells can thus survive for quite long, which is a good point for us.
2. When in coculture with a prototroph cell, around 100 time more cells have a long term survival. This means that the dapA deleted strain benefits a bit from the prototroph cell presence and its DAP production capacities.
- In the second coculture experiment, the dapA deleted strain is grown with a strain bearing an auxotrophy to another metabolite. This experiment reproduces cross-feeding works done on the yeast by Shou W et al. (Synthetic cooperation in engineered yeast populations, PNAS). In this coculture there is a mutual dependence of each strain for the other. If this works, then we know for sure that dapA deleted strain can be rescued by a strain producing DAP!
Our dapA- strain was grown with a tryptophan operon deleted strain. The culture was plated to check the presence of both strains after 8H. They were both present in concentration above 5*10^4 CFU/Ml. This clearly means that DAP is a good choice as our auxotrophy metabolite !
DAP excretion by prototroph cells
We want to know if prototroph cells are excreting DAP and in what amount. Instead of doing proper chemical dosages which are expensive, we had the idea to make a biological measurements. If we want to quantify DAP concentration of a given medium, we might be able to do so simply by looking at how well a dapA- strain grows into it.
Prototroph MG1655 strain was grown in LB, and the medium was recovered at different stages of the culture and purified. The dapA deleted strain was then grown in the recovered medium. What we observed is that no enough DAP is present for any growth to happen. From this point we decided to add little concentration of DAP into the recovered medium, to see what is the minimum amount to add to obtain growth. If this amount is small then it means that there is already quite a lot of DAP present into the medium. Typically if we need to add 10µM of DAP to get a growth similar to LB supplemented with 20µM, we can estimate that the initial concentration is around 10µM.
More rigorously, what we measure isn't really the DAP concentration of the medium, but rather what we could call DAP equivalents. This is mainly due to two points. First, dapA gene is the first out of 5 genes making the steps from aspartate-semialdehyde to DAP. So we measure in fact the sum of all intermediaries of the pathway that may be present in the medium and imported by the cells. This is not a problem for us since we do not really care with what exact compound the soma feeds the germline. Second, the recovered medium isn't really LB anymore, so it is not perfectly rigorous to compare it with LB. There might be other compounds excreted during growth, compensating for the DAP starvation. But we do not really care either if this is the case. What we really want to see is how much the excretions of a prototroph cell can favor the growth of a dapA- strain (regardless of what excreted compound matters). And we measure this as DAP equivalents.
Here are representative results of what we got from this experiments:
Medium recovered from MG1655 culture broth are annotated S0.2, S0.4, S0.6, S0.8 and were recovered at optical densities of respectively 0.2, 0.4, 0.6 and 0.8. The added DAP concentration is given.
We clearly see that the latter we recover the medium in the prototroph growth, the less DAP we need to add to obtain growth. This is one more hint that DAP is a good choice for the SMB and we can also try to estimate DAP equivalents for our media. For instance the growth in S0.2 with 25µM of added DAP seems equivalent to the growth in LB with 37.5µM added DAP. This means that S0.2 contains around 12.5µM of DAP equivalents. Nevertheless it was quite hard to retrieve any reliable data from this experiment.
By using the experiment of the 06/08 and of the 28/09 we find the production of DAP by 2 different strains to be :
| S0.2 | 10 µM |
| S0.4 | 20 µM |
| S0.6 | 25 µM |
| S0.8 | 28 |
The experiments described above have been performed at various times A correspondance between optical density and number of cell was used to plot the real cell growth curves, as well as the growth rate ( dX/dt / X). These curves allowed to extract parameter for the models.
Recombination frequency measurements
In the section “Design Process”, the question of the recombination frequency has been addressed. G to S differentiation frequency, and thus lox recombination frequency on which it is based, is a key aspect of our system. Indeed, optimal overall differentiation frequency lies somewhere between 0 and 50% per generation.
We would like to have tunable recombination device in order to find the optimal frequency, which lies somewhere between 0 and 50% of recombination per generation. We should be able to tune the recombination frequency by modulating the Cre recombinase expression. In order to do this, we have cloned Cre under the control of the pBAD promoter. We then wanted to characterize our "Cre generator device", and determine the relation between Cre expression level and recombination frequency.
Three types of experiments were planned and partially performed in this regard:
- Experiments using FX85 strain harboring lox-KmR-lox cassette: indirectly measuring recombination frequency by plating on Kan plates after Cre expression assays.
- Experiments using FX85 strain harboring lox-KmR-lox cassette: indirectly measuring recombination frequency by studying growth rates.
- Experiments using the recombination measurement biodevice.
A) Experiments using FX85 strain harboring lox-KmR-lox cassette: indirectly measuring
We used FX85 strain (provided by Francois-Xavier Barre) carrying the cassette: lox-KmR-lox inserted into its chromosome. We transformed this strain with our pBad-Cre construct (carried by an Ampiciline resistance plasmid: pSB1A2). Inducing of Cre expression with different arabinose levels was performed. The last step is then spreading on selective plates (Amp or Amp+Kan). The ratio between the number of clones on the two types of plates should give us an estimate of the recombination frequency. When we tried to do this, we did not get any clones on the Amp+Kan plates, even without Cre induction. But this doesn't mean that the recombination frequency is 100%. In fact, if the recombination frequency is around 50% per generation or higher, no colonies can grow on kan plates, simply because half or more of the cells will die at each generation (those who recombine are not resistant to Kanamycin any more after little time).
This means that our Cre generator is quite leaky and gives already quite high recombination rates without induction.
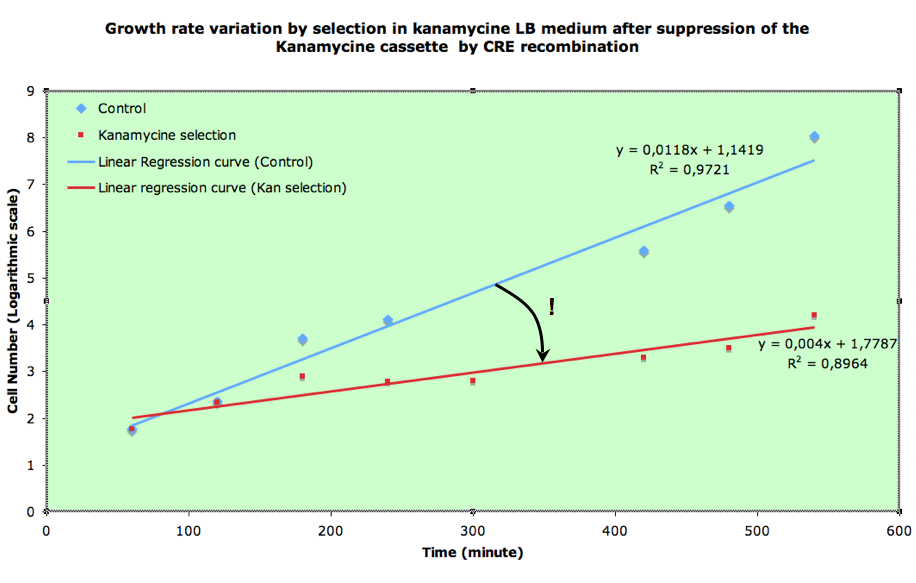
B) Experiments using FX85 strain harboring lox-KmR-lox cassette: indirectly measuring recombination frequency by studying growth rates.
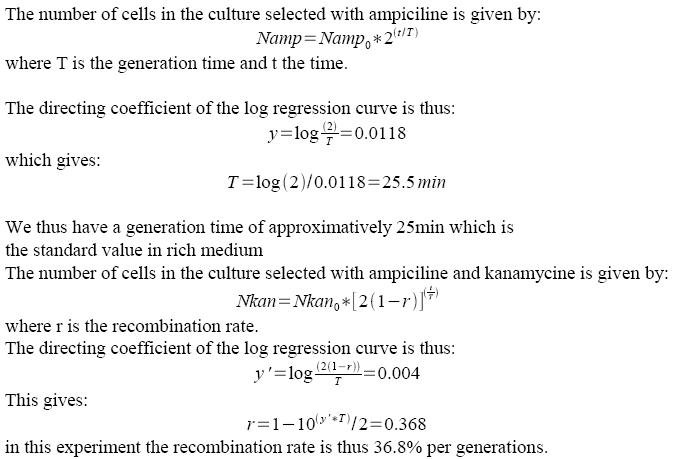
If recombination frequency is two high in our experimental system, then no growth can be seen on Ampiciline (plasmid selection antibiotic)+ Kanamycin (screens against recombinants: cells having excised lox-kanR-lox from their genome). We tested an alternative strategy in order to circumvent this problem. In order to determine what recombination rate we had, we performed another experiment. FX85 strain was transformed with our pBad-Cre construct. Directly after transformation, liquid cultures were launched with either Amp or Amp+Kan. 100µl of the cultures were regularly plated on LB+Amp, giving the following growth curves:
C) The third strategy is based on a more direct observation of recombination rate.
We have constructed a “Recombination frequency measurement” device. The schematic structure of this genetic construct is as follows:
This consctruct has been generated, SEE HERE the steps of it’s construction.
This construct has yet to be inserted in the genome. Cre induced recombination frequency measurements will then be performed. Using this system, an event of recombination is accompanied by a switch in fluorescence from GFP to mRFP wich can be followed under microscope on small E.coli populations.
dapAp characterisation
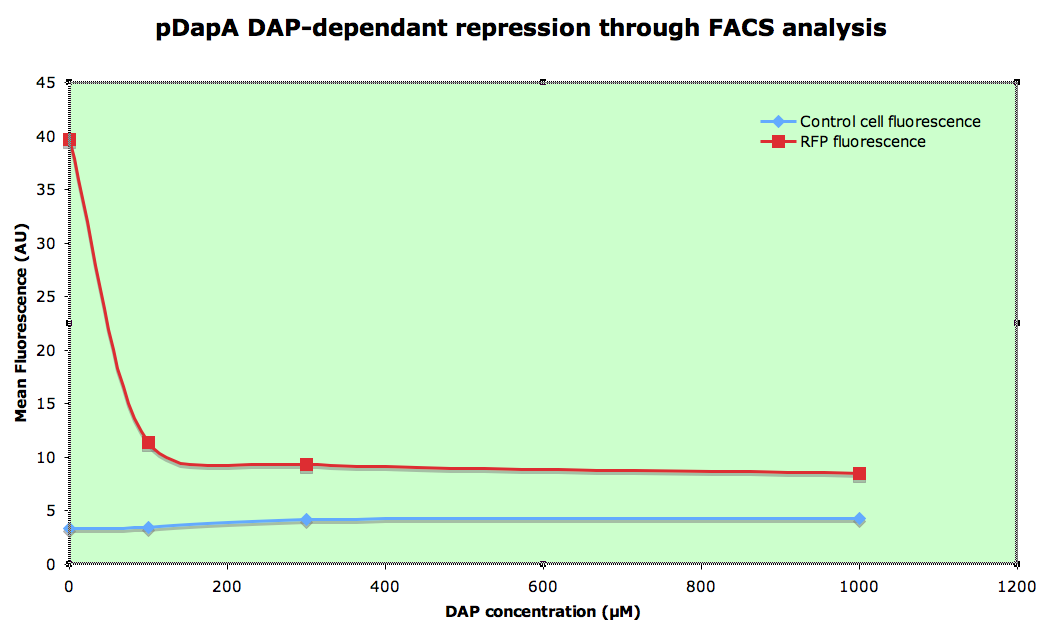
Knowing that cells cannot grow in a 0µM DAP environment, we then simulated it by dilluting overnight 300µM DAP LB culture at 1/100e in minimal medium M9 (in order to slow down the growth speed) without DAP during 1h before analysis.
All analyses are done on 1/100 dillution of overnight LB culture made in minimal medium M9 at 4°C.
Comparing of dapA genes of E.coli & B.subtilis
DGAT cloning and triglyceride synthesis in E. Coli
- TG synthesis experiment
1. We transformed chemically competent E.coli (DH5alpha) with pBluescript SK minus vector (Stratagene) (ampicilline resistance and pLac promoter) baring DGAT gene (pKS::DGAT). In this vector, dgat transcription is induced by IPTG.
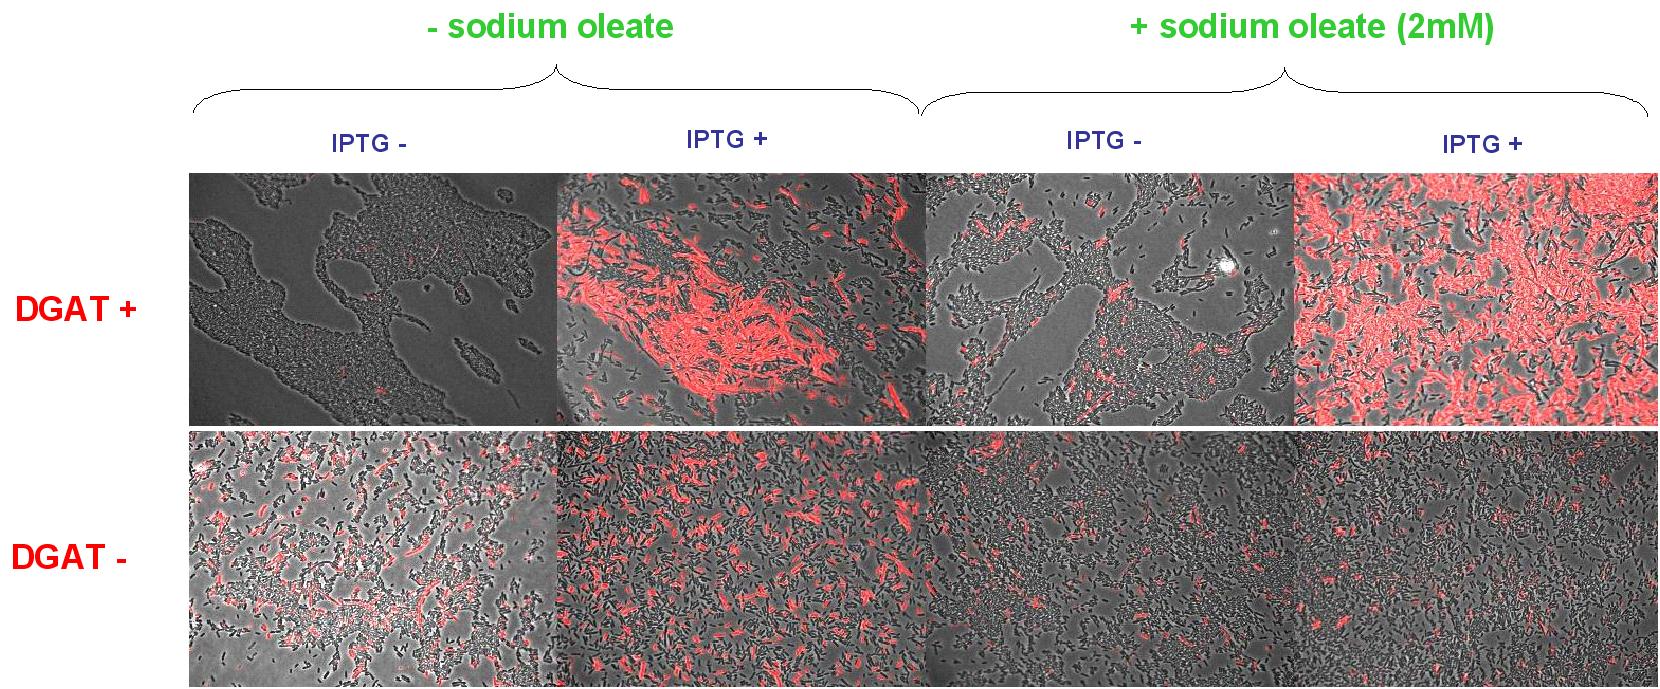
Nile Red fluorescence dye was used, at a concentration of 5µg/mL to monitor lipid inclusions in different conditions of DGAT expression and fatty acid availability:
(0.4mM IPTG induction in LB medium with or without sodium oleate 2mM). Results are shown below.
Line 1 represents E.coli transformed with pKS::DGAT; and Line 2 the negative control (E.coli transformed by part B0015). Columns 1 and 2 are LB medium without sodium oleate supplementation; columns 3 and 4 are LB with sodium oleate supplementation (2mM). Columns 1 and 3 are without IPTG; columns 3 and 4 with IPTG induction (0.4mM).
We can observe lipid inclusion into E.coli transformed by pKS::DGAT with IPTG induction.
No significant difference is seen between the +/- oleate cells.
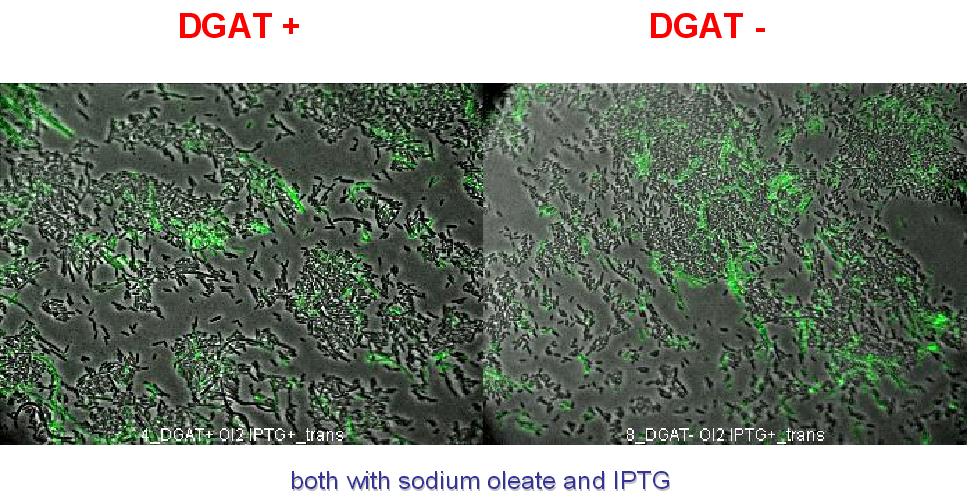
2. To exclude that the fluorescence observed is due to DGAT induced cell death. A cell death marker (green) is used. It can be seen below that cell death is not increased upon DGAT expression.
3. We started creating DGAT biobrick BBa_I718002:
- PCR based mutagenesis was performed to eliminate a PstI site in dgat coding sequence.
- We attempted adding biobrick prefix and suffix sites to dgat but have yet to finish the cloning process :-(
Modeling results
The goal of our modeling work was to test our design, mainly to identify potential flaws of the system at early developmental stages. An extensive description of simulation & mathematical tools is provided later.
- In part 2, we showed that the system can present – at least qualitatively – the desired behaviour: an exponential growth of the two populations of coexisting cellular types.
- In part 3, our results indicated that the system's behavior should be reasonably robust, and provided arguments in favour of the design having a negative regulation of recombinase expression by Dap (increased robustness and tunability).
In all cases, models incorporating additional details, related to space and/or stochasticity, indicated that these phenomena should not affect the global behavior of the system. So previous conclusions, obtained using deterministic models, should remain valid despite the fact that we neglected noise- and space-related issues. This result is not surprising. Intuitively, even if SMB system is heterogeneous (because it is composed of two distinct populations of cells), the spatial distributions of both cells types are uniform; thus, the system evolution is space independent. Nevertheless, we were interested in checking the property using models and simulations. In fact this led us to use and develop original techniques (like Delaunay triangulation or extended to nested membranes systems Gillespie algorithm). From a general point of view, developing such techniques is also of great interest for synthetic biology. Following the concepts of decoupling and abstraction that characterize biosynthetic developments, we have to ideally validate and study designs before constructing them physically. These validations appear at each step of a standard development, at the levels of systems, devices and bricks designing. We tried to follow and contribute to this methodology by considering at first phenomenological and global models, and molecules scaled models at last.
Getting back to SMB, we would like to stress here that these results should be taken with great care, given the extreme simplicity of our models and the lack of data to provide information on parameter values and initial conditions. But still, globally...
- ...all these results corroborate our initial design.


