Dry to Wet
From 2007.igem.org
Contents |
Christine's Bit
Toby's Bit
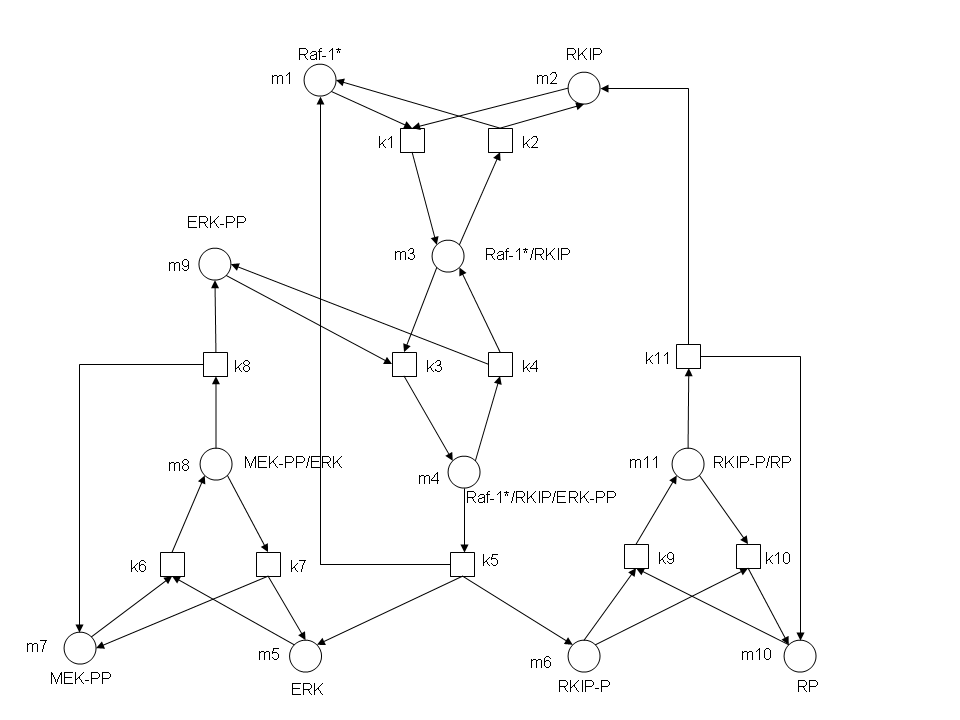
After gaining a thorough understanding of methods involved with modeling simple mass-action reactions, we can move on to more complex systems such as the RKIP network.
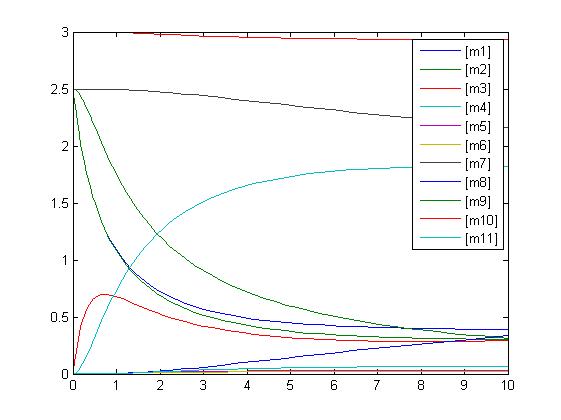
In the above diagram, substrates, enzymes and substrate/enzyme complexes are represented by numbered circles, rate constants are represented by numbered squares. By isolating individual species and their direct peripheral species (those being formed from or forming the isolated species) we are able to treat the group as a simple mass-action reaction. A differential equation is then found for each species based on the rate constants and code can be written and a graph plotted showing the trend of all the species’ concentration over time giving the following graph:

