Modeling
We use ODEs to simulate the system. Datas used in the model are based on the literature and would be adjusted to match the experimental results.In the model we assume that the flux through each pipeline is identical and the block maintains a stable state.
The simulation result is as follows:
Amplifier
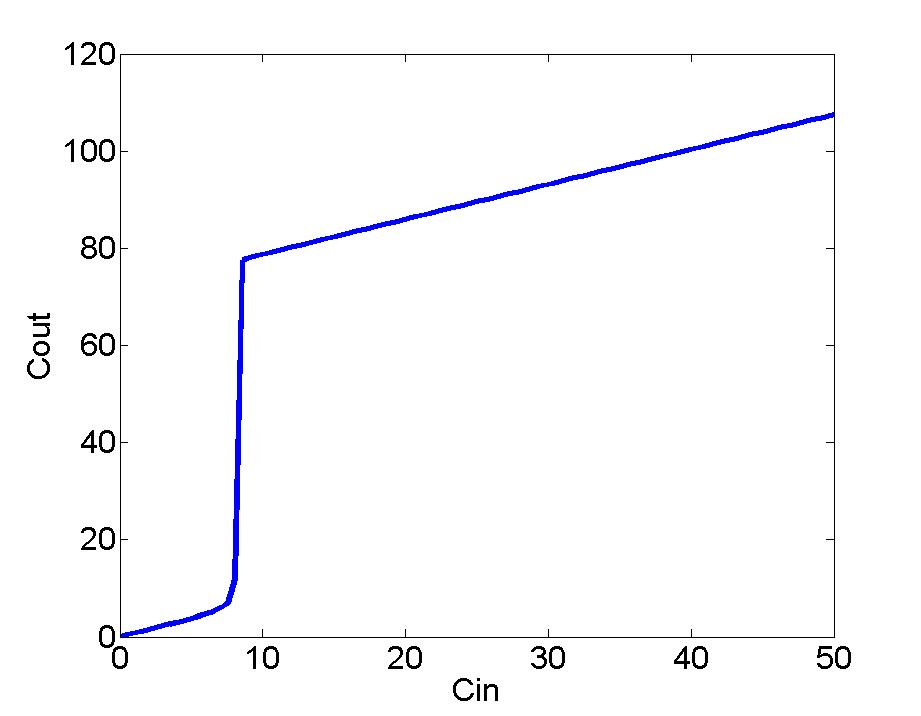
1.relation between the input concentration of the amplifier and the output concentration of the amplifier
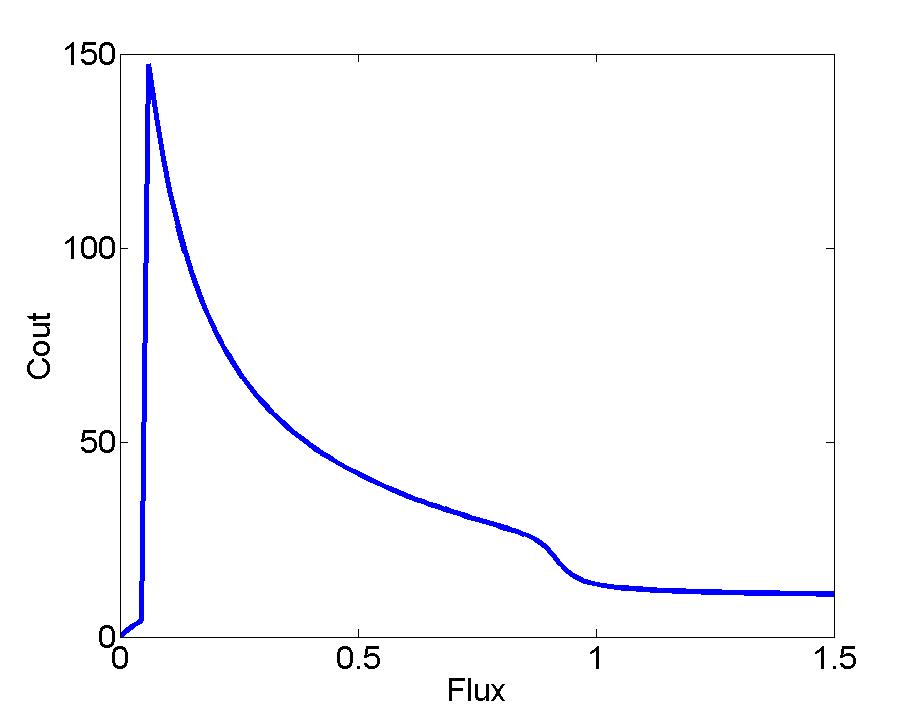
2.relation between the flux of the amplifier and the output concentration of the amplifier
Block
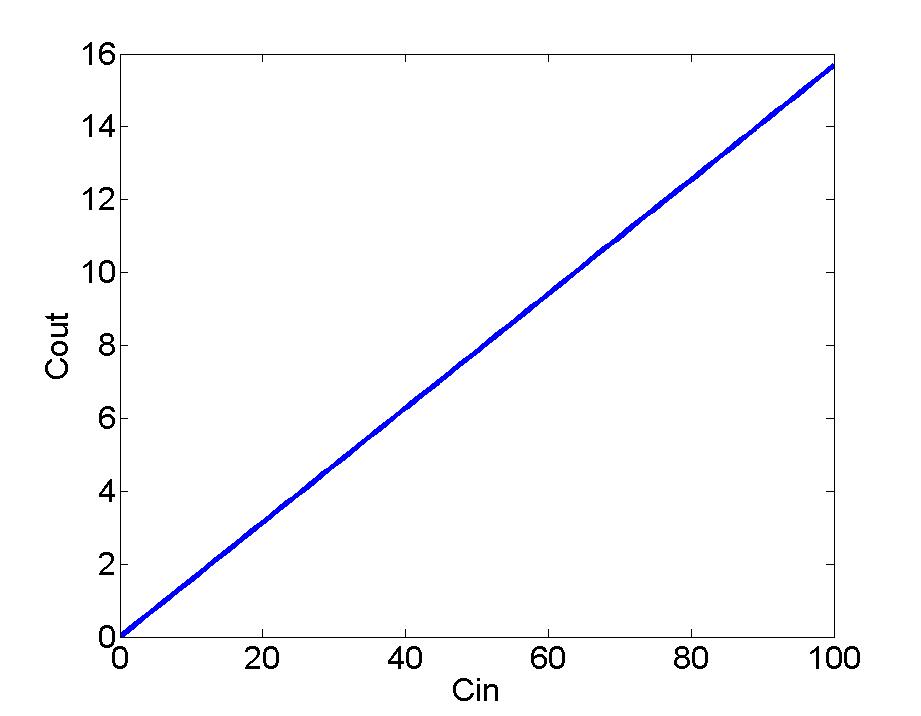
1.relation between the input concentration of the block and the output concentration of the block
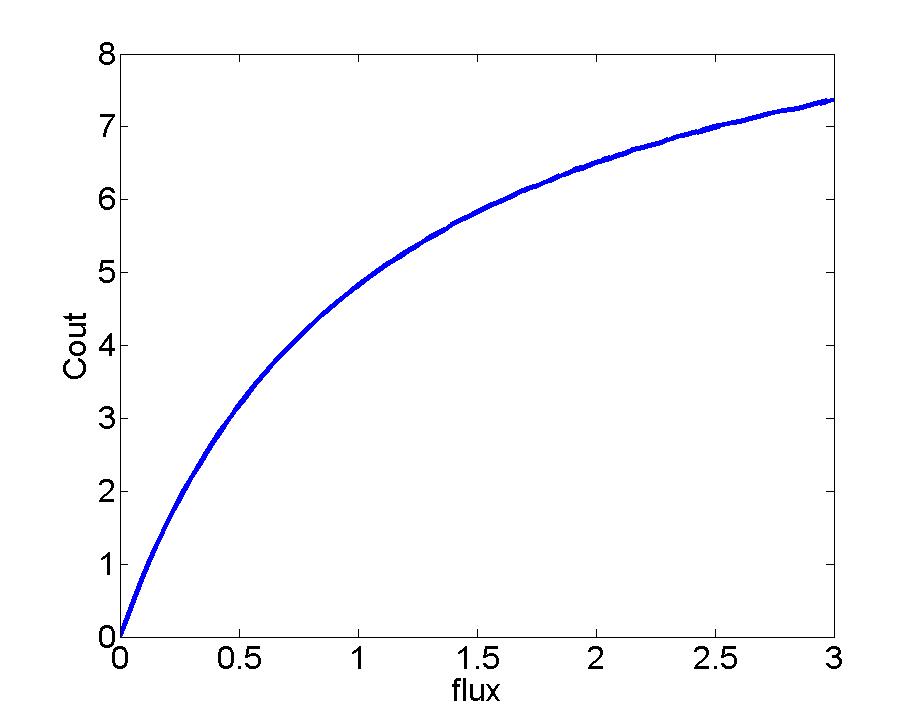
2.relation between the flux of the block and the output concentration of the block
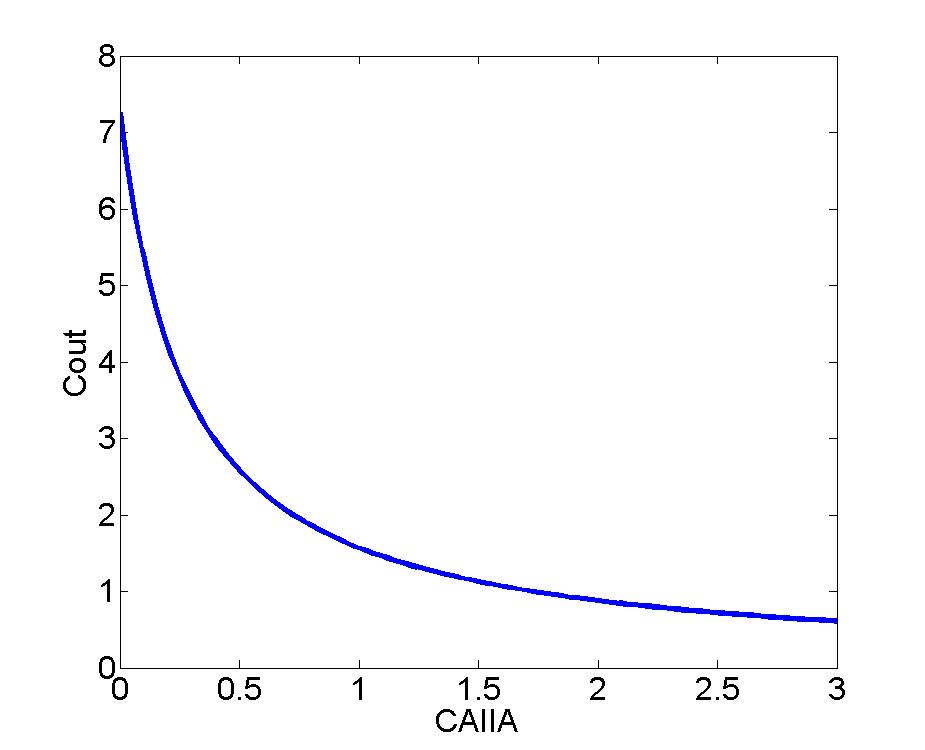
3.relation between the concentration of AIIA in the block and the output concentration of the block
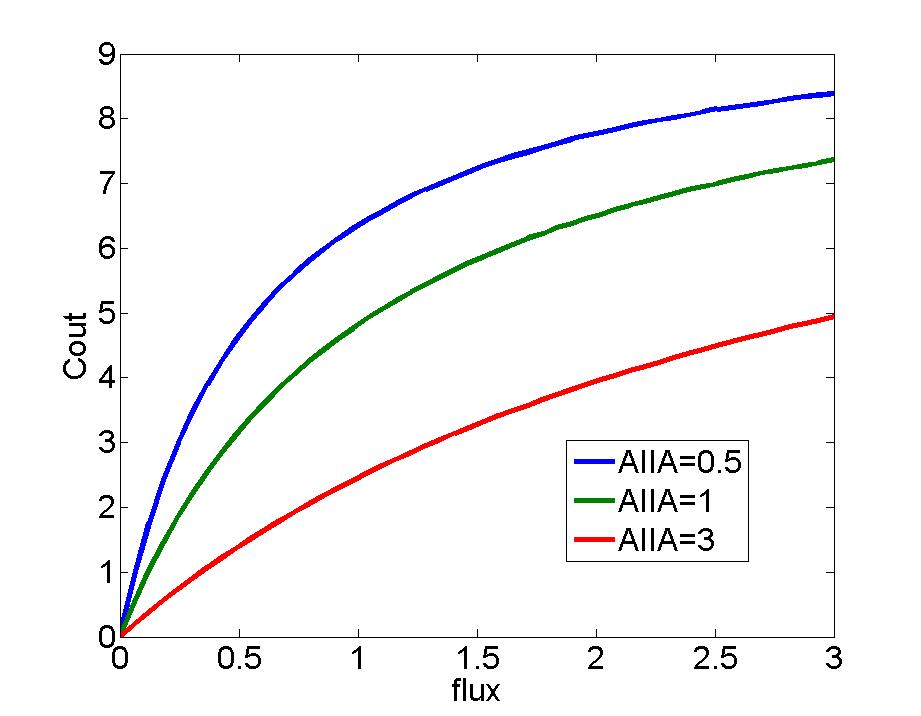
4.relation between the flux of the block and the output concentration of the block in different concentration of AIIA
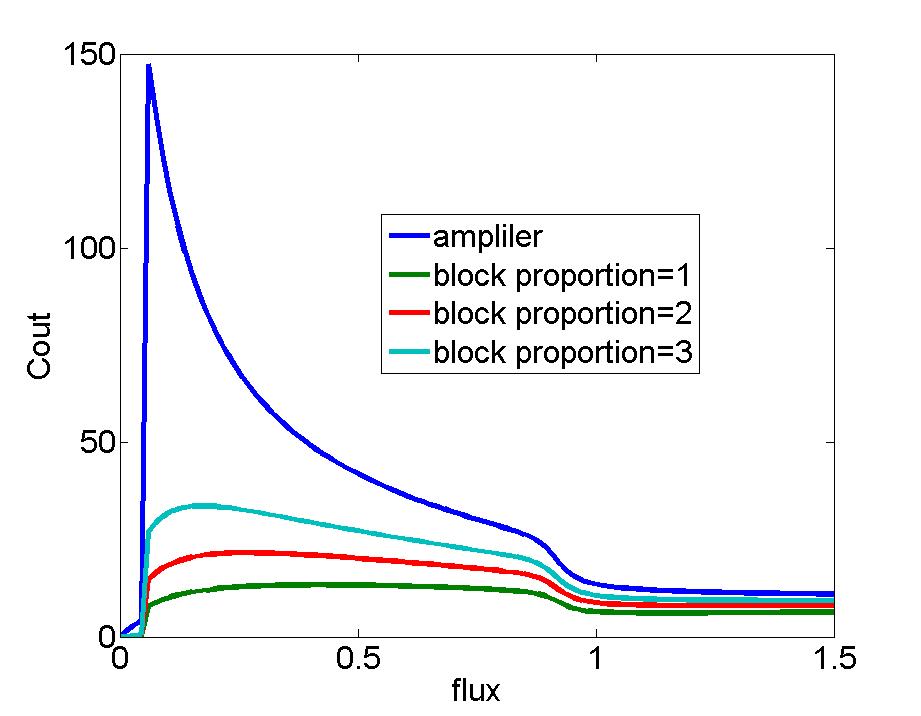
Flow direction from amplifier to block
1.relation between the concentration and the flux at different proportion between the volume of the ampilier and the volume of the block.(the left image is a part of the left image)
 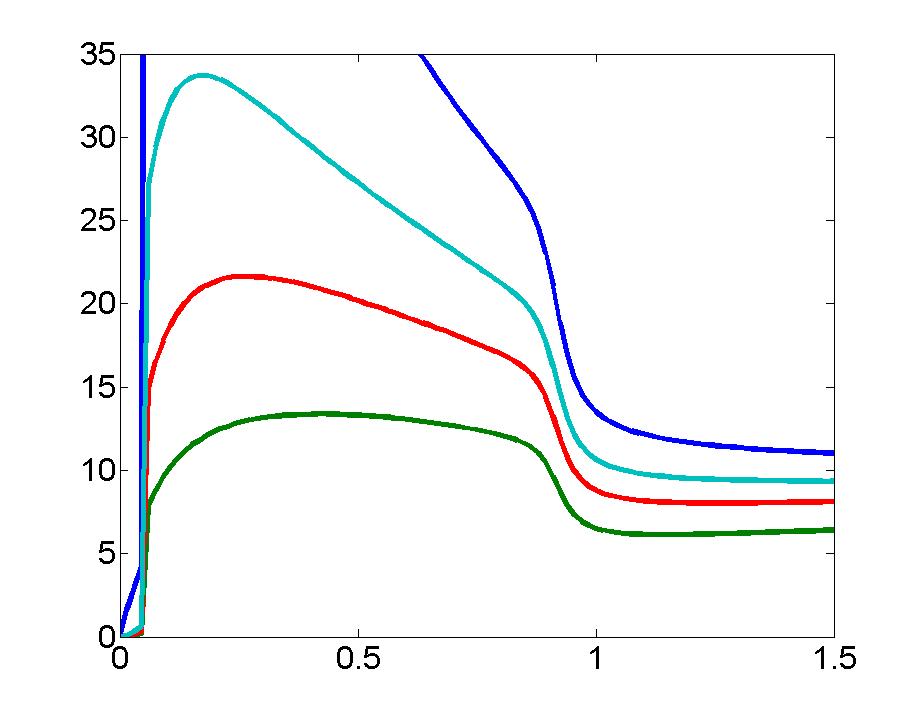
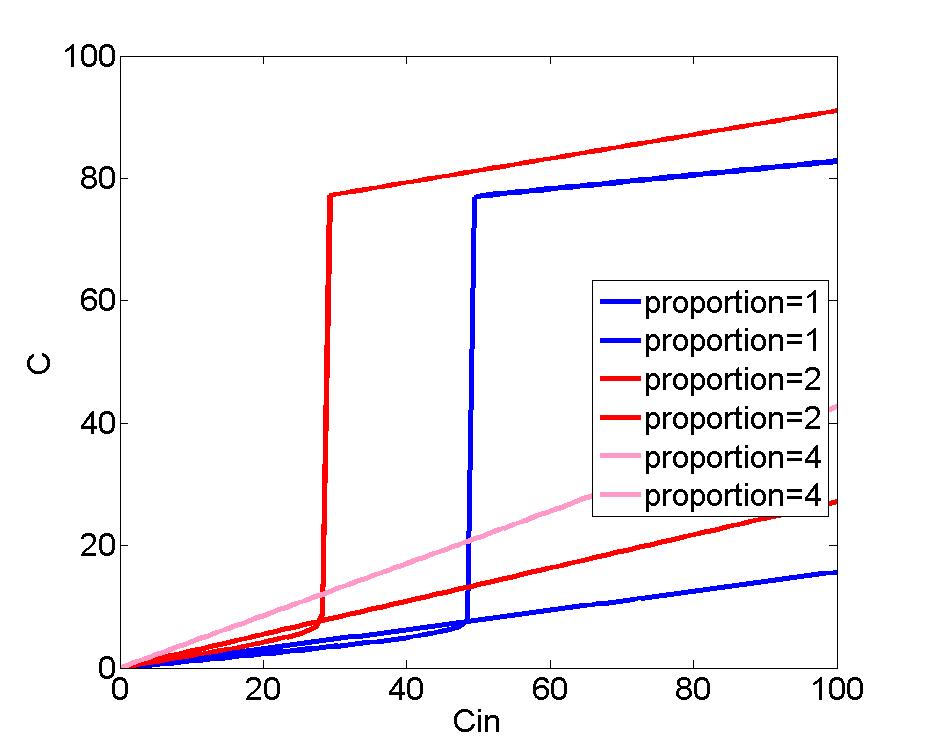
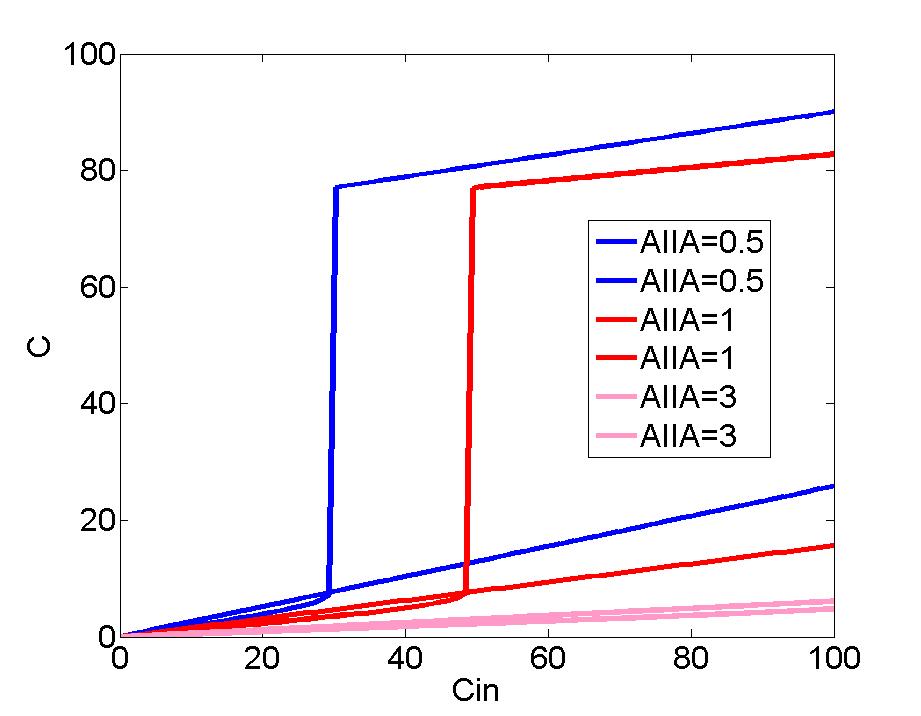
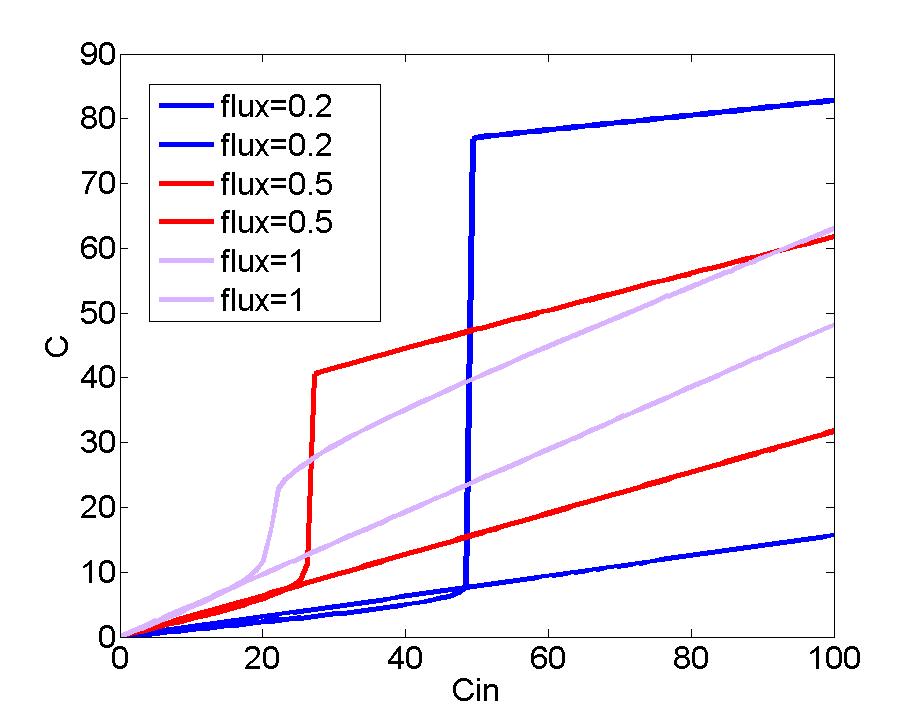
Flow direction from block to amplifier(breakdown)
1.relation between the concentration and the input concentration at different proportion betweeen the volume of the amplifier and the volume of the block.(the concentretion contains two curves,the amplifier(the output concentration) and the block)
2.relation between the concentration and the input concentration at different concentration of AIIA.(the concentretion contains two curves,the amplifier(the output concentration) and the block)
3.relation between the concentration and the input concentration at different flux.(the concentretion contains two curves,the amplifier(the output concentration) and the block)
|