Tianjin/DIODE/Experiment
From 2007.igem.org
Figure 1: Regardless of the cell concentration, production of GFP (Represented by the intensity of fluorescence) has a linear relationship with the concentration of AHL within the range of 0.01-1 uM.

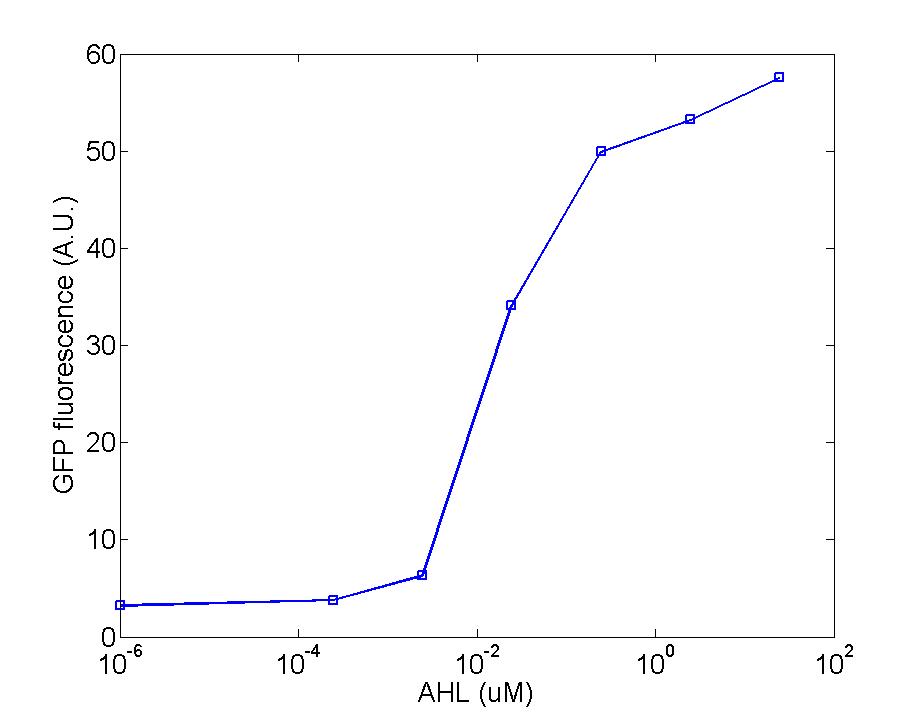
Figure 2: The production of GFP is initialized when the concentration of AHL reaches to 0.01uM, then keep increasing linearly within the range of 0.01-1um, finally varies unconspicuously at values over 1um.

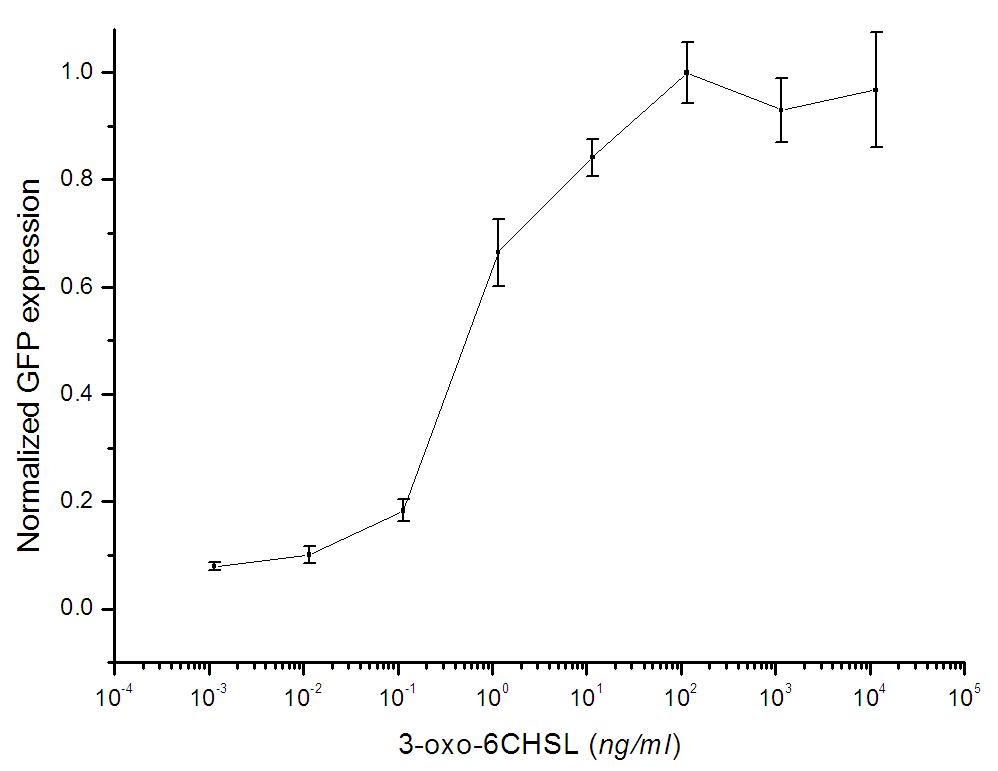
Figure 3: The dependability of this measuring method is tested by calculating the standard deviation of datas from three parallel experiments. As shown on the graph, the length of vertical lines display the value of standard deviation at a particular concentration of AHL, so the denser AHL is, the more inaccuracy the data could be.

Figure 4: Relationship between the cell concentration and the expression of GFP. Obviously, GFP accumulates with the growth of E.coli cells.
